
The Liquidity View in the Bybit EU trading interface shows the current market depth for the selected trading pair. The "Market Depth" refers to the ability of the market to keep prices unchanged when undertaking large transactions. The depth seen in the chart reflects the real-time outline of buyers and sellers’ orders awaiting execution at each price point.
The liquidity view is a key tool to analyse the current market situation for each trading pair as it will provide the following insights:
1. Determine the present level of market movement for buying and selling through the size of the orders.
Generally, the larger the entrusted buy order, the higher the enthusiasm for buying and the price will be more prone to rise. Conversely, the larger the entrusted sell order, the higher the enthusiasm for selling and the price is likely to fall.
2. Determine the price fluctuations through the order price difference.
If there is a large difference between the last traded price and the next best available price, it means that a large amount of transactions is being executed at this time and price fluctuations are likely to occur. On the other hand, if there is a small difference between the last traded price and the next best available price, a small amount of transactions are being executed which may lead to less price fluctuations.
Important notes:
The depth chart represents the number of orders pending to be filled. It is possible that traders may cancel the orders before execution, hence predicting the trend completely according to the depth chart may not be possible. Therefore, always trade with caution.
How to read the Liquidity View
|
On Spot Trading Pages
|
Price
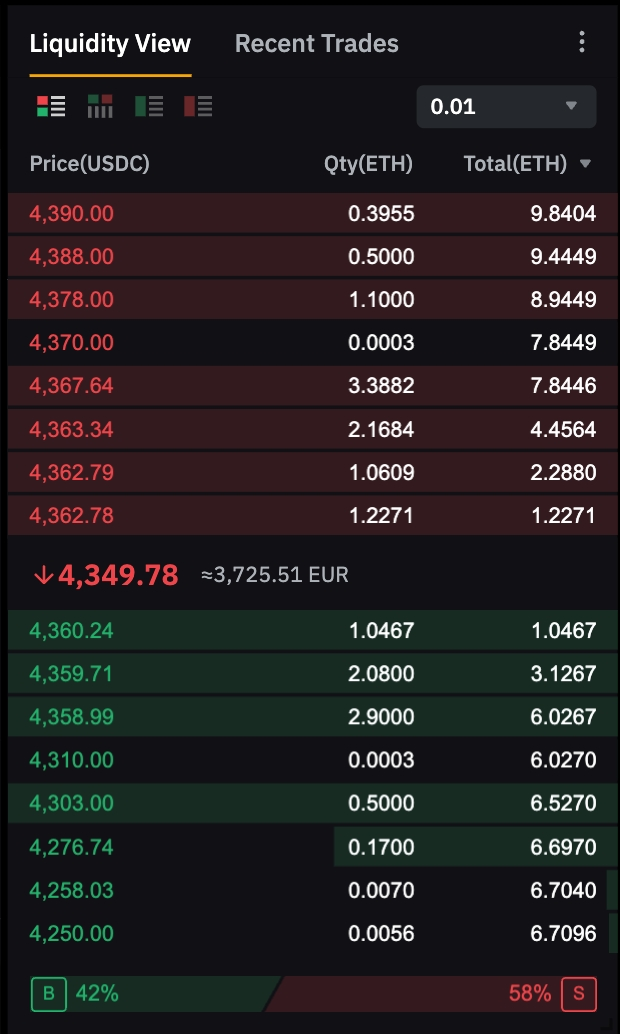
On each trading page, the Red prices in the liquidity view represent the selling price, while the green prices represent the buying price. The price visible in the middle of the liquidity view is the Last Traded Price. The current best ask price (in red) and best bid price (in green) will be located right above and below the Last Traded Price respectively.
For all Spot Trading liquidity views, you will see the Last Traded Price current indicative value in your selected fiat currency indicated in grey.
Quantity
The Quantity (Qty) represents the number of contracts at the stipulated price, while the Total represents the accumulated number of contracts accordingly.
The buyer/seller bar that you see at the bottom indicates the ratio in real time between buyer and seller orders based on order quantity for the specific trading pair.
In the same way, the background red and green bars visible behind each price point shows the ratio of available quantity for each specific price.
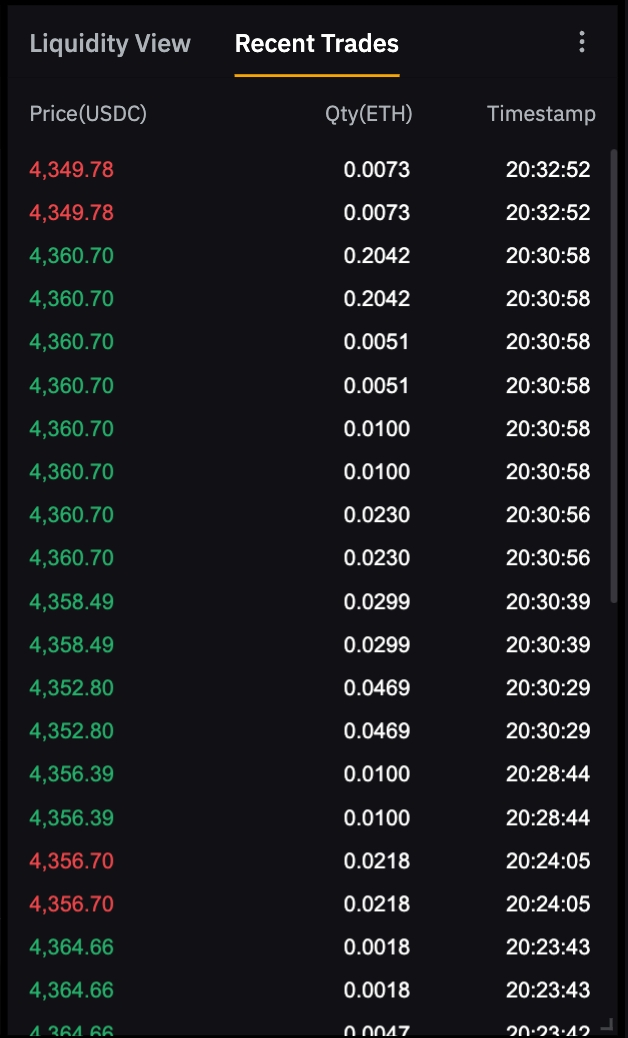
Recent Trades
In the Recent Trades tab, you will see the latest executed orders in both directions as well as the order quantity and the timestamp:
-
Price: The prices’ colors indicate the direction of the trade: Red is for Sell orders and Green is for Buy Orders.
-
Quantity: The quantity is the amount of contract that was effectively executed for each order.
-
Timestamp: The time will be shown in your device’s timezone and this timezone cannot be changed.
Example
Taking the Spot Trading liquidity view above as an example, here is an example of the information you can retrieve from the liquidity view:
|
|
Last Traded Price: 4,349.78 Current best ask price: 4,362.78 Available quantity at the best ask price: 1.2271 Current best bid price: 4,360.24 Available quantity at the best bid price: 1.0467 Market sentiment for this trading pair: 42% buyer - 58% seller If we want to increase the price to 4,362.79, we will need to buy at least 1.2271 contracts. |
How to Customize the Liquidity View display
Here are the different ways you can display the Liquidity View based on your preference:
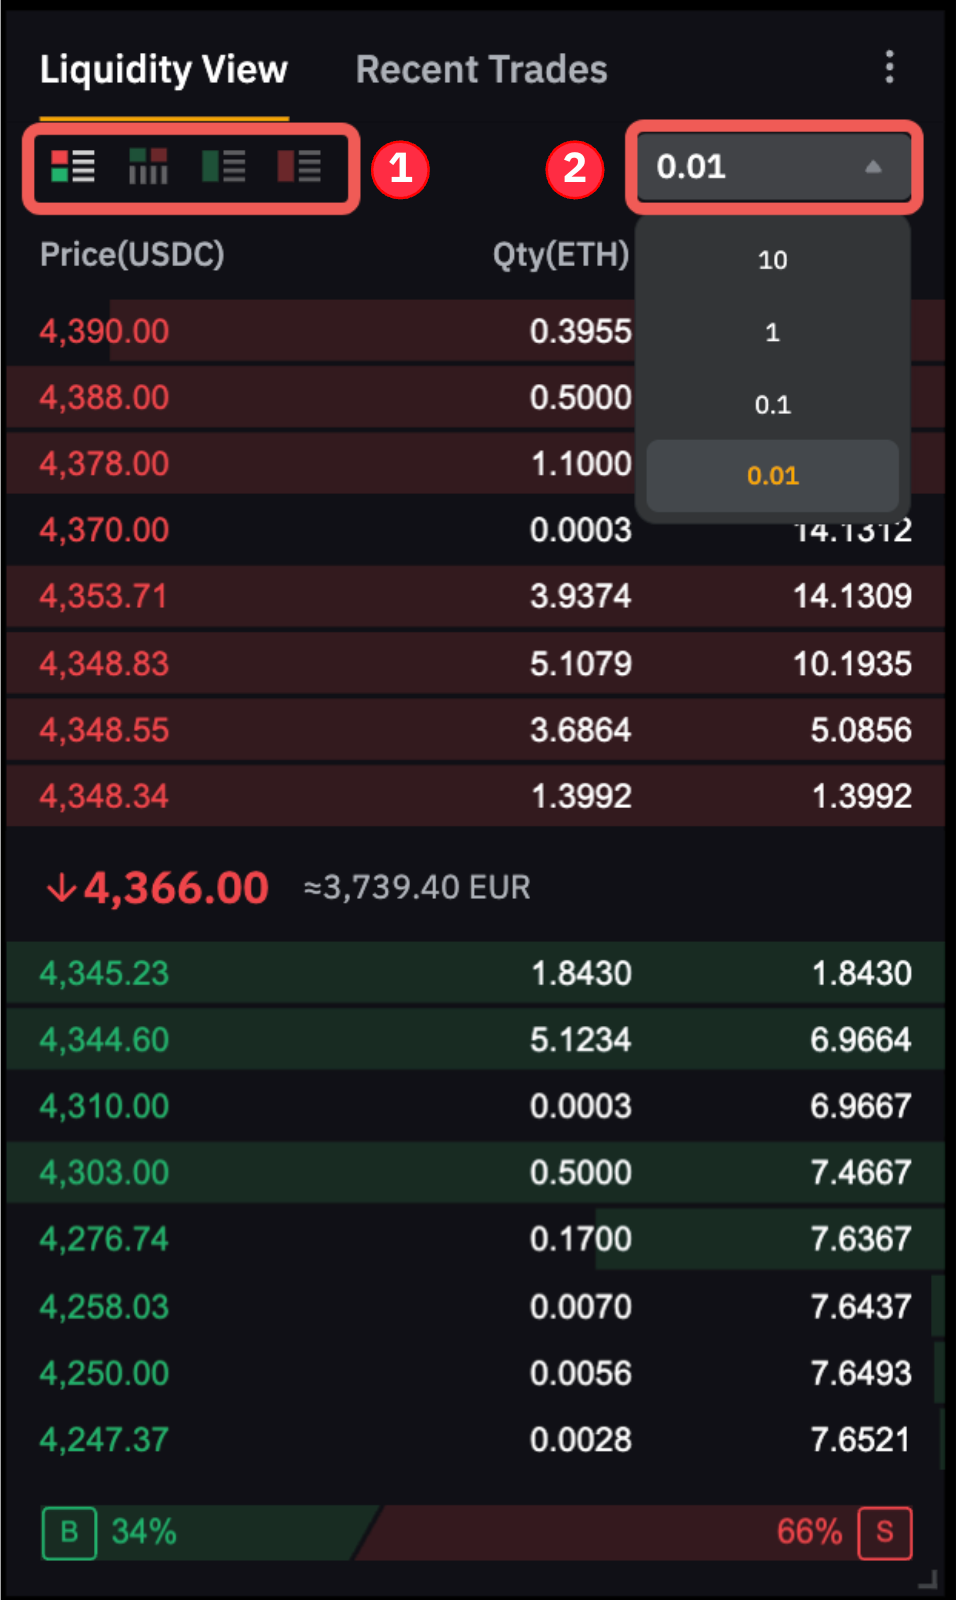
1. Buy and Sell Orders view
You have the choice between 4 displays of the liquidity view:
-
Sell and Buy orders displayed horizontally: This view will be displayed by default.
-
Sell and Buy orders displayed vertically: The bid and ask prices will be shown in columns. In this setting, the last trading price will be visible at the top of the liquidity view and the Total order quantity will be hidden.
-
Only Buy orders displayed: Only the bid prices will be shown. In this setting, the last trading price will be visible at the top of the liquidity view.
-
Only Sell orders displayed: Only the ask prices will be shown. In this setting, the last trading price will be visible at the bottom of the liquidity view.
Note: The selected view will remain as long as you visit a different trading pair under the same product. However, it will go back to the default display when moving to a different page or a different product.
2. Liquidity view decimal places
You can select the decimal places you want to see for the Prices in your liquidity view. Once you have selected the decimal place from the menu, the different price points and their respective quantity will be updated accordingly.
Note:
— The decimal place for quantity is set by the system and cannot be changed.
— Different decimal places options will be shown depending on the trading pair.