
This technical user guide is intended for Bybit EU users who want to understand the Spot Trading Chart on Bybit EU. It explains how to navigate the chart, view market information and access related Spot order functions.
Charting tools and technical indicators allow users to display and analyse market data. They do not predict future price movements or guarantee trading results. Please refer to the annotated screenshot below for an overview of the main elements of the Spot Trading Chart.
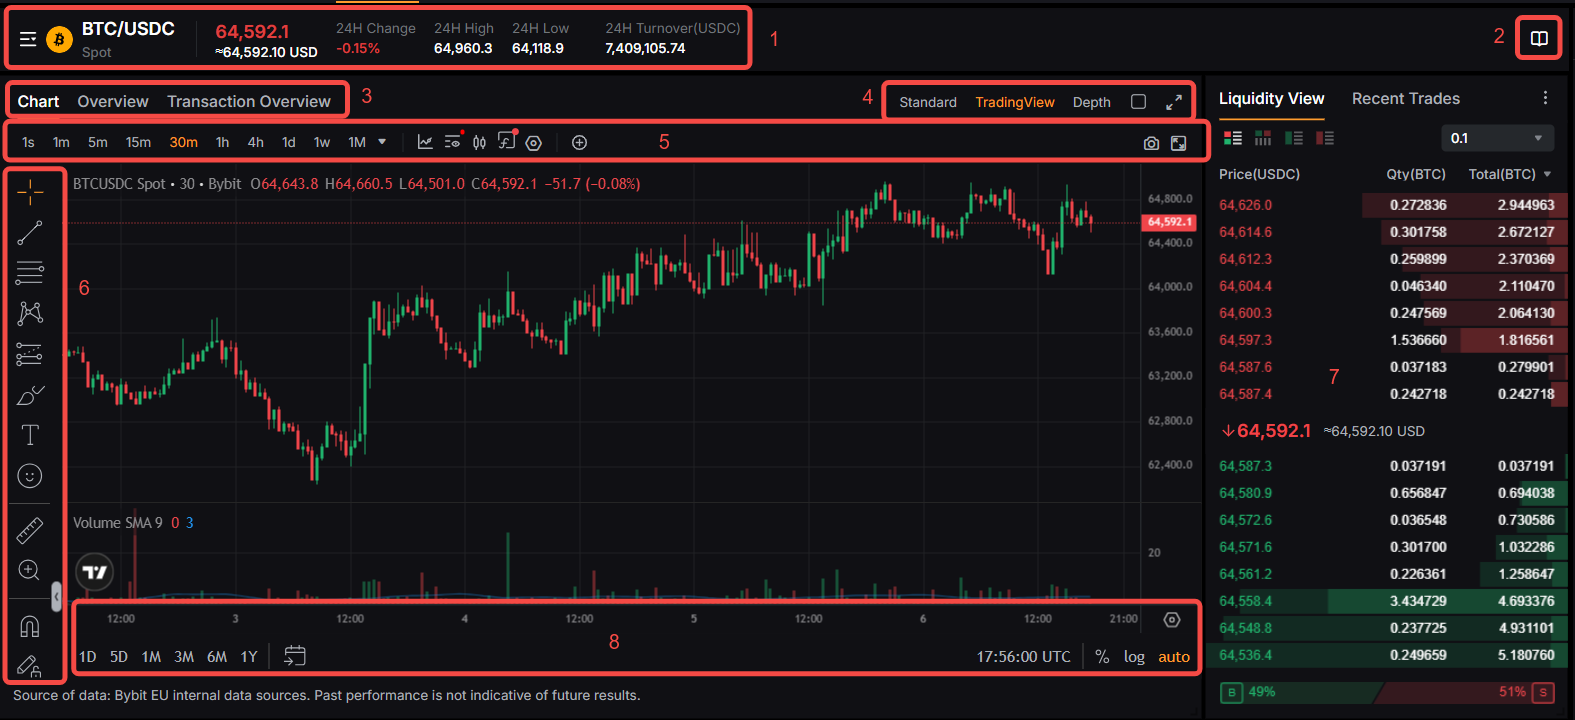
1. General Trading Pair Information
View key information for the selected supported Spot trading pair, including the last traded price and available data for the previous 24 hours.
2. Easy Access to Trading Guides
To better understand the relevant product features and trading information, such as applicable trading fees or margin information, click on the Trading Guides icon. Please note that where Spot Margin is available and enabled, it involves borrowing and may result in rapid losses and liquidation. Users should understand the applicable risks before using Spot Margin.
3. Detailed Trading Pair Data
Get information about the selected trading pair through the following tabs:
- Chart: This chart displays the trading chart.
- Overview: View general information about the selected crypto-asset. The Network sub-tab provides information about the deposit and withdrawal status of the relevant crypto-assets.
- Transaction Overview: View available account and performance information relating to your Spot trading activity.
4. Chart Display Parameters
Switch between the following chart views:
- Standard: This chart displays a fixed chart view with key chart information.
- TradingView: The TradingView chart can be customised using different display options, drawing tools and technical indicators. These features support your own analysis of market data but do not predict future performance.
- Depth: This view helps you visualise the current market depth for the selected trading pair.
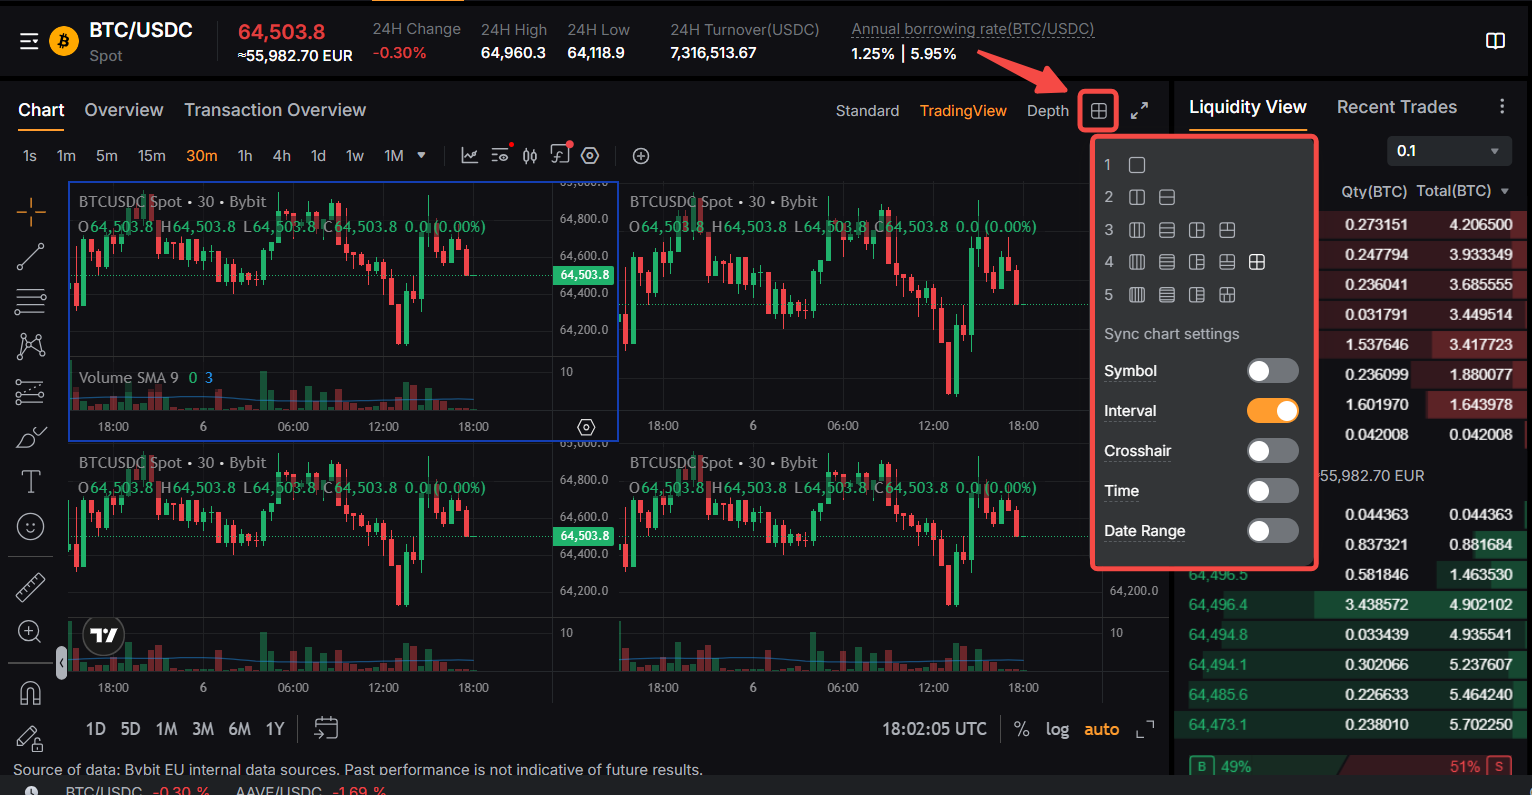
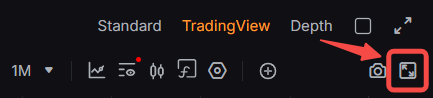
- Multi Chart icon: Available when using the TradingView chart, this feature allows you to display up to five supported Spot charts simultaneously for comparison.
Notes:
— When displaying multiple charts, the trading page, including the Liquidity View and order box, will change based on the chart currently selected. The selected chart can be identified by its highlighted border.
— Use the toggles in the Multiple Chart menu to synchronise the available chart settings.
- Expand Chart icon: Use the Expand Chart icon to increase the chart display. Please note that doing so will hide both the Liquidity View and the Position Panel. Click on the Expand Chart icon again to reduce the chart display back to its original size and show the Liquidity View and Position Panel again.
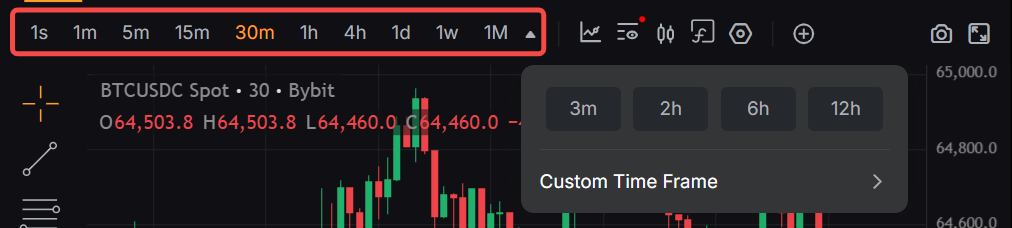
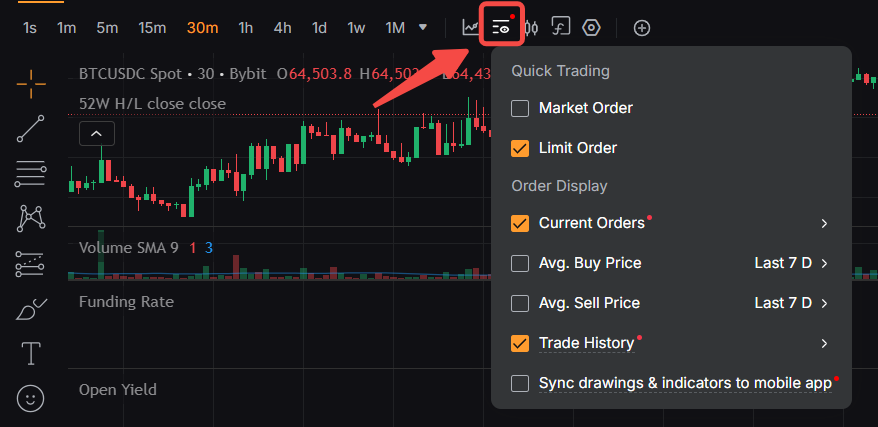
5. Chart Indicators
Add and manage an extensive list of technical indicators on the chart.

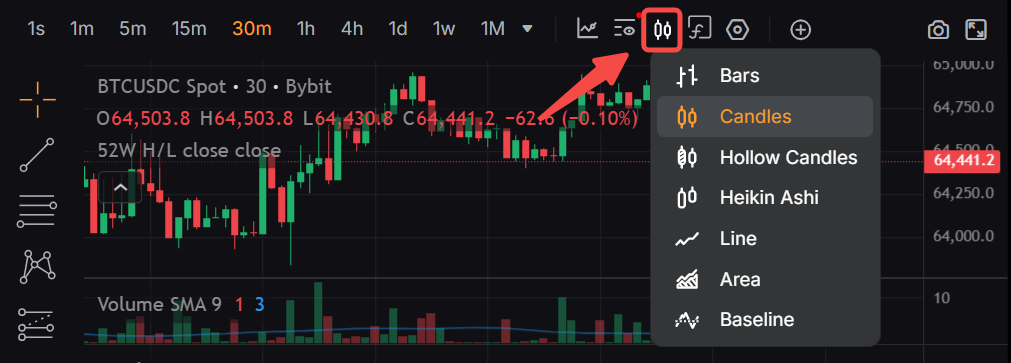
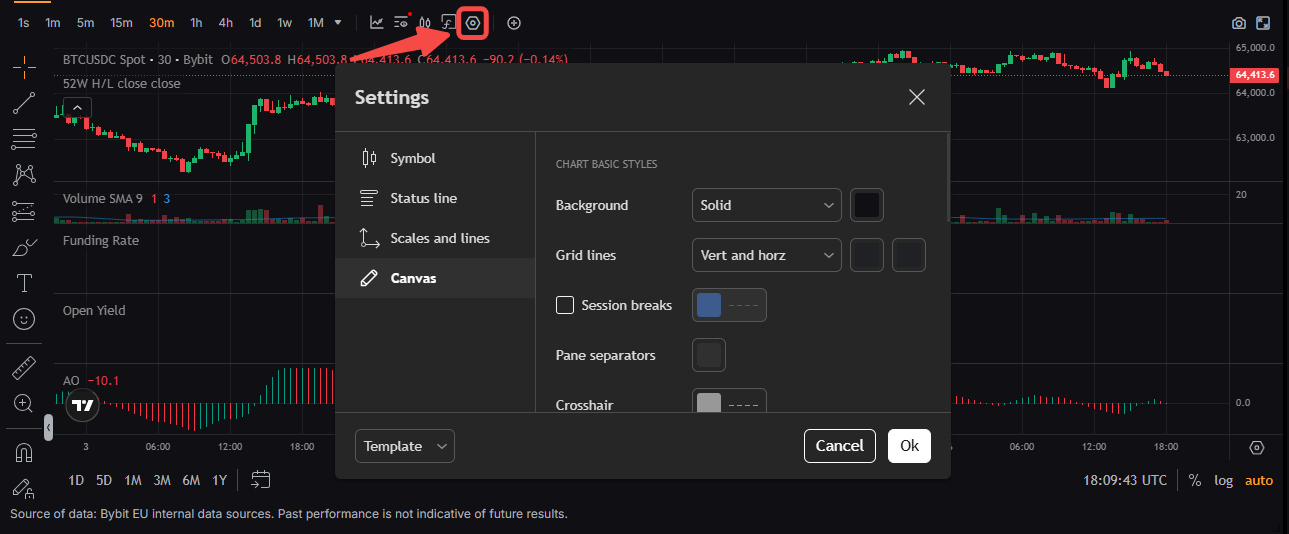
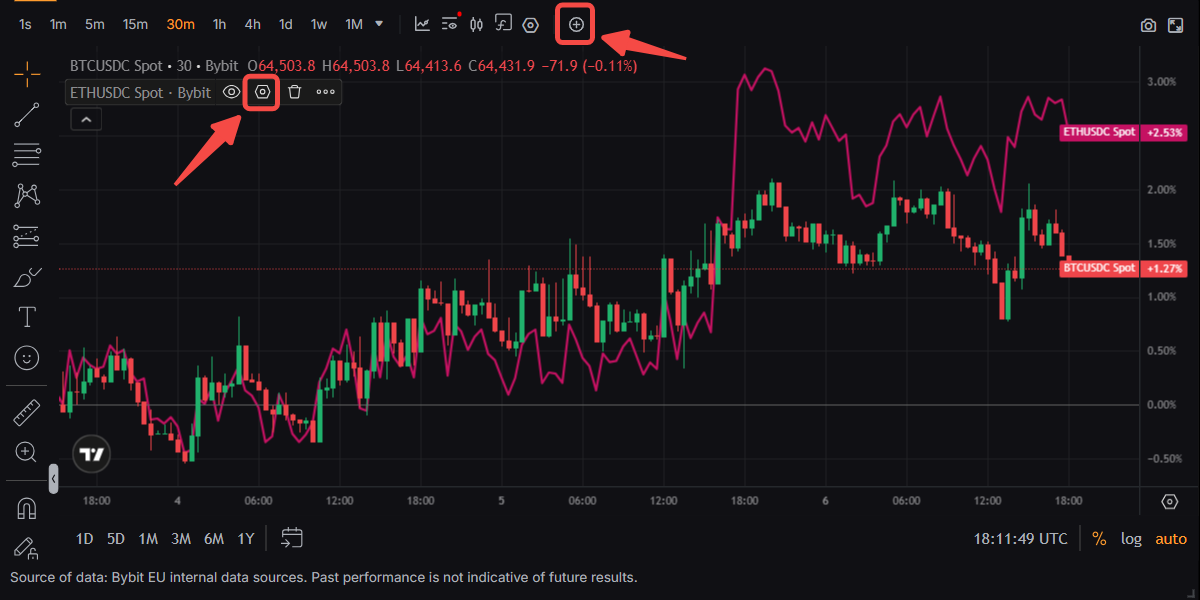
6. Chart Drawing Tools
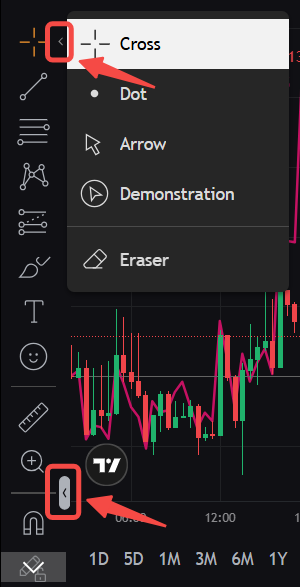
A range of drawing tools for visual analysis is available on the Trading Chart. Click the small arrow next to each icon to display the available options. You can lock a drawing in place, display or hide selected information using the eye icon, and delete indicators or drawings using the bin icon. You can also hide the drawing toolbar by clicking the grey box at the bottom-right side of the toolbar.
Notes:
— The drawings will be erased once you leave the page or log out of your account.
— For information about saving and synchronising drawings and indicators, please refer to the FAQ tab.
7. Liquidity View
Please refer to this article for more details on the Liquidity View and how to understand its trading information.
8. Chart Settings
You can configure how the chart is set, including its date and time range, price chart type, labels, and lines via these features:
- Use the time period or click on the calendar icon to easily apply the chart period you want to see in your chart.
- Modify the timezone to better fit your needs. By default, the Trading Chart will be set in UTC. Please note that the selected timezone will apply to all trading charts across the different products.
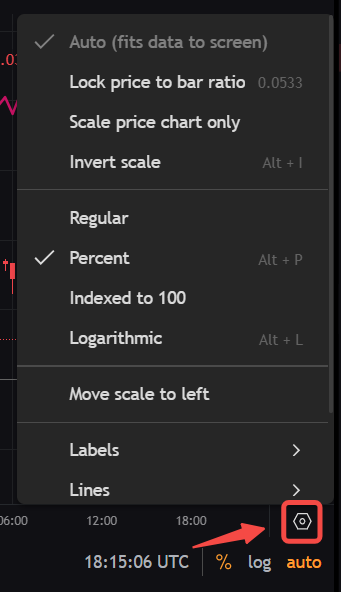
- Click on the %, log or auto icons to update your Chart scale to a percentage scale, logarithmic scale or automatic scale.
- Access other scale settings and more display options (price chart, labels, lines) via the Settings icon.
Disclaimers
- Screenshots are provided for illustration only. The appearance and availability of particular features may change following product updates. Prices and market information shown in screenshots are historical.
- Crypto-assets are highly volatile and you may lose some or all of the amount invested. Inform yourself thoroughly about the risks before making an investment decision. This content constitutes a marketing communication within the meaning of the Markets in Crypto-Assets Regulation and is provided by Bybit EU GmbH. It does not constitute investment advice.