smriku
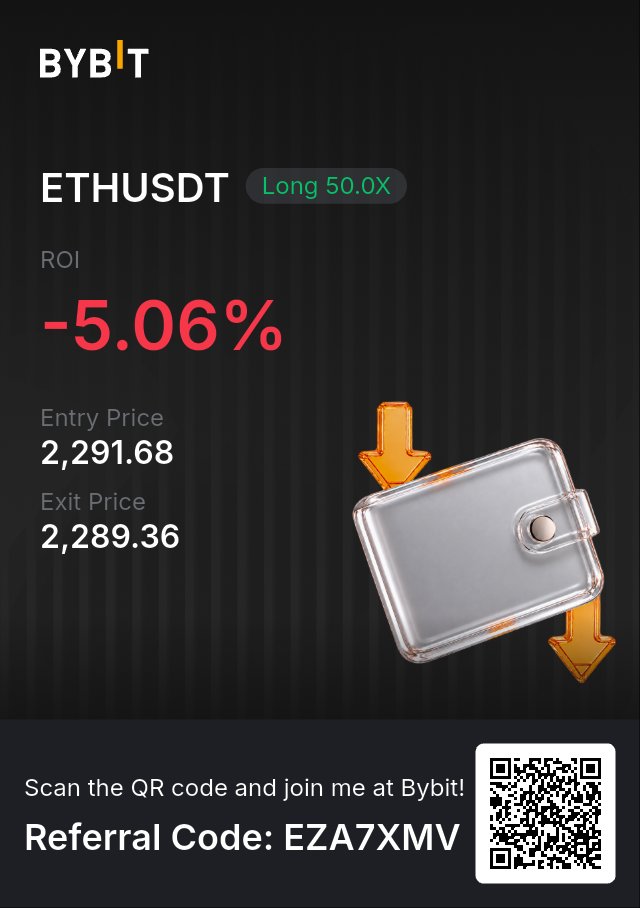
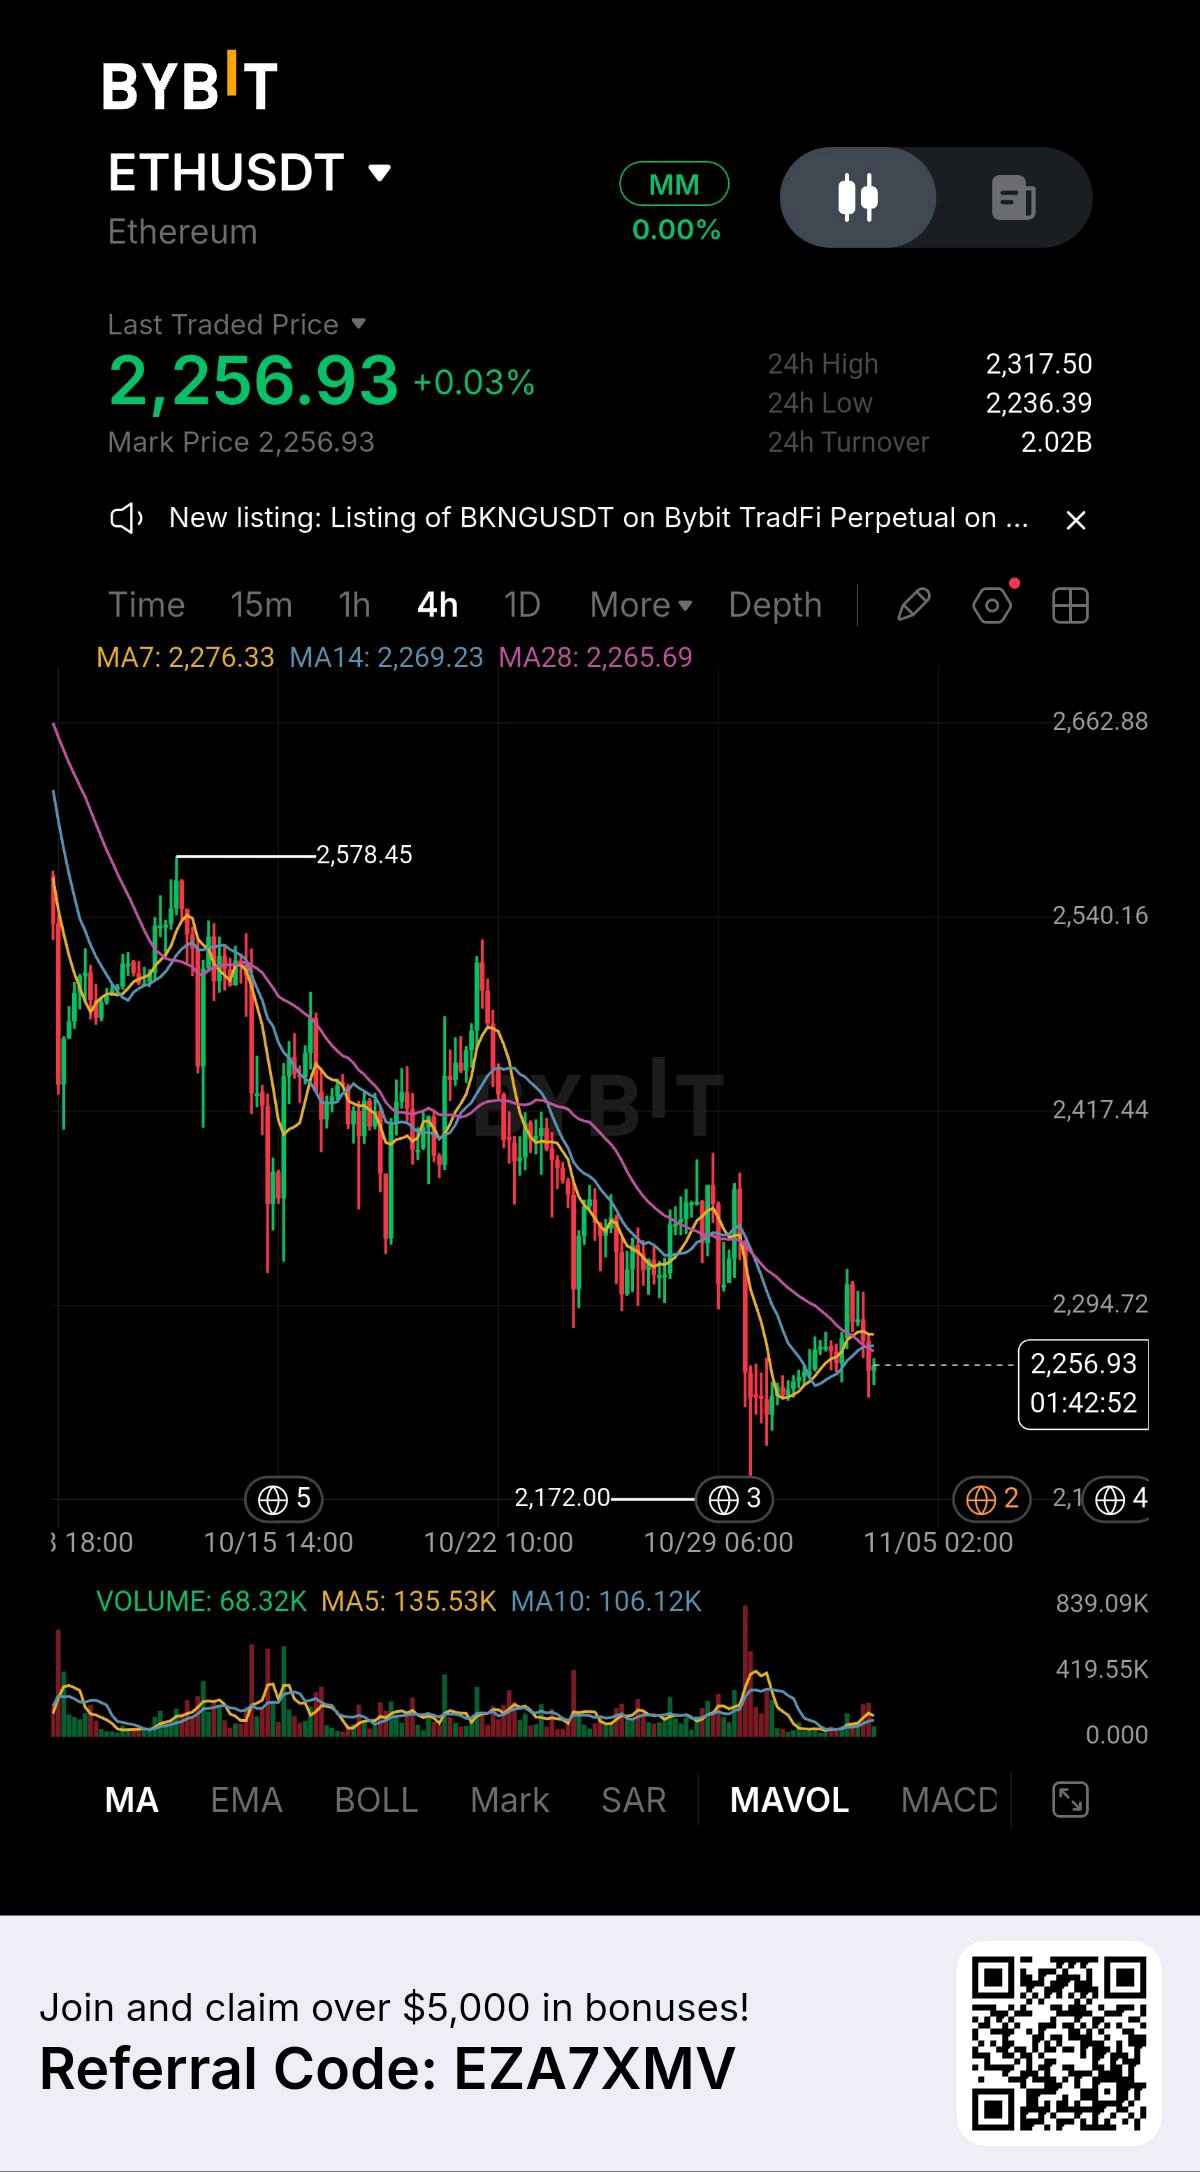
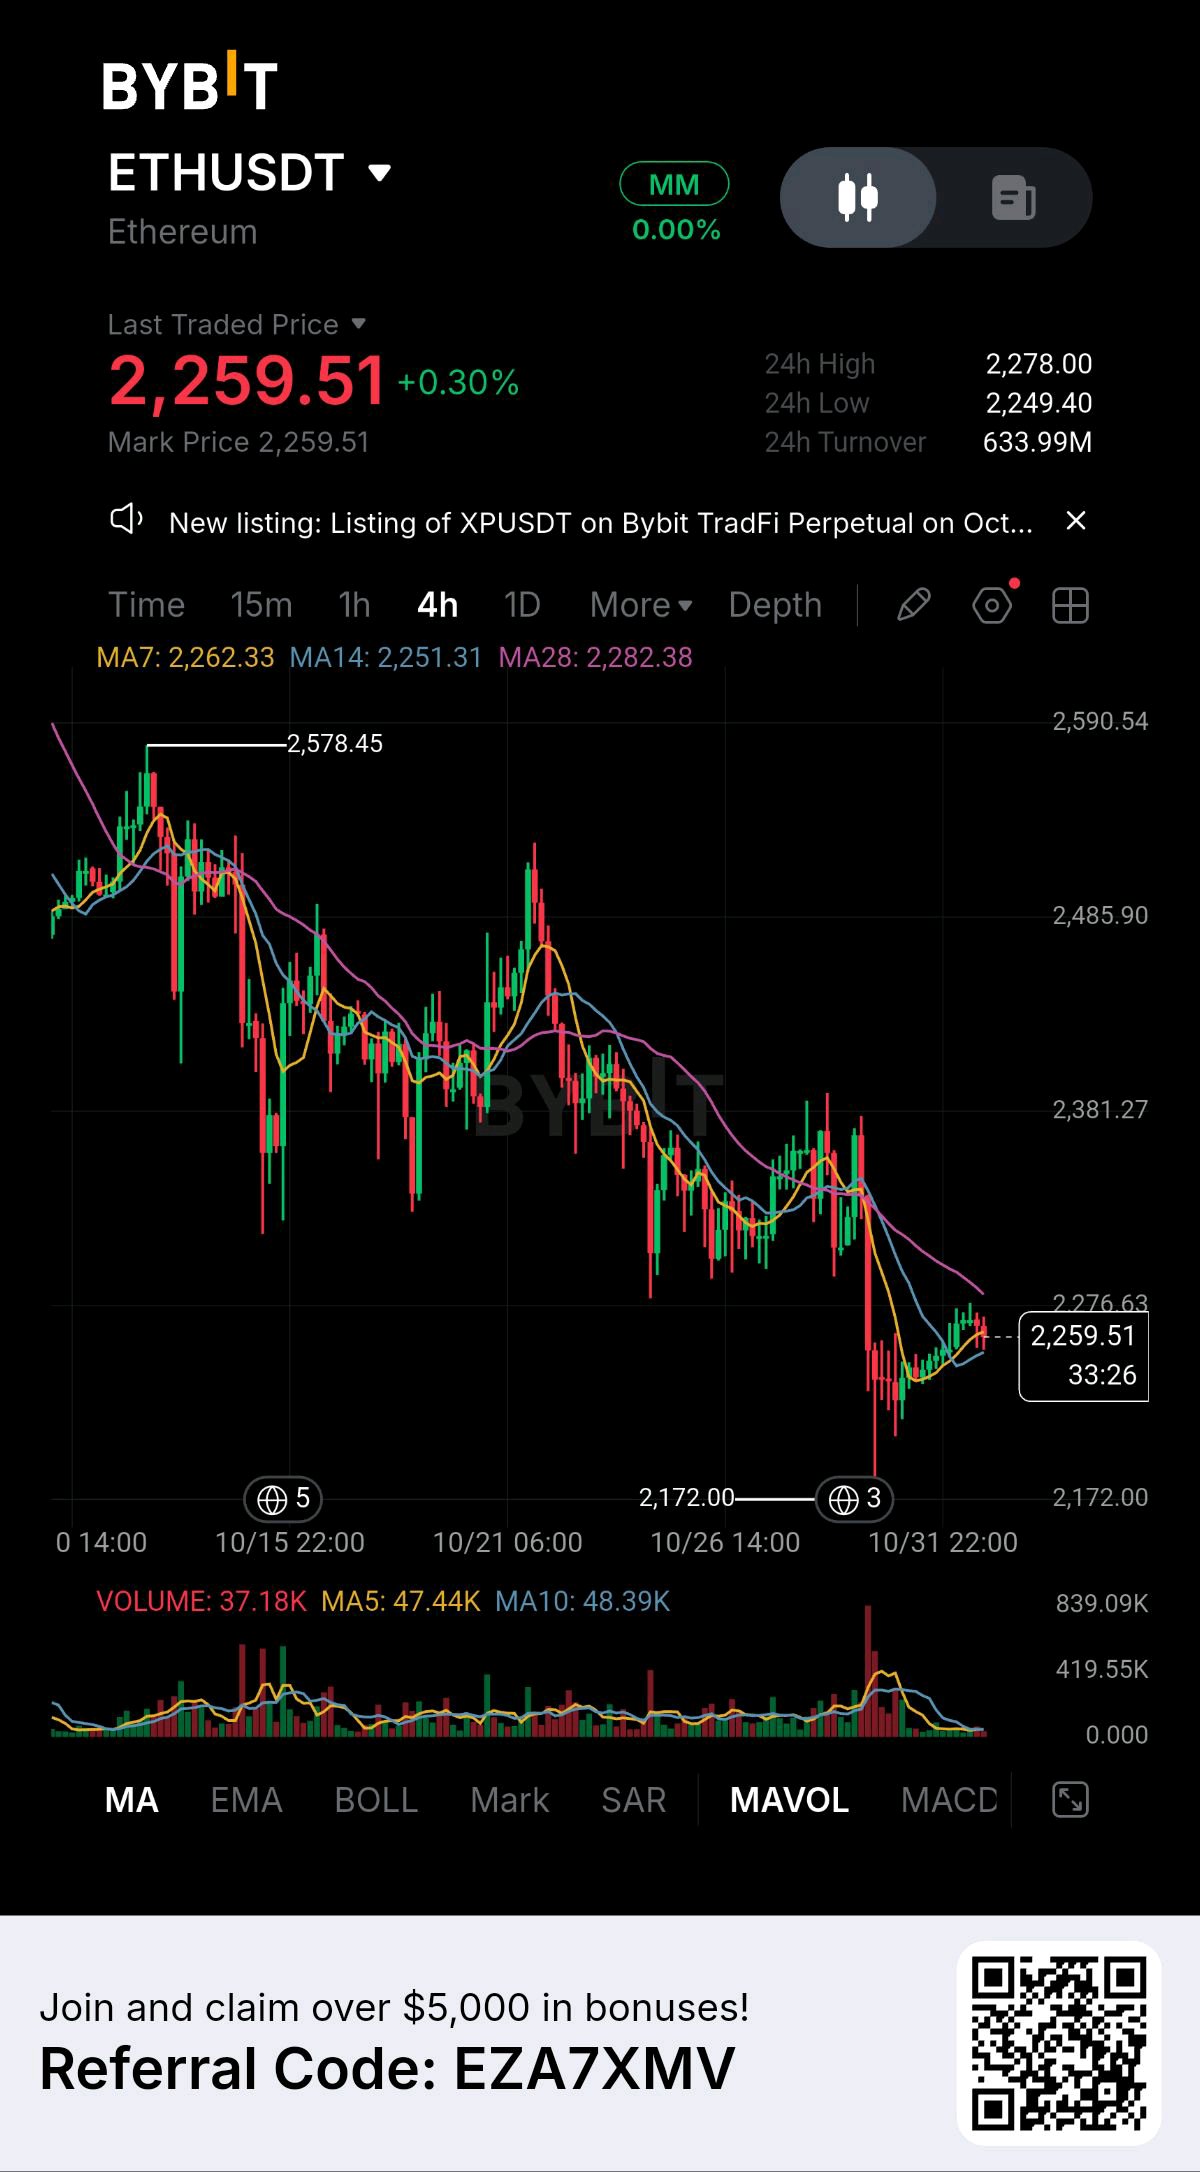
ETH: the Binance hacker still holds 195K ETH that can’t be frozen, and ETH just lost its 200-day average. I bought the dip at 50x. Stop hit. 🛑 A 0.1% stop at 50x only works if nothing happens, and the overhang is exactly the thing that happens. 📊 My trade LONG ETH/USDT, 50x 📍 Entry: $2,291.68 (limit) 🛑 Stop loss: $2,289.38 (filled at $2,289.36) 📦 Size: 0.01 ETH (about $22.9 notional, about $0.46 margin) 📉 Result: price −0.10%, ROI −5.06% 🔍 Why I took it ETH had two stories pulling opposite ways. On the positive side, tokenized stocks on Ethereum reached about $827M, and Binance reported replacing about 90% of the stolen assets, so the fear around the exchange was fading. On the negative side, the hacker reportedly still held about 195K ETH (around $440M) that no issuer can freeze. ETH had lost about 16% in October, US spot ETH ETFs had lost over $1B earlier in the month, and ETH had just slipped under its 200-day average ($2,315) for the first time since August. I bought at $2,291.68, about 1% under that average, betting the overhang was already in the price and the average would be reclaimed. The test: if ETH holds $2,290 and pushes through $2,315, the overhang is being absorbed. If not, $2,222 is next. 📐 Key levels 🔹 Entry: $2,291.68 🔹 Stop: $2,289.38 🔹 200-day average: about $2,315, the reclaim level 🔹 Resistance above: $2,415, then $2,500 🔹 Support below: $2,222, then $2,170 📌 What would have proven me wrong A daily close under $2,222. My stop sat about $67 above it. ⚠️ Risk Unfrozen ETH can be sold at any time, though attackers usually sell in tranches. ETH ETF outflows had been repeating through October. At 50x, liquidation sat only about 1.5% away, roughly $34. ETH fell 2.6% in an hour when the hack broke. Binance reopening withdrawals could move the market either way. ❌ Where I was wrong The trade: my stop was 0.10% from entry, and my liquidation was about 1.5% away. That’s no room for the idea to work, and no room for a single headline. The idea: I bought under a freshly lost 200-day average, which is overhead resistance, and bet against a known overhang. What I learned from this trade Event risk and leverage don’t mix. If one transaction can move price farther than my liquidation distance, the leverage is too high. Under a lost 200-day average, I wait. I either wait for the reclaim, or buy the support with a stop under it. Buying in between pays for neither. The honest stop was $2,222. At 50x that’s about 150% of my margin, which means the trade didn’t exist at this size. My Takeaway −5.06% is the 0.10% move times 50x, about 0.023 USDT. The loss is small. The number that matters is 1.5% against 2.6%: my liquidation distance against what ETH actually did in one hour. Rule going forward: while the hacker’s ETH is unspent, my ETH leverage is capped at 10x. #ByXIMPACT #WSOT2026 #BlockchainSecurity #NewFinancialPlatform #MidtermsMarketWatch $BTCUSDT $ETHUSDT
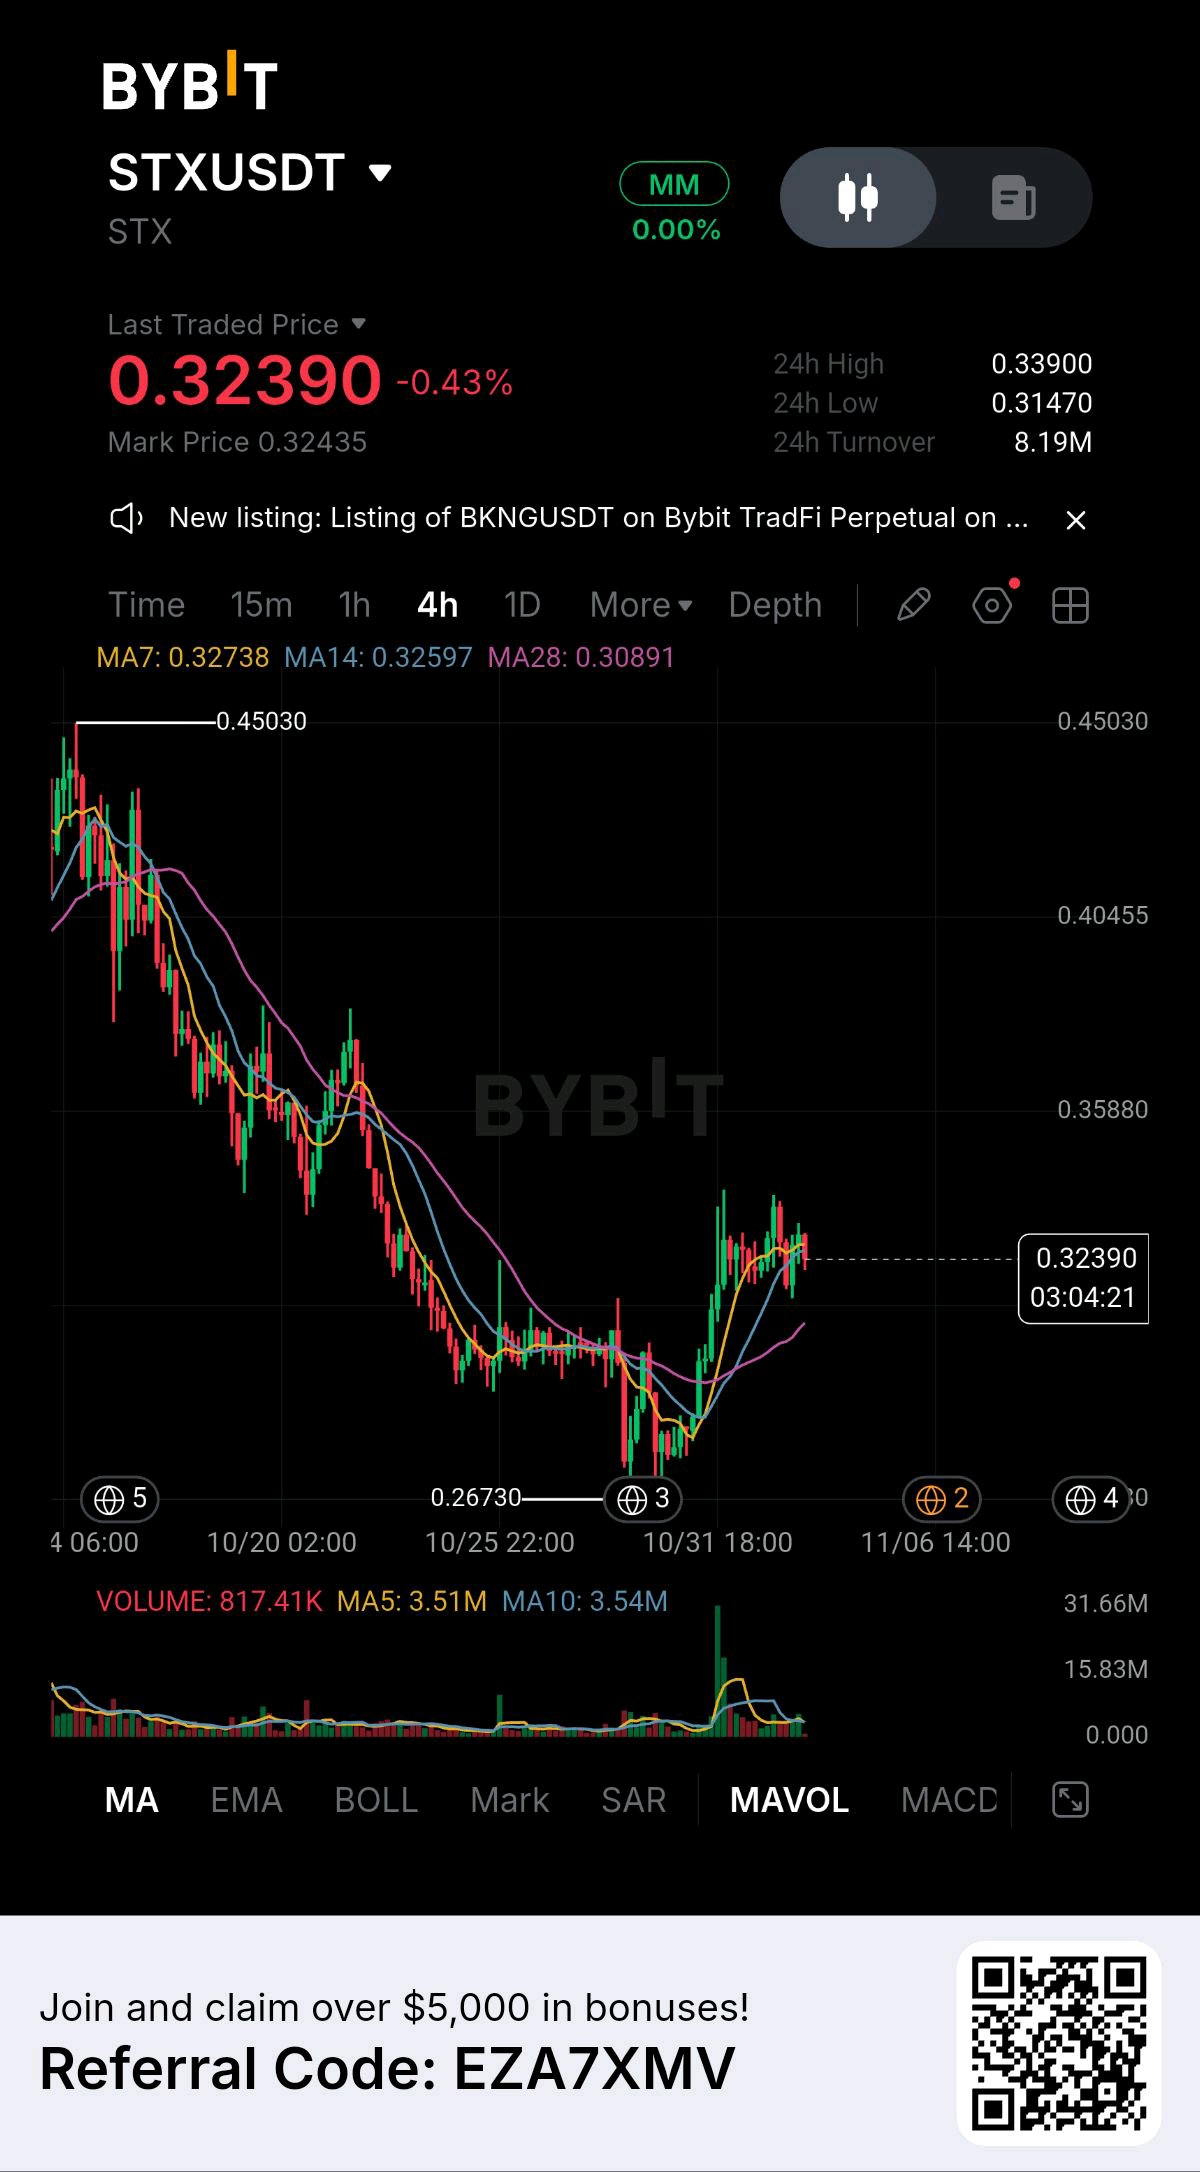
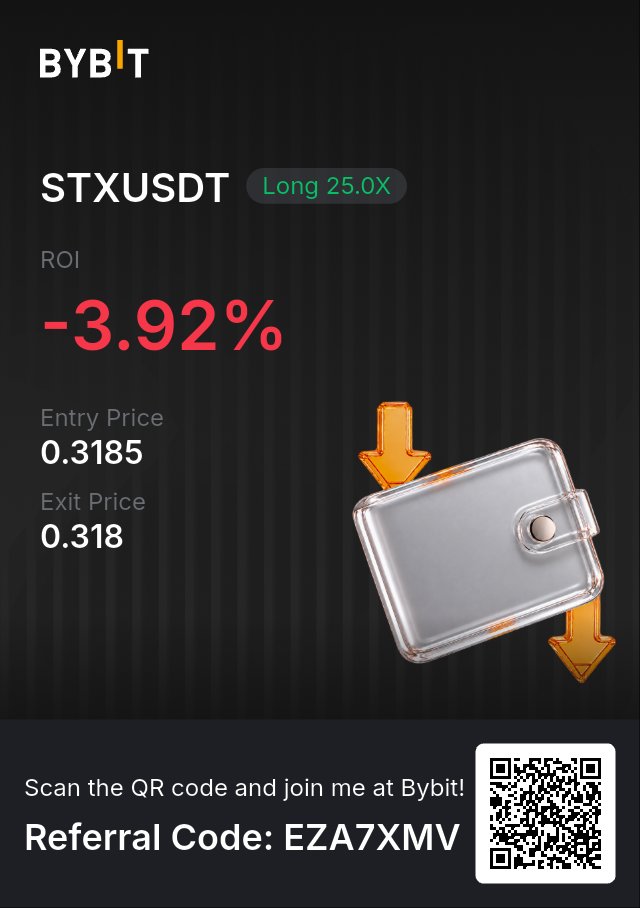
STX jumped 10% on news I couldn’t confirm. I bought day two with a stop that had no level behind it. 🛑 📊 My trade LONG STX/USDT, 25x 📍 Entry: $0.3185 (limit) 🛑 Stop loss: trigger $0.3181, filled at $0.3180 📦 Size: 50.9 STX (about $16.20) 📉 Result: price moved −0.16%, which cost −3.92% ROI 🔍 Why I took it STX rose about 10% on Nov 1, to roughly $0.32, on volume about 136% above its 30-day average. But it was still below its 20 to 50-day averages, RSI sat near 47 and the MACD was bearish. A move with a lot of volume and no technical confirmation. The story people attach to it is Bitcoin staking. Stacks’ third bonding period is due in November, and STX holders have to lock STX worth about 5% of the Bitcoin they stake. The second bond filled 500 BTC with 6.7M STX locked. But active addresses fell below 1,000 even as price rose in October, and the reports I found couldn’t pin down what moved the price on Nov 1. One mentioned rising interest in South Korea. So the question: does a pop with no confirmed cause hold the next day, or fade once the headline cools? 📐 Key levels 🔹 $0.3223: where STX traded after the Nov 1 move 🔹 $0.41 to $0.42: the mid-October highs above 🔹 I found no sourced support level for STX. My stop at $0.3181 was a number, not a line on the chart. ⚠️ Risks Moves with no confirmed cause often reverse. I couldn’t confirm the exact bonding date, only that it’s due in November. Bitcoin was still fragile after the Binance hack, with ETF outflows of $643M on Oct 30, and the US midterms were a day away. What I learned ✅ What I did right: a clear question, a stop on the order, and a small size. ❌ What I’d fix: 1️⃣ A stop needs a level. I had none, so the stop measured noise. If I can’t name the level where the idea is wrong, I can’t set a real stop. 2️⃣ My stop sat 0.13% from entry in a coin that had just moved about 10% in a day. 3️⃣ A stop is a market order, so it fills at the price, not the trigger. Mine triggered at $0.3181 and filled at $0.3180. That turned a planned loss of about 0.020 USDT into about 0.025, a quarter more. 4️⃣ Fees were roughly a third of the −0.04 total. 5️⃣ The card says −3.92%, but that’s −0.16% multiplied by 25. The real risk was cents. A green day with no reason is a question, not a signal. Stacks’ bonding period is the date that matters, so I’ll ask the question again then, with a stop that has room to hear the answer. #ByXIMPACT #WSOT2026 #BlockchainSecurity #NewFinancialPlatform #MidtermsMarketWatch $BTCUSDT $STXUSDT
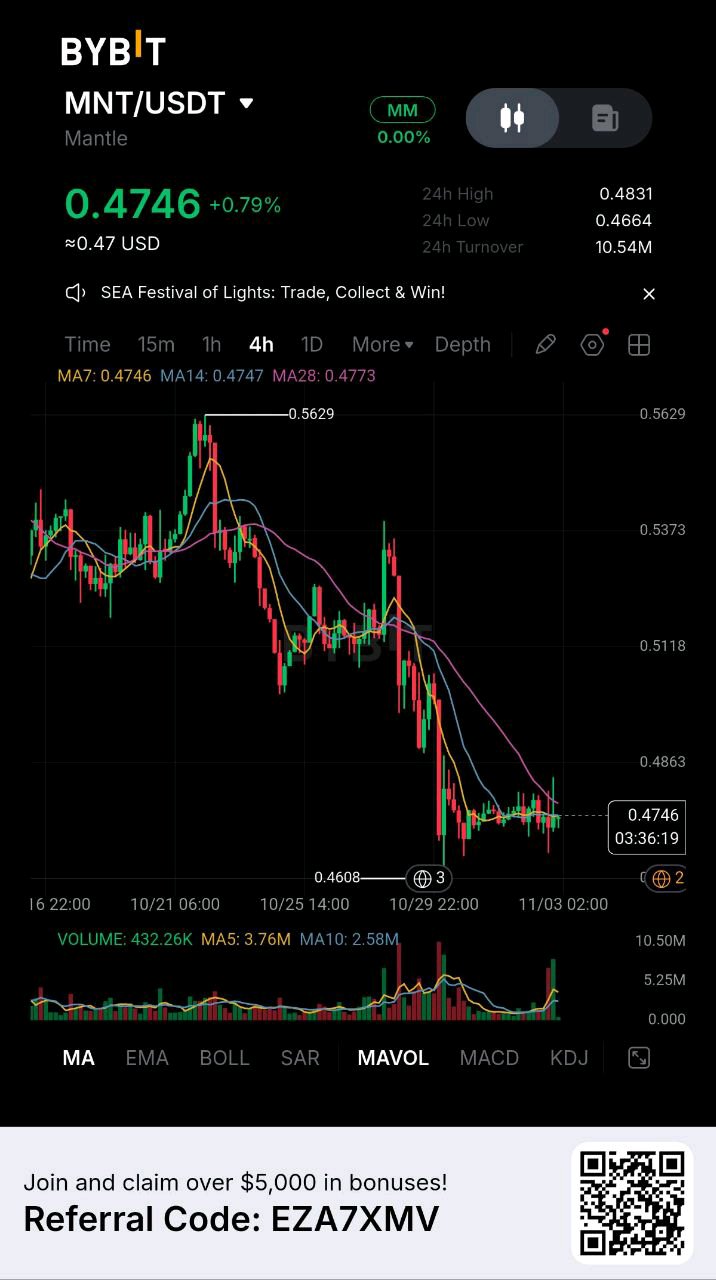
$MNTUSDT is quietly building a base after a sharp drop, and the volume is picking up before the price is. Price is 0.4746, up 0.79% today, about 3% above the 0.4608 low and about 16% below the 0.5629 high. It’s been moving sideways for days inside a tight box. The story is a tug of war between product and capital. Mantle’s tokenized-asset offering has grown, with OpenStock’s pre-IPO vaults arriving July 2 and Paxos’s USDG going live natively on September 3. But deposits fell about 86% from April’s peak to $99 million in October. More products, less money. Turnover The 24-hour turnover is 10.54M. In the chart yesterday it was 2.92M, so it has more than tripled while price barely moved. Money is trading here, but neither side has won yet. Volume The recent bars are the biggest since the sell-off. The MA5 (3.76M) is above the MA10 (2.58M), so volume is rising while price stays in a tight box. The current 4h candle has just opened, so its own reading is incomplete. Rising volume without a breakout usually means a battle is underway, and the break will tell us who won. Moving Averages MA7: 0.4746 | MA14: 0.4747 | MA28: 0.4773 Price is sitting exactly on MA7 and MA14, and about 0.6% under MA28. All three are almost flat and bunched within 0.003 of each other. After a steep drop, that kind of squeeze often comes before a larger move, but the direction isn’t set. Levels to watch · 0.5629 — The high before the drop. · 0.50 — The round number price lost on the way down. · 0.4863 — The recent wick high. · 0.4831 — The 24h high. · 0.4773 — MA28, the first hurdle to reclaim. · 0.4746 — Where we are right now. · 0.4664 — The 24h low. · 0.4608 — The low of the drop. Consideration The fundamentals are mixed, and they pull in both directions. On the cautious side, a governance proposal published October 28 (MIP-35) would cap the July 2026 to June 2027 budget at 150 million MNT and 40 million USDx, below the previous cycle’s limits. That can be read as discipline or as a sign of tighter resources. The adoption side keeps growing, but until deposits turn around, the market has little reason to pay up for it. Trade plan · The Bullish Path: We need a strong 4h close above 0.4831, which also clears MA28 (0.4773), with volume still above the MA10. If that holds, the next area to watch is 0.4863 and then the 0.50 round number. · The Bearish Path: If we lose 0.4664, it likely retests 0.4608, and there’s no chart support below that. · My take: I’m staying patient. The squeeze is tight and volume is building, but there’s no breakout yet. I don’t want to guess which side wins, so I’ll wait for a confirmed 4h close outside the box. Support and resistance Support: 0.4664 (24h low) → 0.4608 (drop low) Resistance: 0.4773 (MA28) → 0.4831 (24h high) → 0.50 (round number) Invalidation and risk note This setup is invalidated if we close a 4h candle below 0.4664. The biggest risk is a fake-out in a tight range: price can poke above resistance, trap late buyers, and fall straight back in. Don’t guess the direction, wait for the break. #ByXIMPACT #WSOT2026 #BlockchainSecurity #NewFinancialPlatform #MidtermsMarketWatch $MNTUSDT $BTCUSDT
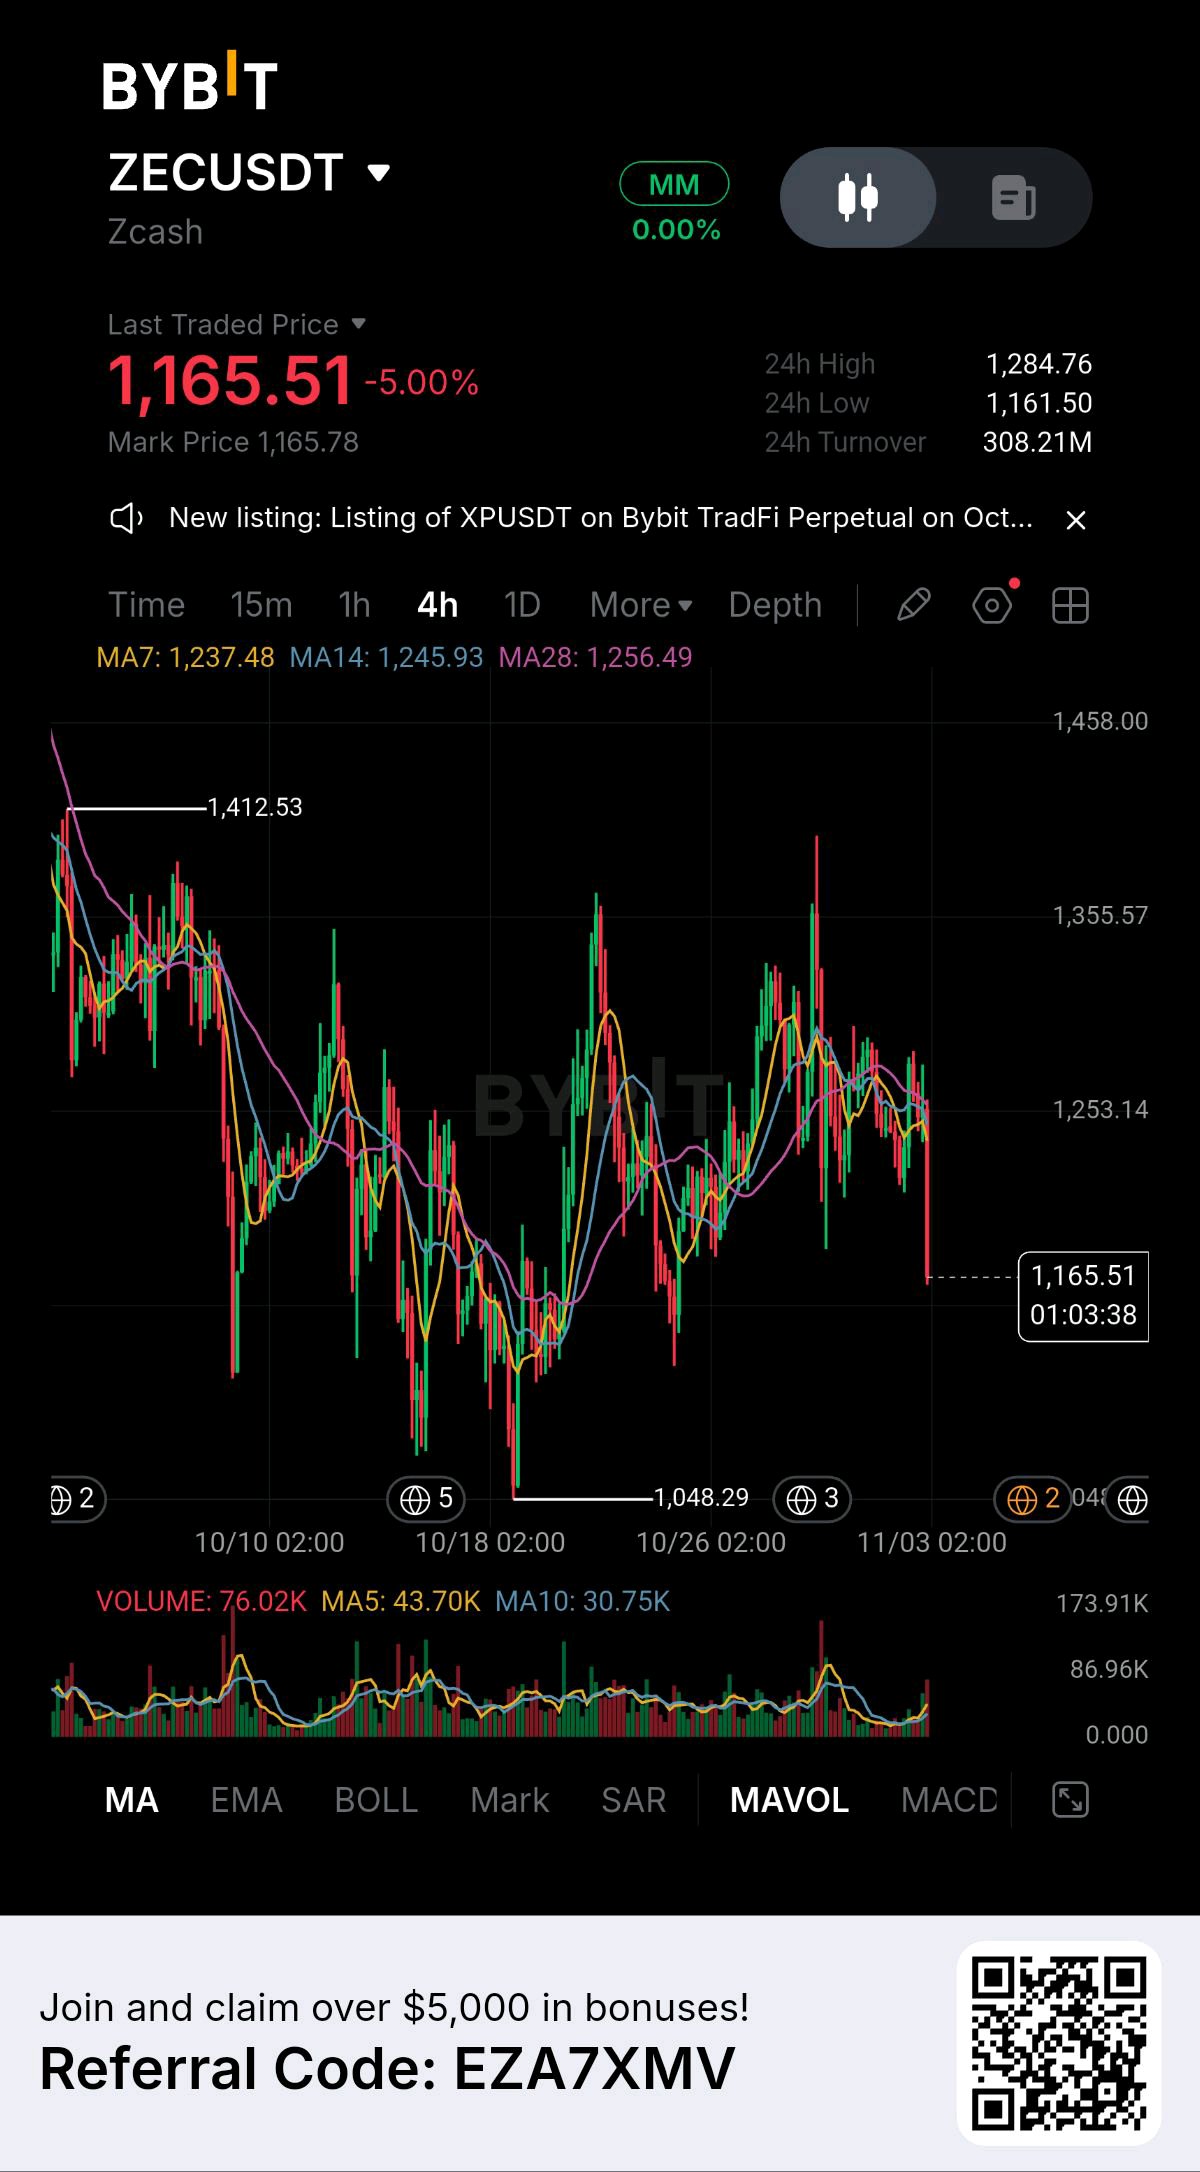
ZEC: NU7 goes live Nov 5. The last upgrade stage dropped the price 18%, and the supply story behind the rally has stopped growing. 👀 I’ve been watching Zcash for a few days. It’s near $1,260, about 26% below its $1,699 all-time high and down roughly 25% on the month. When NU7 hit testnet in early October, ZEC fell from $1,352 to $1,110 in four days. Meanwhile the on-chain story behind the run, coins moving into the shielded pool, has gone flat. That gap is what I’m trading. 📊 Why ZEC is on my screen 🔹 The upgrade. NU7 activates at block 3,543,405, around Nov 5, and cuts block times from 75 to 25 seconds. That’s three times faster confirmations. But the testnet launch did not lift the price. 🔹 The flywheel stalled. Shielded supply crossed 31% in April. By September it was back near 29% (about 4.9M ZEC). Shielded transactions also fell from about 59% of activity in April to 44% in the latest snapshot I found. The “privacy supply sink” argument needs that number rising, not sliding. 🔹 Holders are deep in profit. The realized price, the average cost basis on-chain, was about $366 in the latest data. At $1,260 most holders are up more than 3x, which is a lot of potential sellers on any “sell the news.” 🔹 The bid is real. About $41M of weekly ETF inflows were reported, and a proposed spot Zcash fund is still under review. ZEC also needs about $1,283 to reclaim the top-10 spot it just lost to Hyperliquid. 🎯 Levels I’m watching $1,283 to $1,300: nearest resistance, the top-10 line and the last sell wall $1,370: the key breakout level, rejected several times $1,200 to $1,214: first support, the round number and the 20-day average $1,126: important support, the Oct 17 low $1,050: the next zone of interest for sellers if that breaks How I’d play it: LONG only after a daily close above $1,370 and a clean retest, because that opens $1,500 and a run at the high. SHORT only if $1,126 breaks and price fails to climb back over it. In the middle, I stay out. I won’t trade the upgrade day itself, because upgrades bring volatility, not direction. One nuance: a faster chain is a technical headline, and demand is what pays the token. If the shielded share starts rising again, the supply-sink story is back on. If it keeps slipping while the price holds up, the rally is leaning on ETF flows alone. Zcash gets a faster chain on Nov 5, while its shielded supply has stalled and most holders sit on 3x gains. Is NU7 the catalyst for new highs, or the exit signal? #ByXIMPACT #WSOT2026 #BlockchainSecurity #NewFinancialPlatform #MidtermsMarketWatch $BTCUSDT $HYPEUSDT
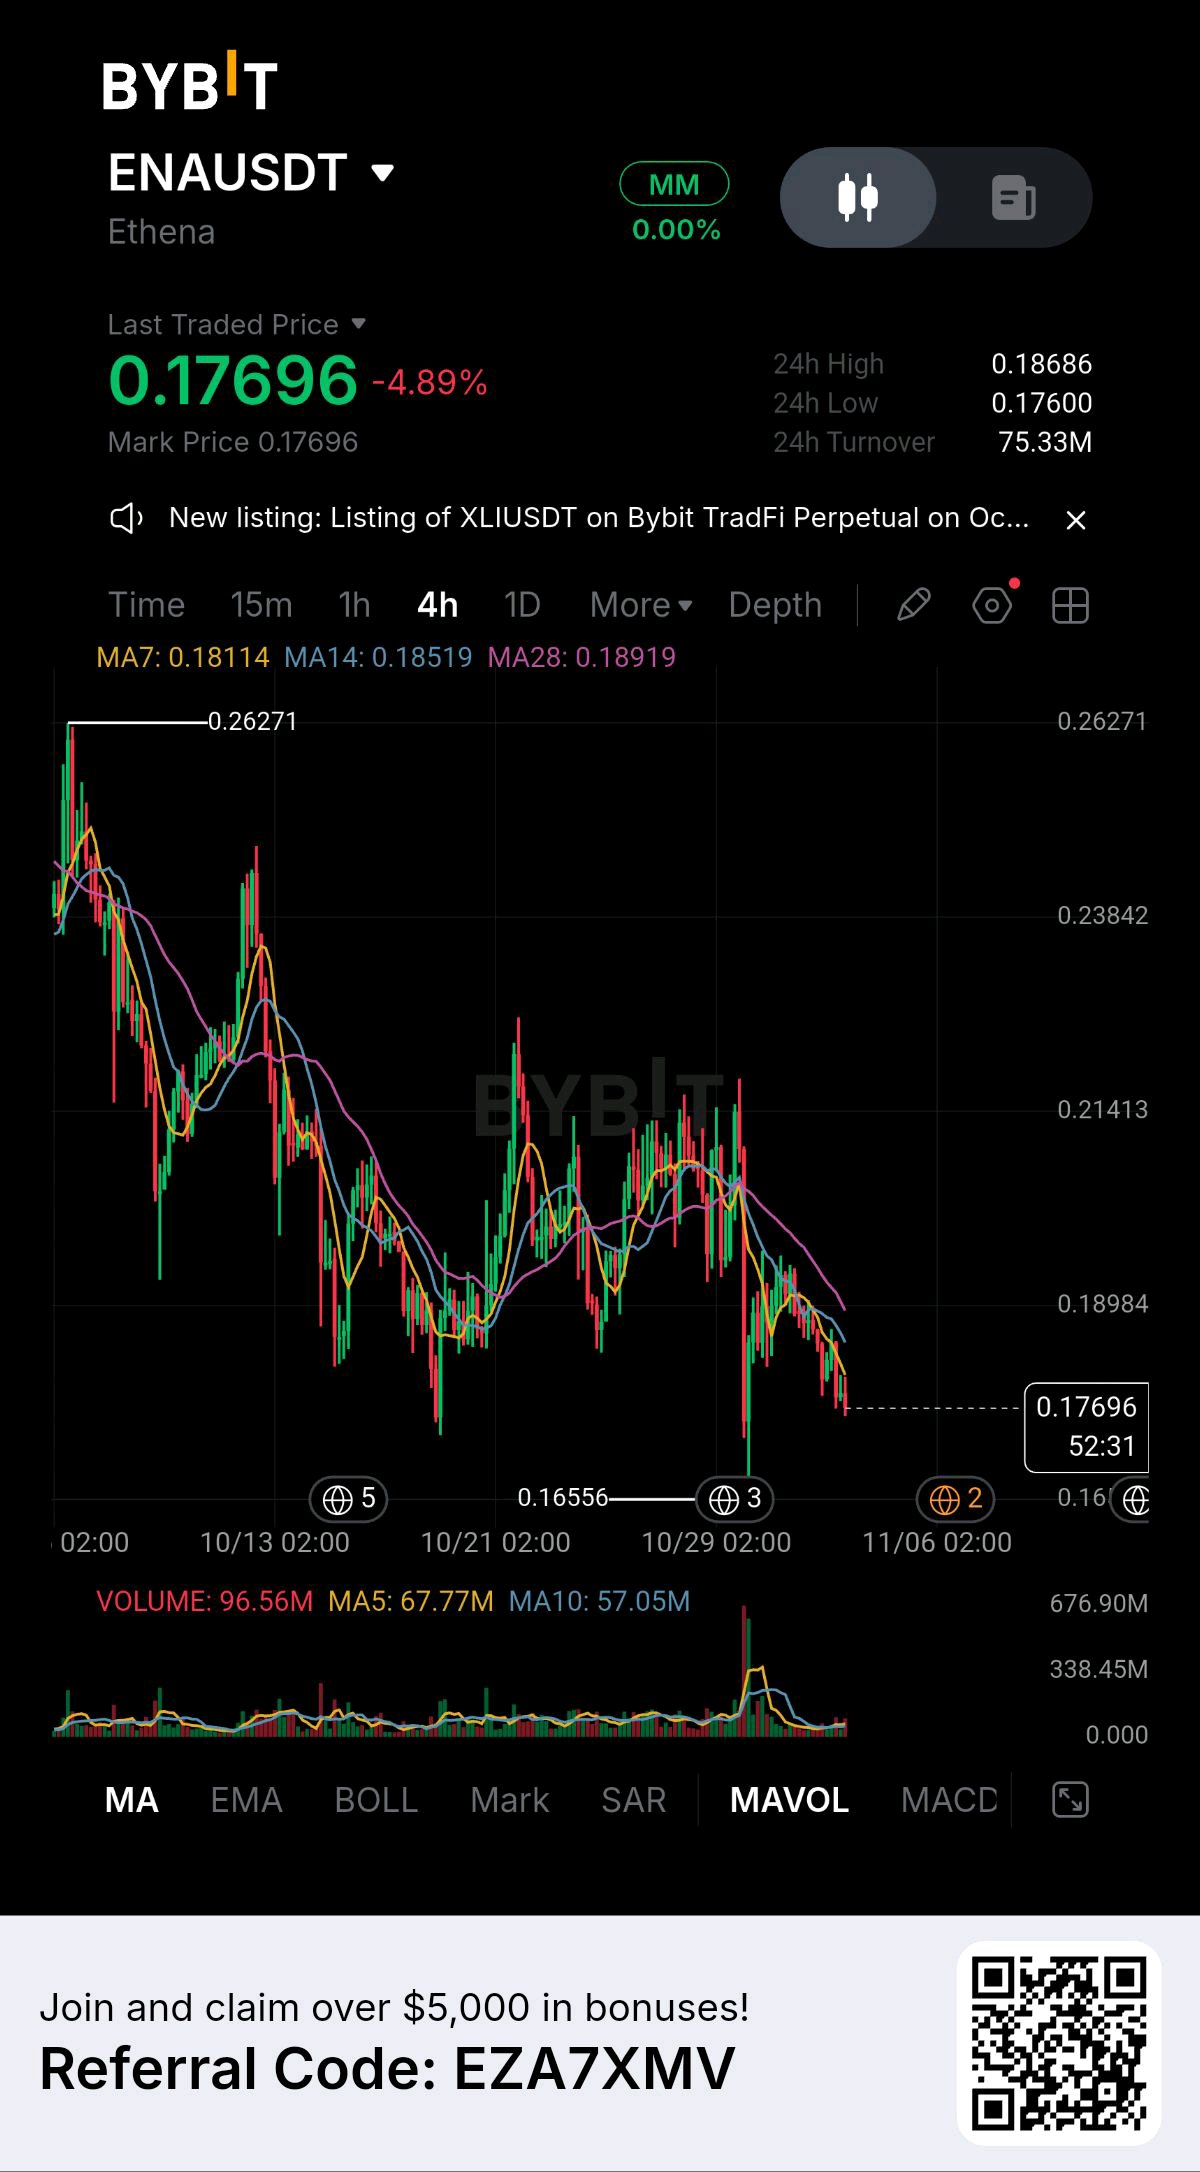
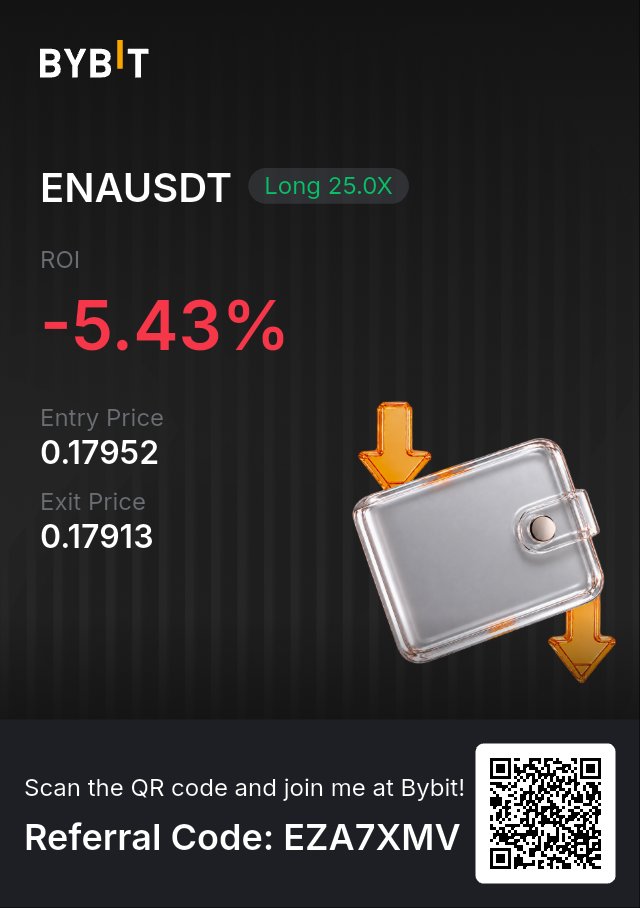
ENA: the unlock is done, the news keeps coming, and my stop was thinner than the spread. 🛑 📊 My trade LONG ENA/USDT, 25x 📍 Entry: $0.17952 (limit) 🛑 Stop loss: $0.17916 (hit, filled at $0.17913) 📦 Size: 41 ENA (about $7.40) 📉 Result: price moved −0.22%, which cost −5.43% ROI 🔍 Why I took it The overhang cleared first. 275M ENA unlocked on Nov 1, about 1.8% of total supply, and the investor unlocks were already consolidated on Oct 5, so the monthly calendar is gone. Meanwhile the product news kept arriving: Ibis launched with a $250M credit facility from FalconX, Ethena Pay added a savings feature paying up to 12%, and ether.fi is building its dollar on Ethena’s platform. But the token didn’t care. ENA sat near $0.18, after the Binance hacker sold 217.5M ENA for about $34M on Oct 30 and pushed it to $0.1865. And the thing that would actually move ENA hasn’t started. The buyback only switches on when USDe supply reaches $7.5B, and it was about $4.7B in late October, roughly $2.8B short. The news is real, and the open question is whether the token notices it before that number moves. 📐 Key levels 🔹 Support: about $0.1658, where ENA bounced earlier 🔹 Resistance: $0.20, then $0.21 to $0.22 🔹 My stop at $0.17916 wasn’t under any of these. It sat 0.2% below entry. ⚠️ Risks USDe has shrunk from near $15B a year ago, and the buyback needs it to reach $7.5B. If funding rates compress, the revenue behind that buyback shrinks too. The hacker may not be done selling. And Bitcoin was still fragile after the Binance hack, with ETF outflows of $643M on Oct 30. 🧠 What I learned ✅ What I did right: a clear catalyst, a stop on the order, and a loss of about 0.02 USDT. ❌ What I’d fix: 1️⃣ My question was about USDe supply, which moves over weeks, and my stop was 0.2% from entry. A slow question needs a wide stop, or no trade. 2️⃣ The honest stop sits under $0.1658. From $0.1795 that’s about $0.0145 per ENA, which at 41 ENA risks about 0.60 USDT. My real risk was 0.02, so my stop was about 35 times too tight for the idea. 3️⃣ At $7 of position, fees (about 0.008 USDT) are half the size of the price loss. Tiny positions with tiny stops give a lot of the result to the exchange. 4️⃣ The card says −5.43%, but that’s 0.22% multiplied by 25. The real risk was cents. ENA doesn’t have a date, it has a number. Until USDe supply moves toward $7.5B, I’ll treat every bounce as a question, not an answer. #ByXIMPACT #WSOT2026 #BlockchainSecurity #PiecesOf8 #WSOTPicktoEarn10U $BTCUSDT $ENAUSDT
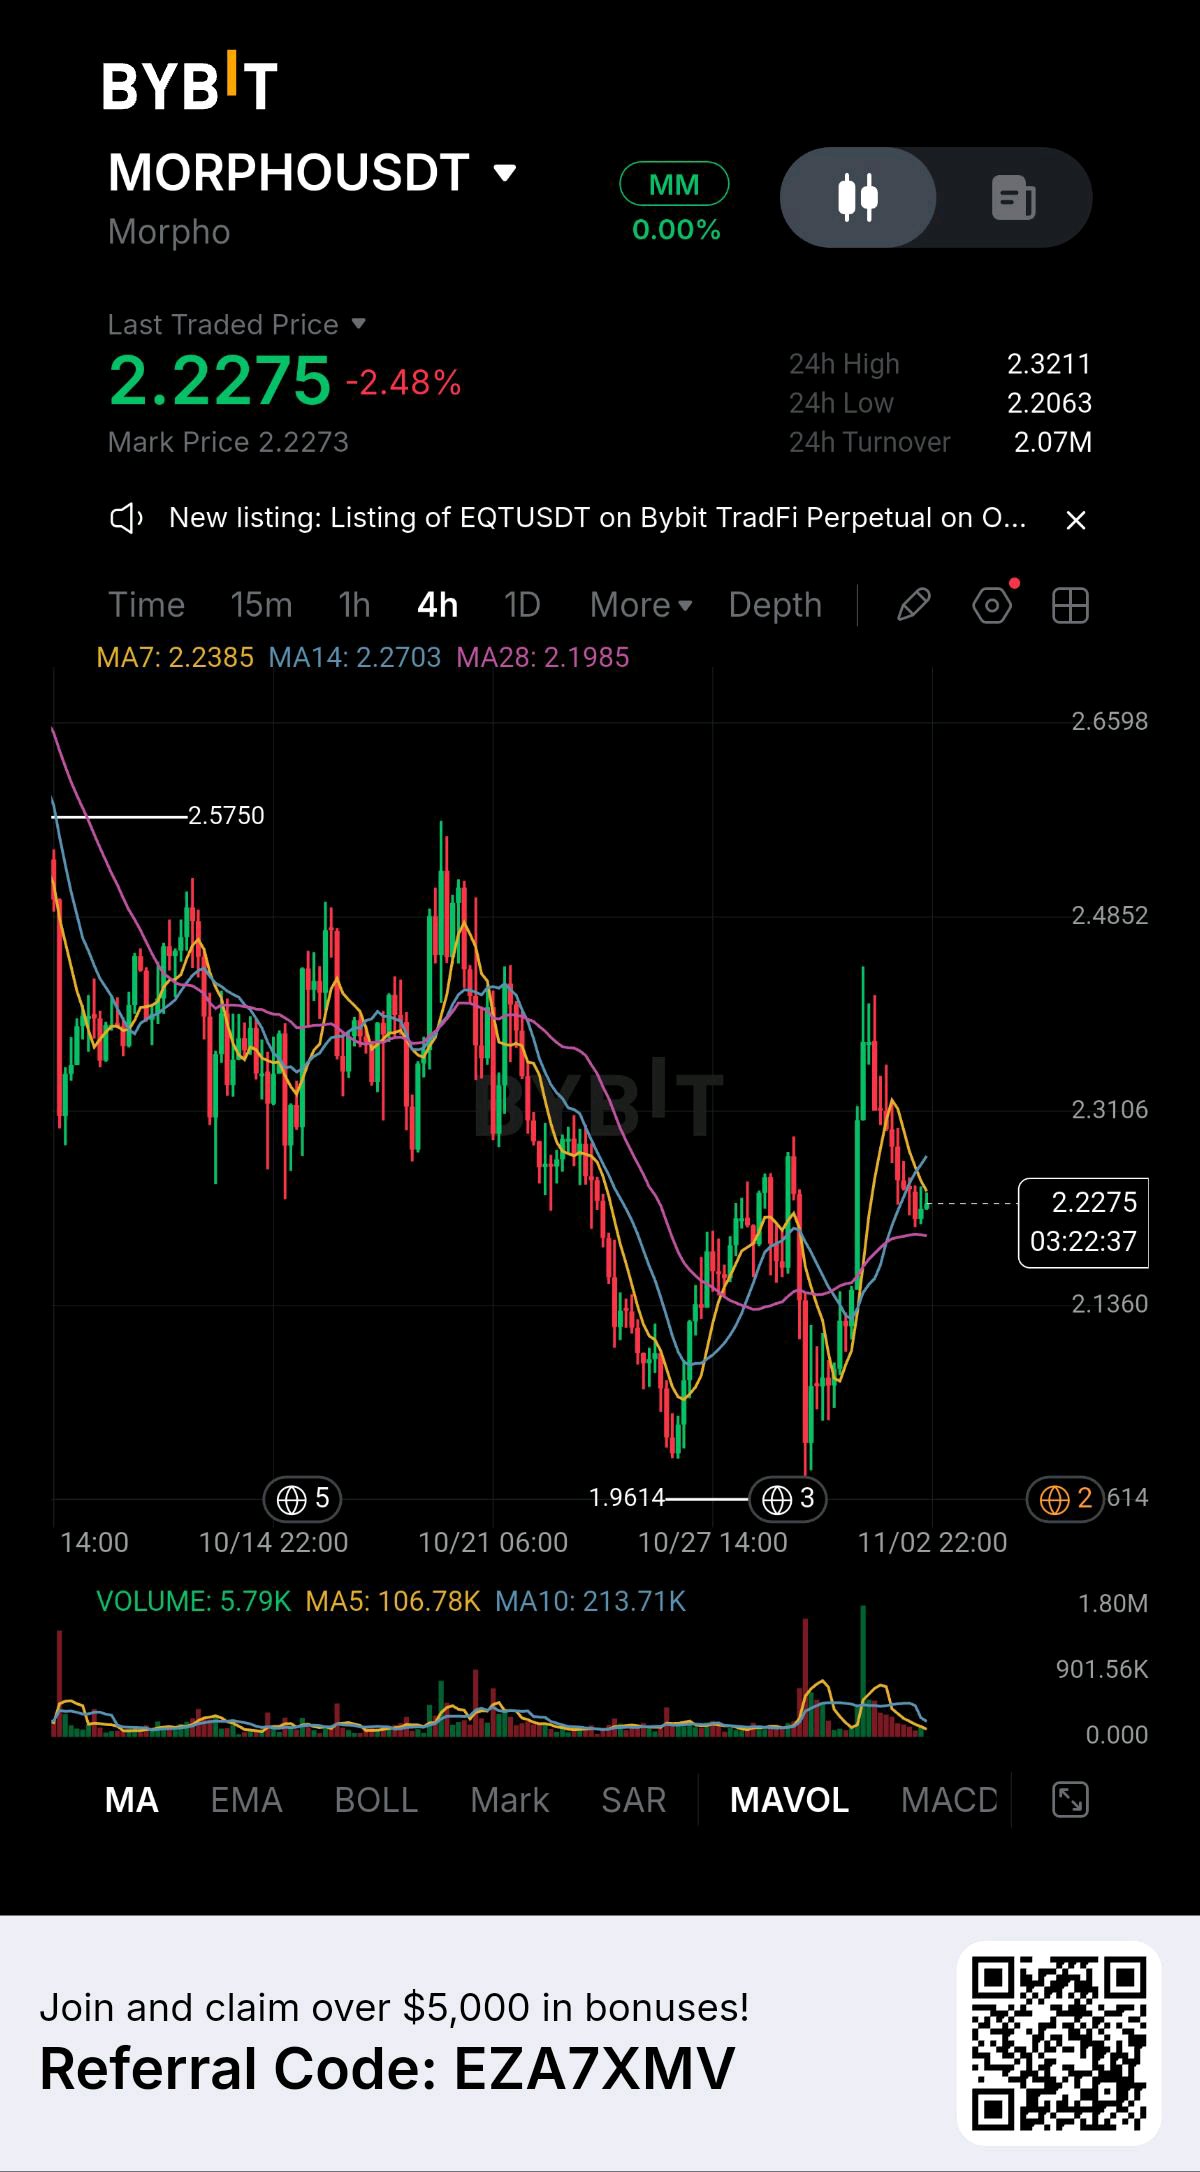
MORPHO: Coinbase, Robinhood and Apollo all run on it. But what does the MORPHO token get out of it? Millions of people may already be earning yield through Morpho without ever hearing its name. That is exactly what makes it interesting. What’s new? The customers. Coinbase’s lending product runs on Morpho vaults. Robinhood Earn, which launched alongside Robinhood Chain on July 1, routes stablecoin deposits into Morpho vaults for an estimated 7% yield. The institutions. Apollo launched institutional credit vaults on Morpho. Galaxy Curator, built on Morpho, reaches more than 2,400 Fireblocks clients, and BitGo is also adding Morpho vaults for institutions. The scale. Morpho holds more than $10 billion in deposits, and it raised $175 million in June from Paradigm, a16z Crypto and Ribbit Capital at a valuation above $2 billion. My view: this is real infrastructure, not hype. Large platforms are choosing Morpho for lending. But here is the catch. I started with the fee line, because that is where the token comes in. Morpho’s fee switch is off. In the 30 days to September 29, Morpho kept $0 of $19.51 million in fees. The MORPHO token governs the protocol, but it does not receive its revenue, and nothing is burned. Governance can turn the fee switch on by vote, up to 25% of the interest borrowers pay. Morpho’s CEO has argued that reinvesting fees into the product creates more value than paying them out. That may prove true, but it is a bet on the team, not a claim on revenue. What does the market show? MORPHO traded near $2.31 on November 1, after a 7.9% daily gain. At $2.31 on a supply of 1 billion tokens, the token is valued at about $2.3 billion, close to the June funding valuation. That is my own math. Apollo has agreed to buy up to 90 million MORPHO, about 9% of supply, over four years, through open-market and OTC purchases, with caps and restrictions. That is real demand. But it is spread over four years. The number I keep coming back to is $0, as in $0 of $19.51 million. Where I land: Morpho may become the lending layer of institutional DeFi. But being the winner in lending and being a good token are two different questions. I would watch whether governance ever votes to turn on the fee switch, and how much of Apollo’s purchase actually reaches the market. And here is the question: if Morpho’s growth never reaches the token, what exactly is the market paying for? #ByXIMPACT #WSOT2026 #BlockchainSecurity #PiecesOf8 #MidtermsMarketWatch $BTCUSDT $MORPHOUSDT
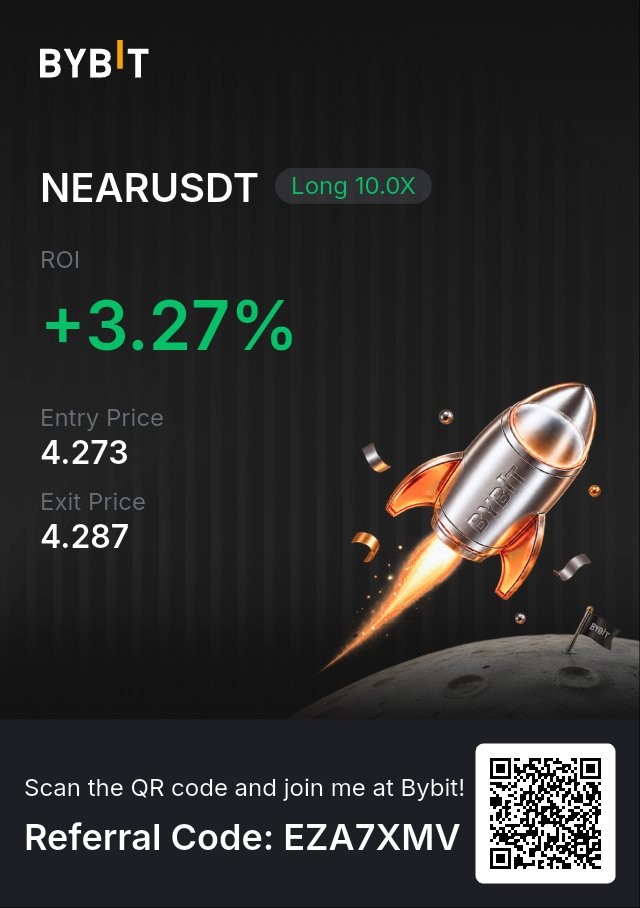
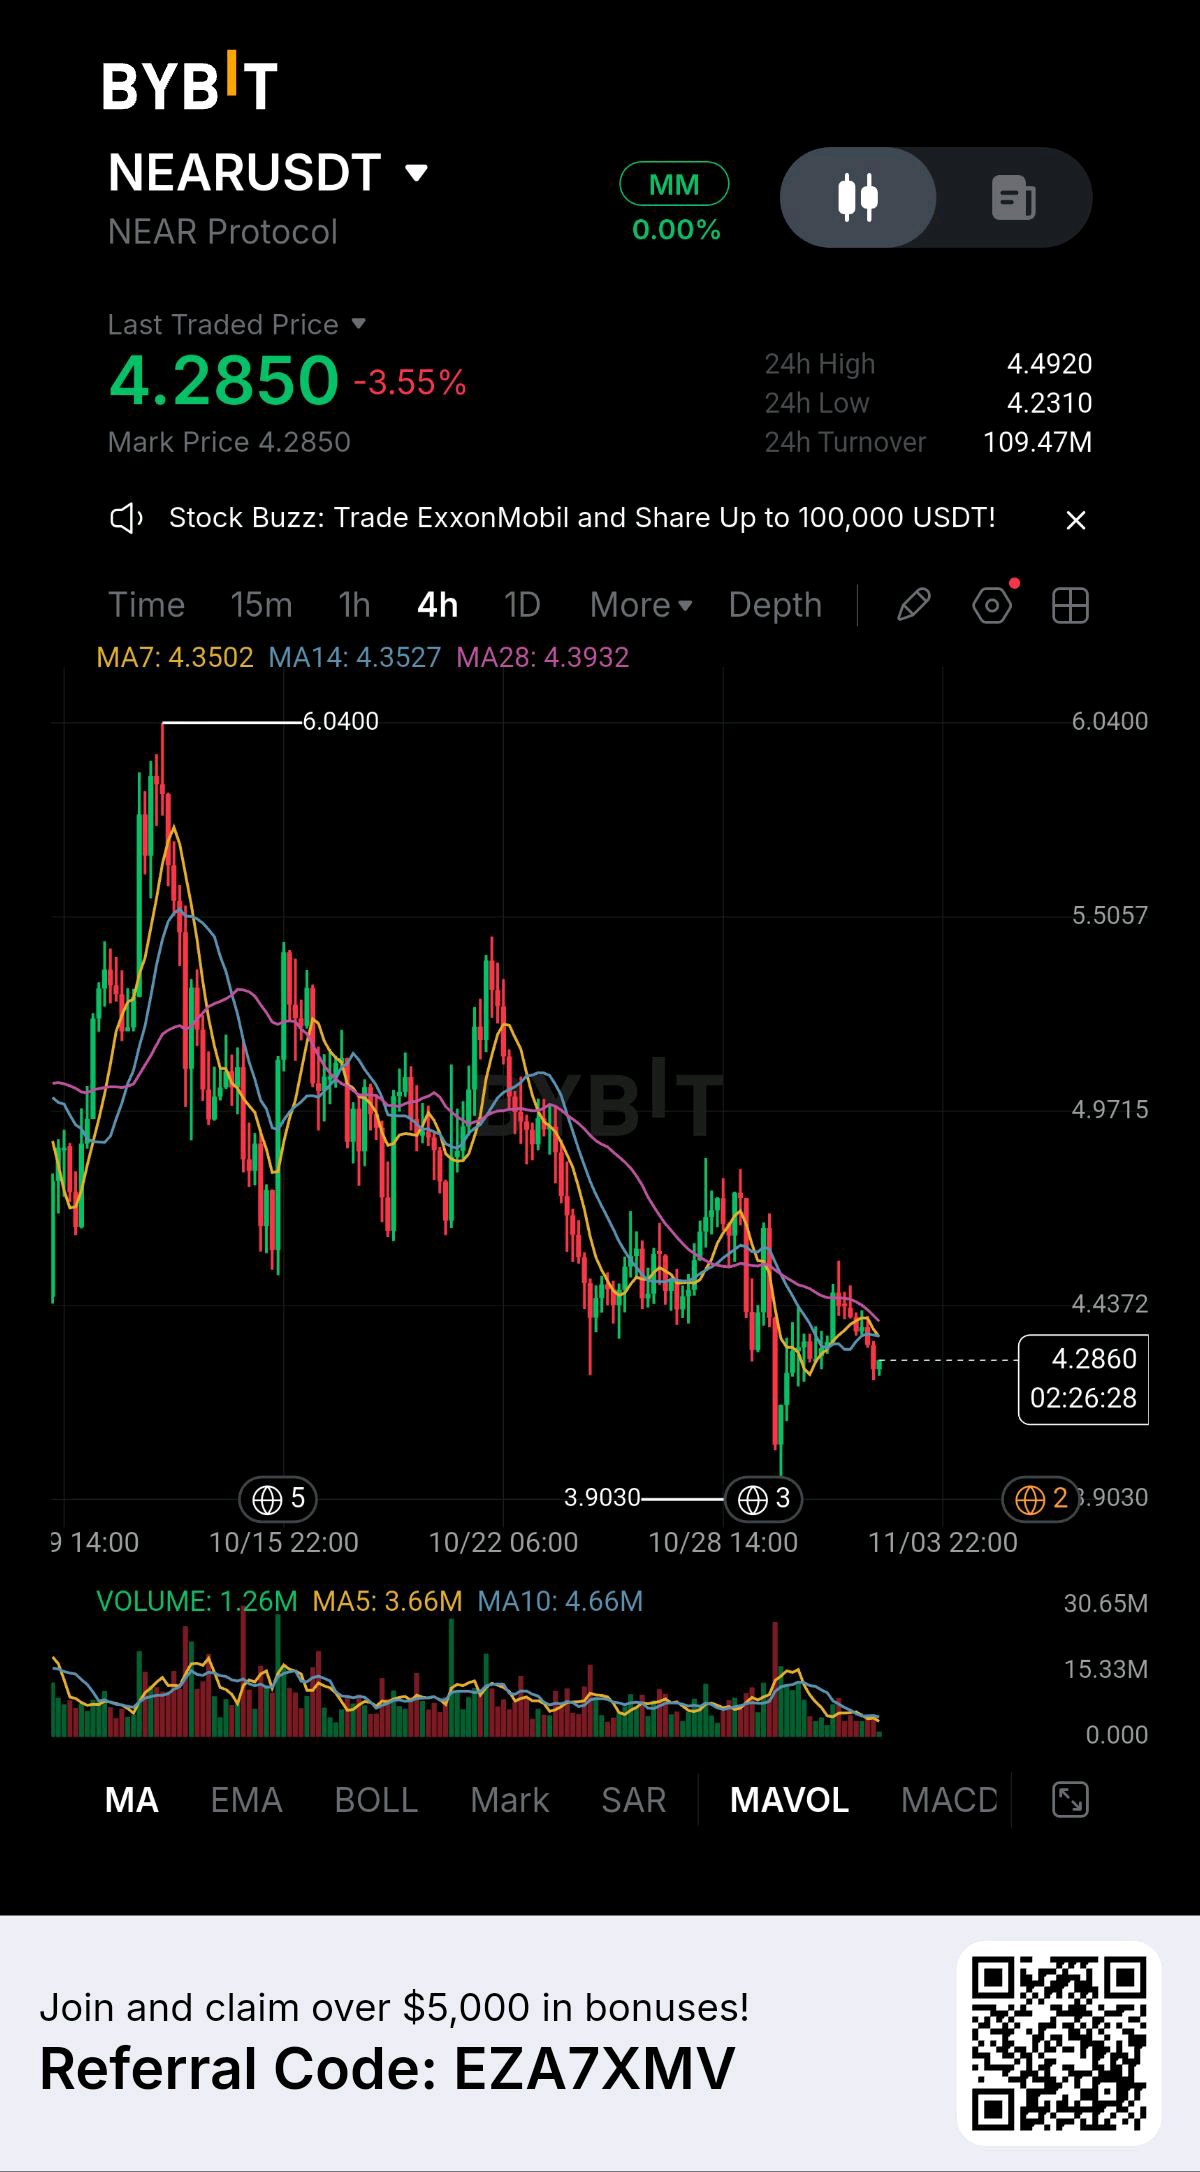
NEAR: a supply-cut vote was 20 hours away and price sat under every average. I took a small bounce and left before the result. 📊 My trade LONG NEAR/USDT, 10x 📍 Entry: $4.273 (limit) 🛑 Stop loss: $4.26 (0.3% below entry, never hit) ✅ Exit: $4.287, closed by hand 📦 Size: 3.8 NEAR (about $16) 📈 Result: price moved +0.33%, which paid +3.27% ROI (about +0.05 USDT before fees) ⚙️ Why I took it NEAR’s House of Stake vote on cutting annual issuance from 2.5% to 1.6% over 24 months closes at 16:48 UTC on Nov 2. If it passes, about 11.8M fewer NEAR would be issued over two years. But the chart wasn’t treating that as good news. NEAR was around $4.37 on Nov 1, under every short-term average. Open interest was about $1.10B, down 22.8% in 30 days and near its $1.04B low. And the Bitwise NEAR ETF took in nothing on Oct 30, after $84.83M since launch. Falling leverage and no ETF buying, with a supply cut hours away. Two things stop this from being simple. Passage needs two-thirds of voting stake and 35% turnout. And approval changes nothing by itself, because a validator upgrade and a 90-day grace period come first. So my question was whether a vote that changes nothing on its own can still move the price. 📐 Key levels 🔹 $4.40: the line analysts watched, with the bias bearish below it 🔹 $4.64: the first bullish target, and a close above it flips the bias 🔹 $3.91: the bear target 🔹 My entry at $4.273 was already under the previous session’s $4.31 low, so I was buying weakness. ⚠️ Risks The vote could fail, or pass and get sold. The market was still digesting the Binance hack, Bitcoin was stuck near $77,000 to $78,000, and US spot Bitcoin ETFs saw $643M in outflows on Oct 30. 💡What I learned ✅ What I did right: I took profit before an unknown result, kept a stop on the order, and capped the risk at about 0.05 USDT. 📝 What I’d fix: 🔹 I made $0.014 per NEAR and risked $0.013, a ratio of about 1.1 to 1. That’s thin, and fees took roughly a quarter of the gross gain. 🔹 The card says +3.27%, but that’s a 0.33% price move multiplied by 10x. The real money was about five cents. 🔹 I traded 20 hours before the vote closed and exited before it printed, so this trade told me nothing about my claim. The test is what happens after 16:48 UTC. The vote closes at 16:48 UTC. I’m flat, so I get to watch how NEAR and its open interest react without a position, which is the one part of the thesis this trade never tested. #ByXIMPACT #WSOT2026 #BlockchainSecurity #IMPACTbyTrade #MidtermsMarketWatch $BTCUSDT $NEARUSDT
ETH: ETFs have sold 23 sessions in a row, yet Ethereum is still holding $2,200. 👀 I’ve recently been watching how ETH behaves under pressure. US spot ETH ETFs have logged outflows for 23 trading sessions straight, their longest streak since launch. October withdrawals came to about $1.61B. Yet ETH sits near $2,270, down about 13% on the month. That tells me something about who is selling and who isn’t. 📊 Why ETH is on my screen ? 🔹 Corporate demand. BitMine added 10,452 ETH last week and now holds about 6.05M ETH, 4.95% of supply. Its stated target is 5%. 🔹 Funds versus buyers. One day of ETF selling ($155.7M on Oct 30) was about six times BitMine’s whole weekly purchase. The selling is much bigger, and the price still hasn’t broken. 🔹 Staking. Record amounts of ETH are locked in staking, so there is less supply available to sell. 🎯 What levels are important right now? $2,300 — nearest resistance. $2,400 — the next target if the bounce continues. $2,200 — important support. $2,100 — the next zone of interest for sellers in case of a breakdown. My trading logic: I will consider a LONG after a daily close above $2,400, ideally with the first ETF inflow day in weeks. SHORT becomes more interesting if the price loses $2,200 and cannot return above it. But there is one nuance: the 23-session streak is the trend. One green ETF day would be big news, and until then rallies can fade. My conclusion: ETH is worth attention right now not because of the price, but because of the gap between record fund selling and a chart that hasn’t broken. I’m waiting for the price to confirm before risking capital. Wall Street has sold ETH 23 sessions in a row. Is the biggest buyer in crypto catching a falling knife, or is the smart money selling the bottom? #ByXIMPACT #WSOT2026 #BlockchainSecurity #MidtermsMarketWatch #NewFinancialPlatform $BTCUSDT $ETHUSDT

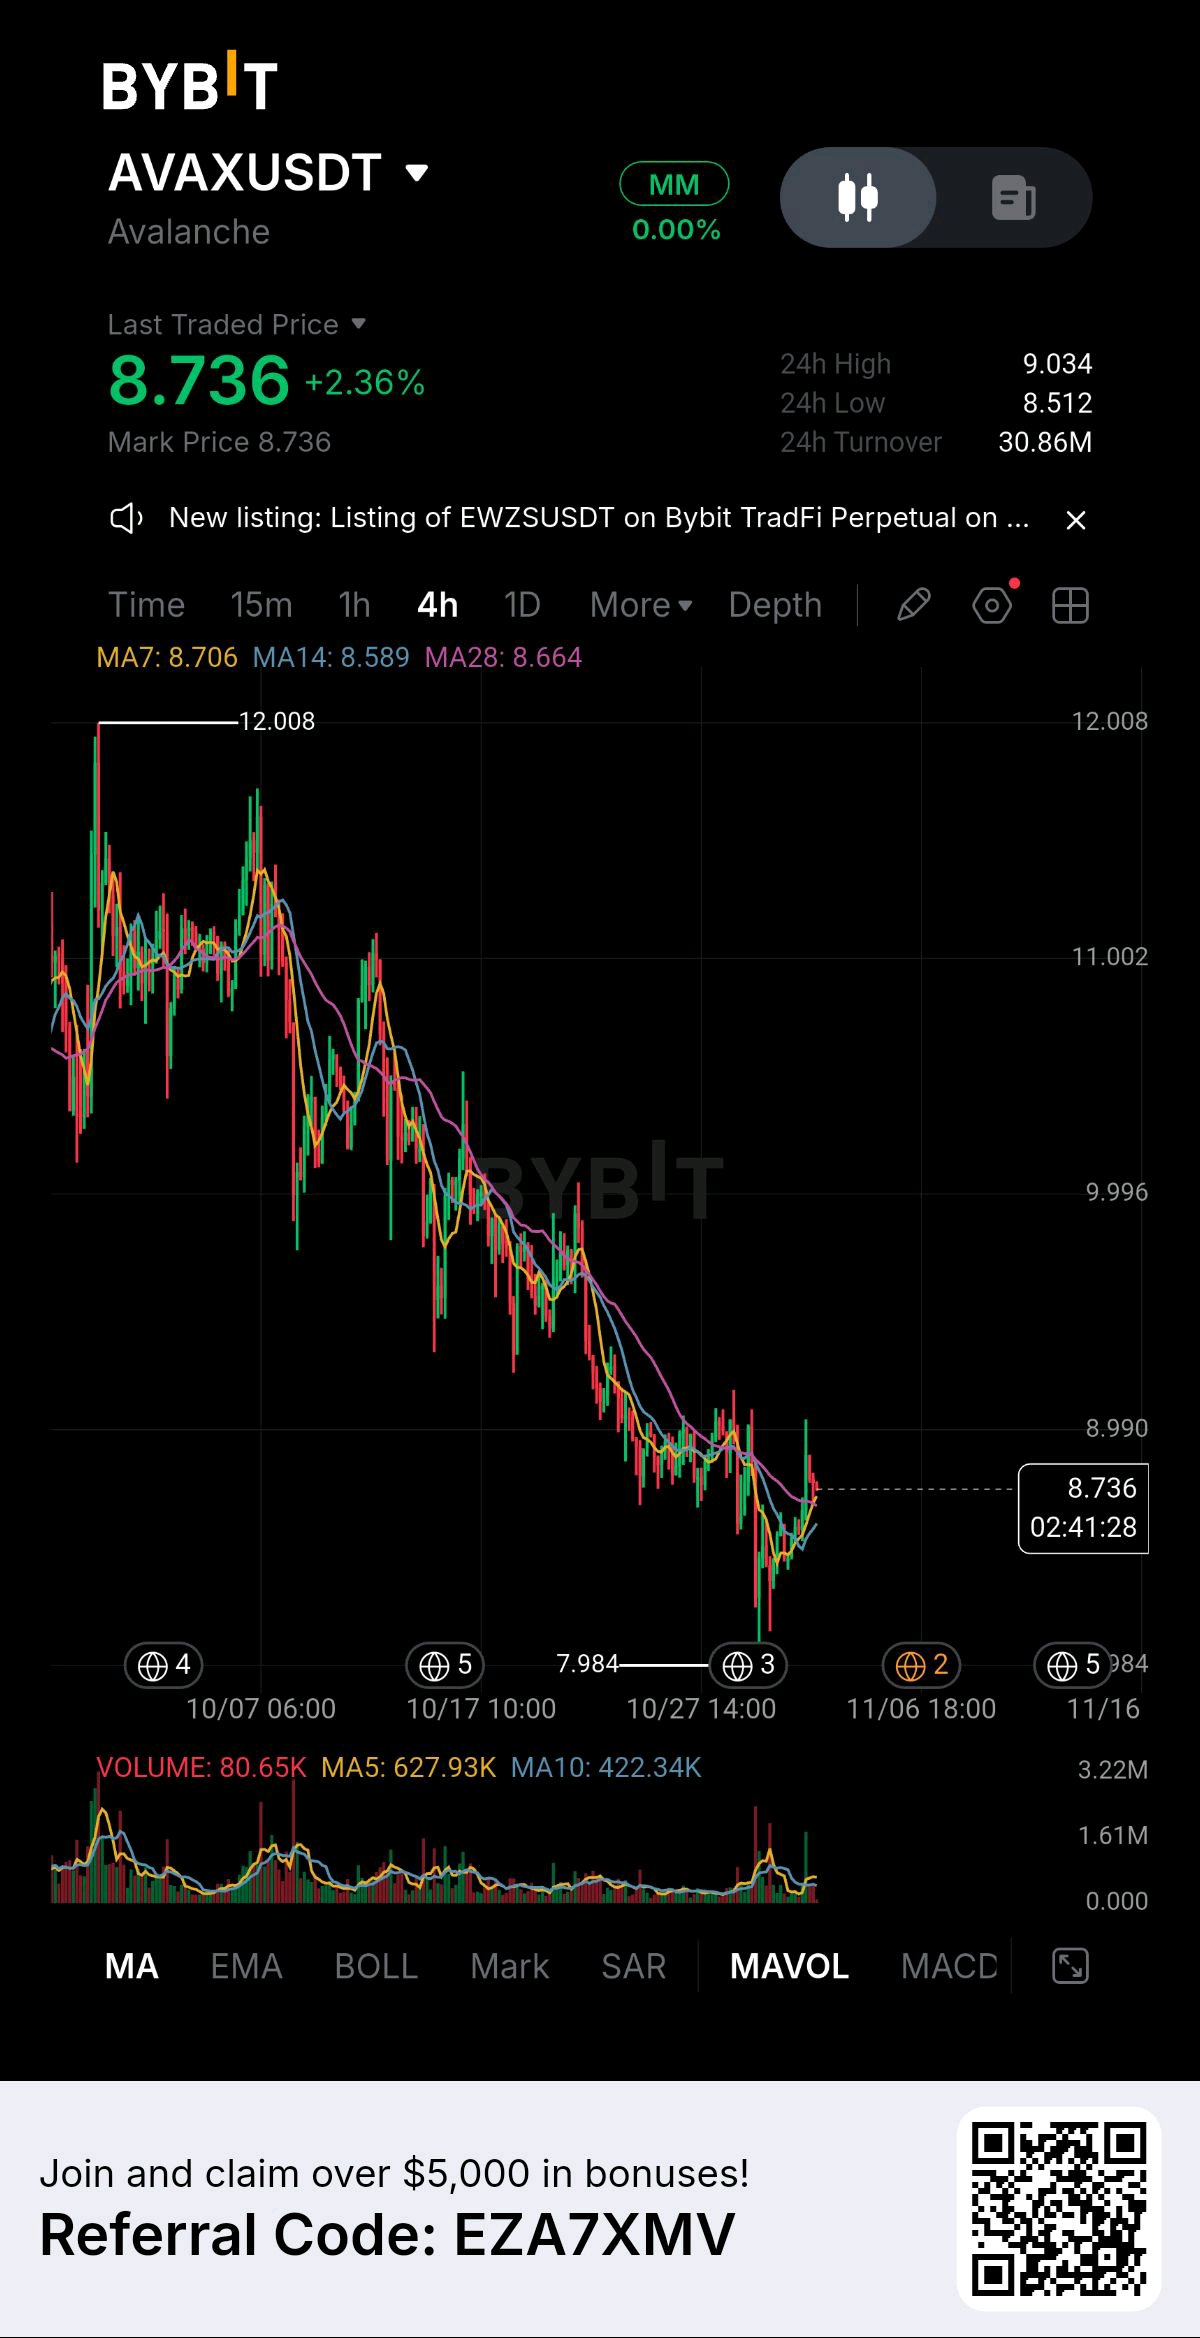
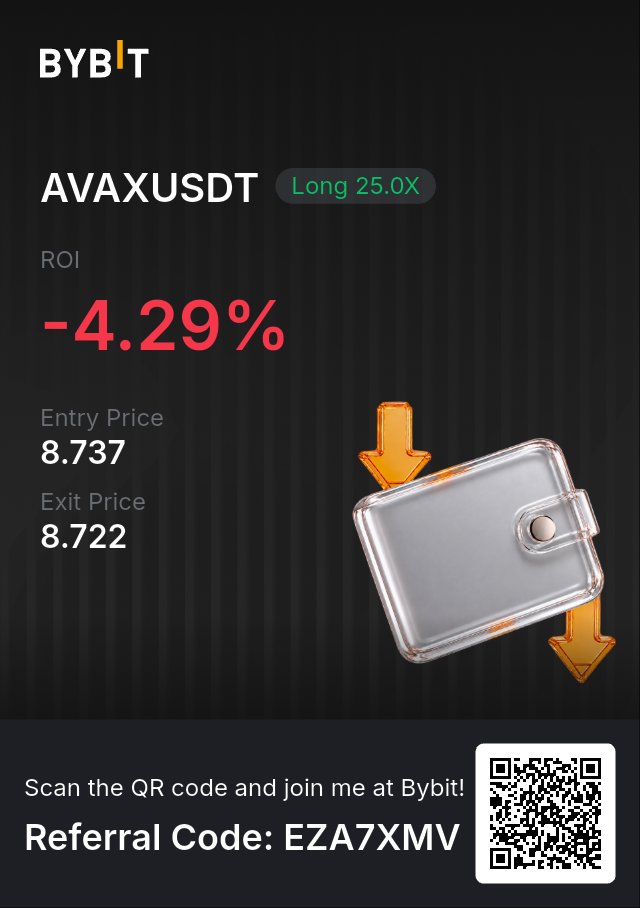
Japan began paying tourist tax refunds on Avalanche today. I traded the launch, my stop hit, and the loss taught me more than a win would. 📊 My trade LONG AVAX/USDT, 25x 📍 Entry: $8.737 🛑 Stop loss: $8.723 (hit, filled at $8.722) 📦 Size: 2.4 AVAX (about $21 notional) 📉 Price moved −0.17%, which cost −4.29% ROI (about −0.04 USDT before fees) 📌 Why I took it On Nov 1, Japan’s tax-free shopping moved to a refund-after-departure system, and Japan Tax Free and UPBOND began paying tourist refunds in the yen stablecoin JPYC on Avalanche’s C-Chain. That’s a government-linked payment flow on a public chain, announced Oct 29. But the token wasn’t pricing it. AVAX hit $8.06 on Oct 30, about 94% below its 2021 peak, and CoinGlass open interest fell from about $650M in early October to about $350M. Meanwhile Avalanche holds about $1.30B in stablecoins and tokenized cash, and BlackRock’s BUIDL is about 37% of it. Balances were growing while leverage left. One venue, Binance, showed open interest up 13% on Oct 30, so I treated the signal as unsettled. I’m not saying a tourist refund moves a $3.7B token. Refunds are paid only after the customs check at departure, so early volume will be small. What interested me was a narrower question: does open interest rebuild from about $350M now that the service is live? 📐 Key levels 🔹 Support: $8.30, then $8.00, then $7.51 🔹 Breakout zone: $8.50, which my entry sat above 🔹 Resistance: $10.09 ⚠️ Risks The Binance exploiter moved 444,537 AVAX onto Avalanche, and Aave froze its Avalanche markets before reopening them. Bitcoin had just made a six-week low near $76,400, and the US midterms are Tuesday. 🧠 Lessons from this trade 1️⃣ A stop is a price, not a verdict. My AVAX stop at $8.398 hit yesterday, and AVAX is trading above $8.70 today. Being stopped out and being wrong are different things. The stop did its job both times. 2️⃣ My stop was inside the noise. It sat 0.16% under entry in a coin that moved from about $8.00 to $9.09 in a day, roughly 13%. At that distance the stop measures noise, not the thesis. It capped my loss near 0.03 USDT, but it tested nothing. 3️⃣ ROI is a leverage artifact. −0.17% in price became −4.29% at 25x. What I actually managed was price distance times size: 0.014 × 2.4 ≈ 0.034 USDT. That number is the risk. 4️⃣ Fix the order, not just the lesson. Next time the stop goes under the level that breaks the idea, and the size comes from it: max loss ÷ stop distance. If that size falls under the exchange minimum, I skip the trade. 5️⃣ Two trades, roughly flat. My XRP short made +0.03 and this made about −0.04. Both followed a stop I set before entry, which is why both outcomes were affordable. 📝 The rule behind it Before every trade I write down five things: the claim, the number that tests it, the level where I’m wrong, the size, and how I’ll exit. Reading the market gives you an opinion. A stop gives you a trade. #ByXIMPACT #WSOT2026 #BlockchainSecurity #IMPACTbyTrade #NewFinancialPlatform $BTCUSDT $AVAXUSDT
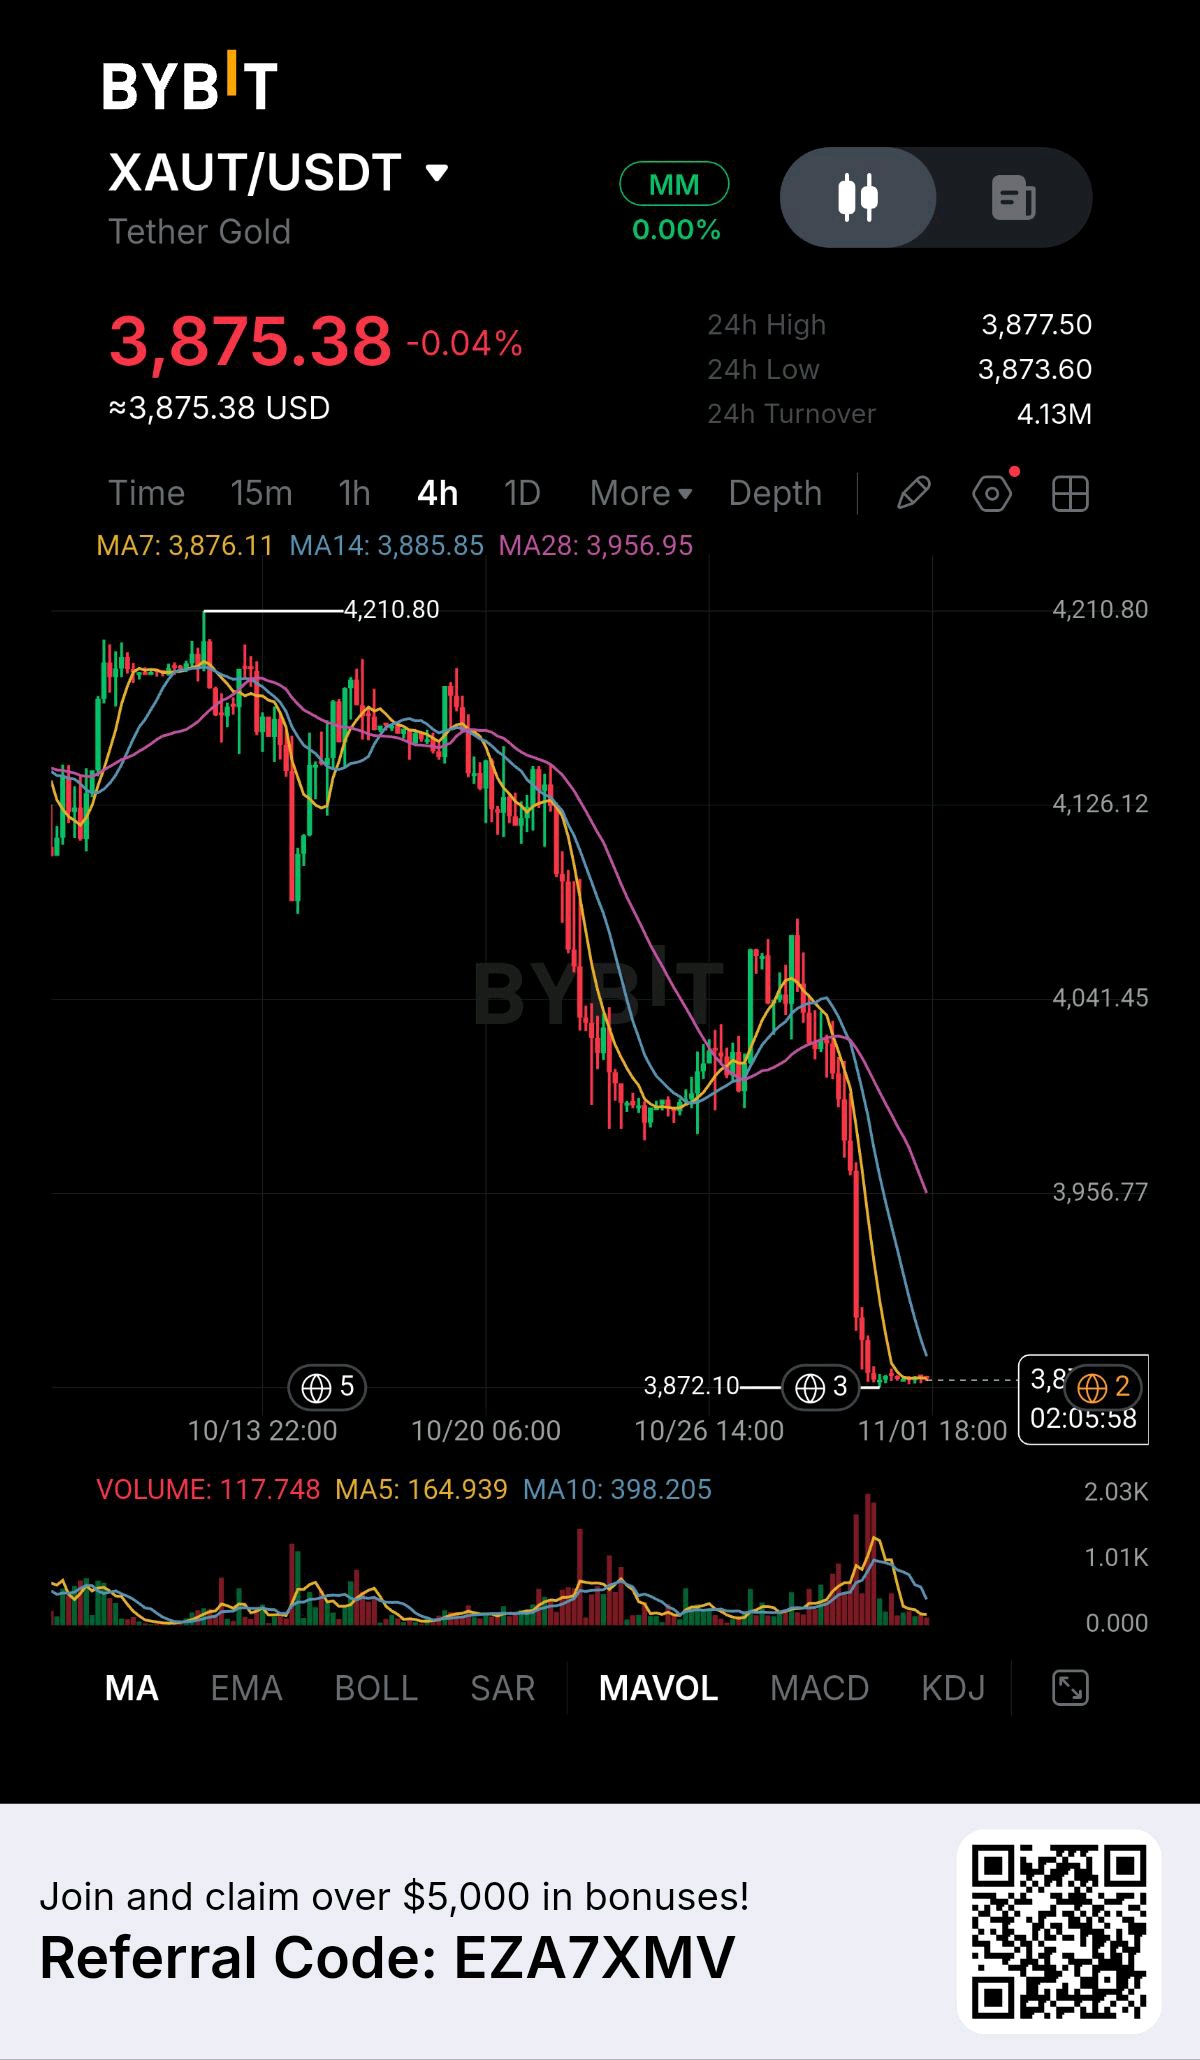
$XAUTUSDT is frozen at the lows after a brutal week for gold, and the reopen will decide what happens next. Price is 3,875.38, flat today, but it’s down about 8% from the 4,210.80 high. Spot gold was down 3.74% on the week and 3.62% on Friday alone, and last traded at 3,875.05. So this token is simply sitting at Friday’s close. What makes this week strange is that gold fell during a nervous market, when it usually rises. The September PCE inflation reading rose 0.5%, the biggest monthly gain since March, and higher oil prices strengthened bets on a Fed rate hike in December. Analysts also say gold got dragged down with equities as investors sold liquid assets for cash. That’s a market selling what it can, not what it wants to. Turnover The 24-hour turnover is 4.13M, and the whole day’s range is just 3,873.60 to 3,877.50. That’s not strength or weakness, it’s a pause. The underlying gold market is likely closed for the weekend, so the price can’t move until it reopens. Volume The sell-off printed heavy volume bars (the chart’s scale reaches 2.03K), and then everything went quiet. The MA5 (164.939) is far below the MA10 (398.205). The current 4h candle is still open, so its own reading is incomplete. Sellers already did their work, and now nobody is trading. That tells me the next move will come from the reopen, not from this chart. Moving Averages MA7: 3,876.11 | MA14: 3,885.85 | MA28: 3,956.95 Price is sitting right on MA7 and just under MA14, while MA28 is about 2.1% overhead and still sloping down. All three averages are pointing lower. Until price gets back above that cluster, the trend is still down. Levels to watch · 4,210.80 — The high from earlier this month. · 3,956.95 — MA28, the heavy overhead resistance. · 3,900 — The round number gold just lost, now resistance. · 3,885.85 — MA14, the first hurdle. · 3,875.38 — Where we are right now. · 3,872.10 — The low of this move, with no chart support below it. Consideration The mood around gold is very one-sided. In a weekly Kitco survey, 63% of analysts expected gold to fall further and only 6% expected it to rise. When almost everyone leans the same way, a sharp bounce is possible if the bad news is already priced in. But the macro pressure is real, so I’m not betting on that either. Trade plan · The Bullish Path: A strong 4h close back above 3,900, with price over MA14 (3,885.85), would show buyers are taking control. The next stop after that is MA28 at 3,956.95. · The Bearish Path: If we lose 3,872.10, there’s nothing on the chart to catch the fall, so a move to fresh lows is likely. · My take: I’m staying patient. I don’t want to guess the gap at the reopen. I’ll wait for gold to trade, then look for a confirmed 4h close above 3,900 before thinking about a long. Support and resistance Support: 3,872.10 (move low), with no clear level below Resistance: 3,885.85 (MA14) → 3,900 (round number) → 3,956.95 (MA28) Invalidation and risk note This setup is invalidated if we close a 4h candle below 3,872.10. The biggest risk is the reopening gap: price can jump straight past these levels before a normal candle forms, and early-session liquidity can be thin. Don’t guess the direction, wait for the break. #ByXIMPACT #WSOT2026 #BlockchainSecurity #IMPACTbyTrade #MidtermsMarketWatch $BTCUSDT $XAUTUSDT
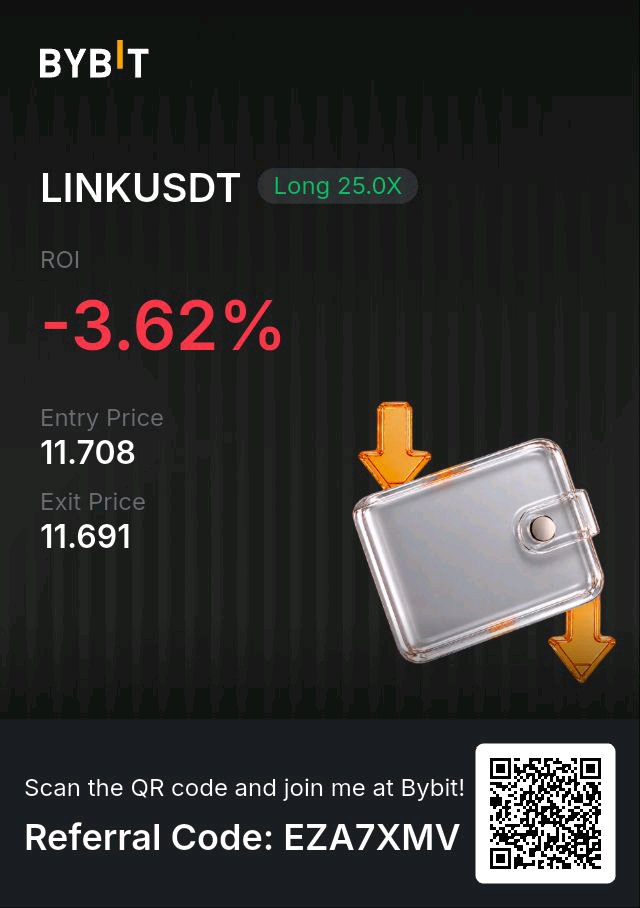
LINK: Hanwha chose Chainlink for tokenization, and the price is up about 6% since. I bought the bounce below $11.83. Stop hit. 🛑 The news was real, and the bounce was already underway. I was out in 15 seconds. My trade 📊 LONG LINK/USDT 📍 Entry: $11.708 (limit) 🛑 Stop loss: $11.693 (filled at $11.691) ⚙️ Leverage: 25x 📉 ROI: −3.62% (price move −0.145%) The reason behind my trade 🧐 Around Oct 29–30, Hanwha Investment & Securities, part of a Fortune Global 500 group, picked Chainlink’s data standard and CCIP for a global tokenization platform. It’s also forming a working group with Chainlink on compliance, custody and collateral, ahead of South Korea’s tokenized-securities framework in February 2027. The price reacted, but only partly. LINK was near $11.02 on Oct 30, after the Binance hack, and traded near $11.70 on Nov 1, up about 6%. One analysis said the price still hadn’t been paid for the news, and that the bearish case stays alive until LINK reclaims $11.83. That was my setup: news that’s real, a bounce that’s partway done, and $11.83 about 1% above me. The question I wanted to test was whether the bounce keeps going into $11.83, or whether this is where it stalls. 🚨 What would have proven me wrong: a drop under my stop at $11.693. Past that, the $11.53 level that one analysis flagged would be next. 📐 Key levels 🔹 My entry: $11.708 🔹 My stop: $11.693, 0.13% below entry 🔹 Reclaim level: $11.83 🔹 Resistance above: $12.26 🔹 Below: $11.53 ⚠️ Risk I was buying after a 6% bounce, not before it. At 25x, a 0.13% stop still risks about 3% of margin, and a market stop can fill worse than its trigger. LINK had moved about 2% in the prior 24 hours, so a stop 0.13% away sat well inside normal movement. Takeaway 📝 −3.62% looks big, but the price only moved 0.145%. The rest is leverage. On 2 LINK, that’s about 0.034 USDT on roughly $0.94 of margin, before fees. My stop triggered at $11.693 and filled at $11.691, which cost another 0.004 USDT, about an eighth of the loss. I also bought in the middle of the range. $11.708 sat 1.0% under the $11.83 reclaim level and 1.5% above the $11.53 level. On paper that’s about 8 to 1, 1.04% of room against a 0.13% stop. But a ratio only counts if the stop can survive normal movement, and mine couldn’t. An 8 to 1 trade that stops out in 15 seconds is a 0 to 1 trade. Next time I either buy the pullback toward $11.53 with a stop under it, or wait for a reclaim of $11.83 and buy that. The middle of the range gets skipped. #ByXIMPACT #WSOT2026 #BlockchainSecurity #IMPACTbyTrade #NewFinancialPlatform $BTCUSDT $LINKUSDT
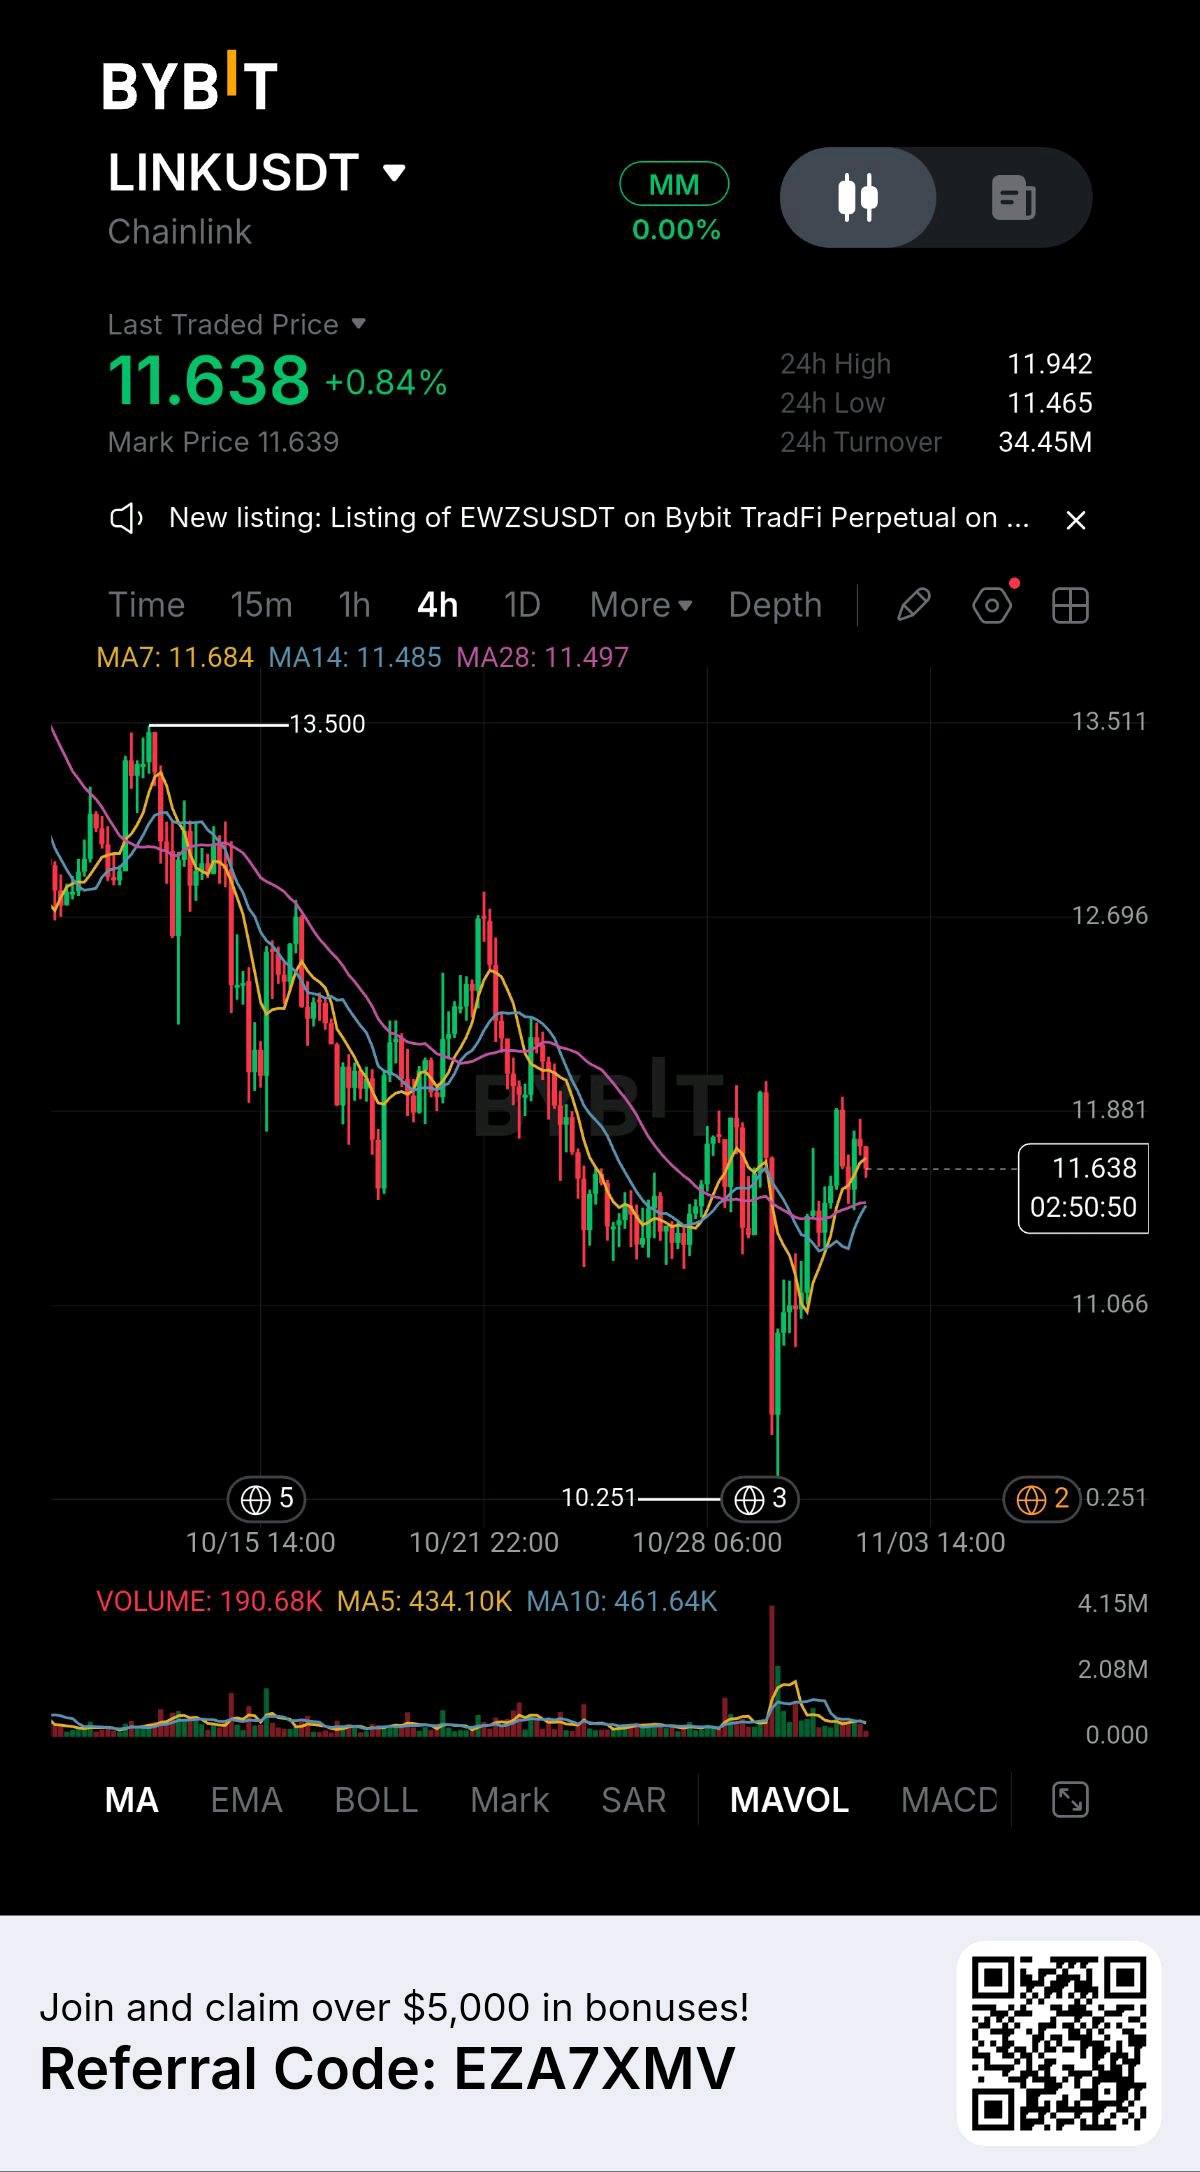
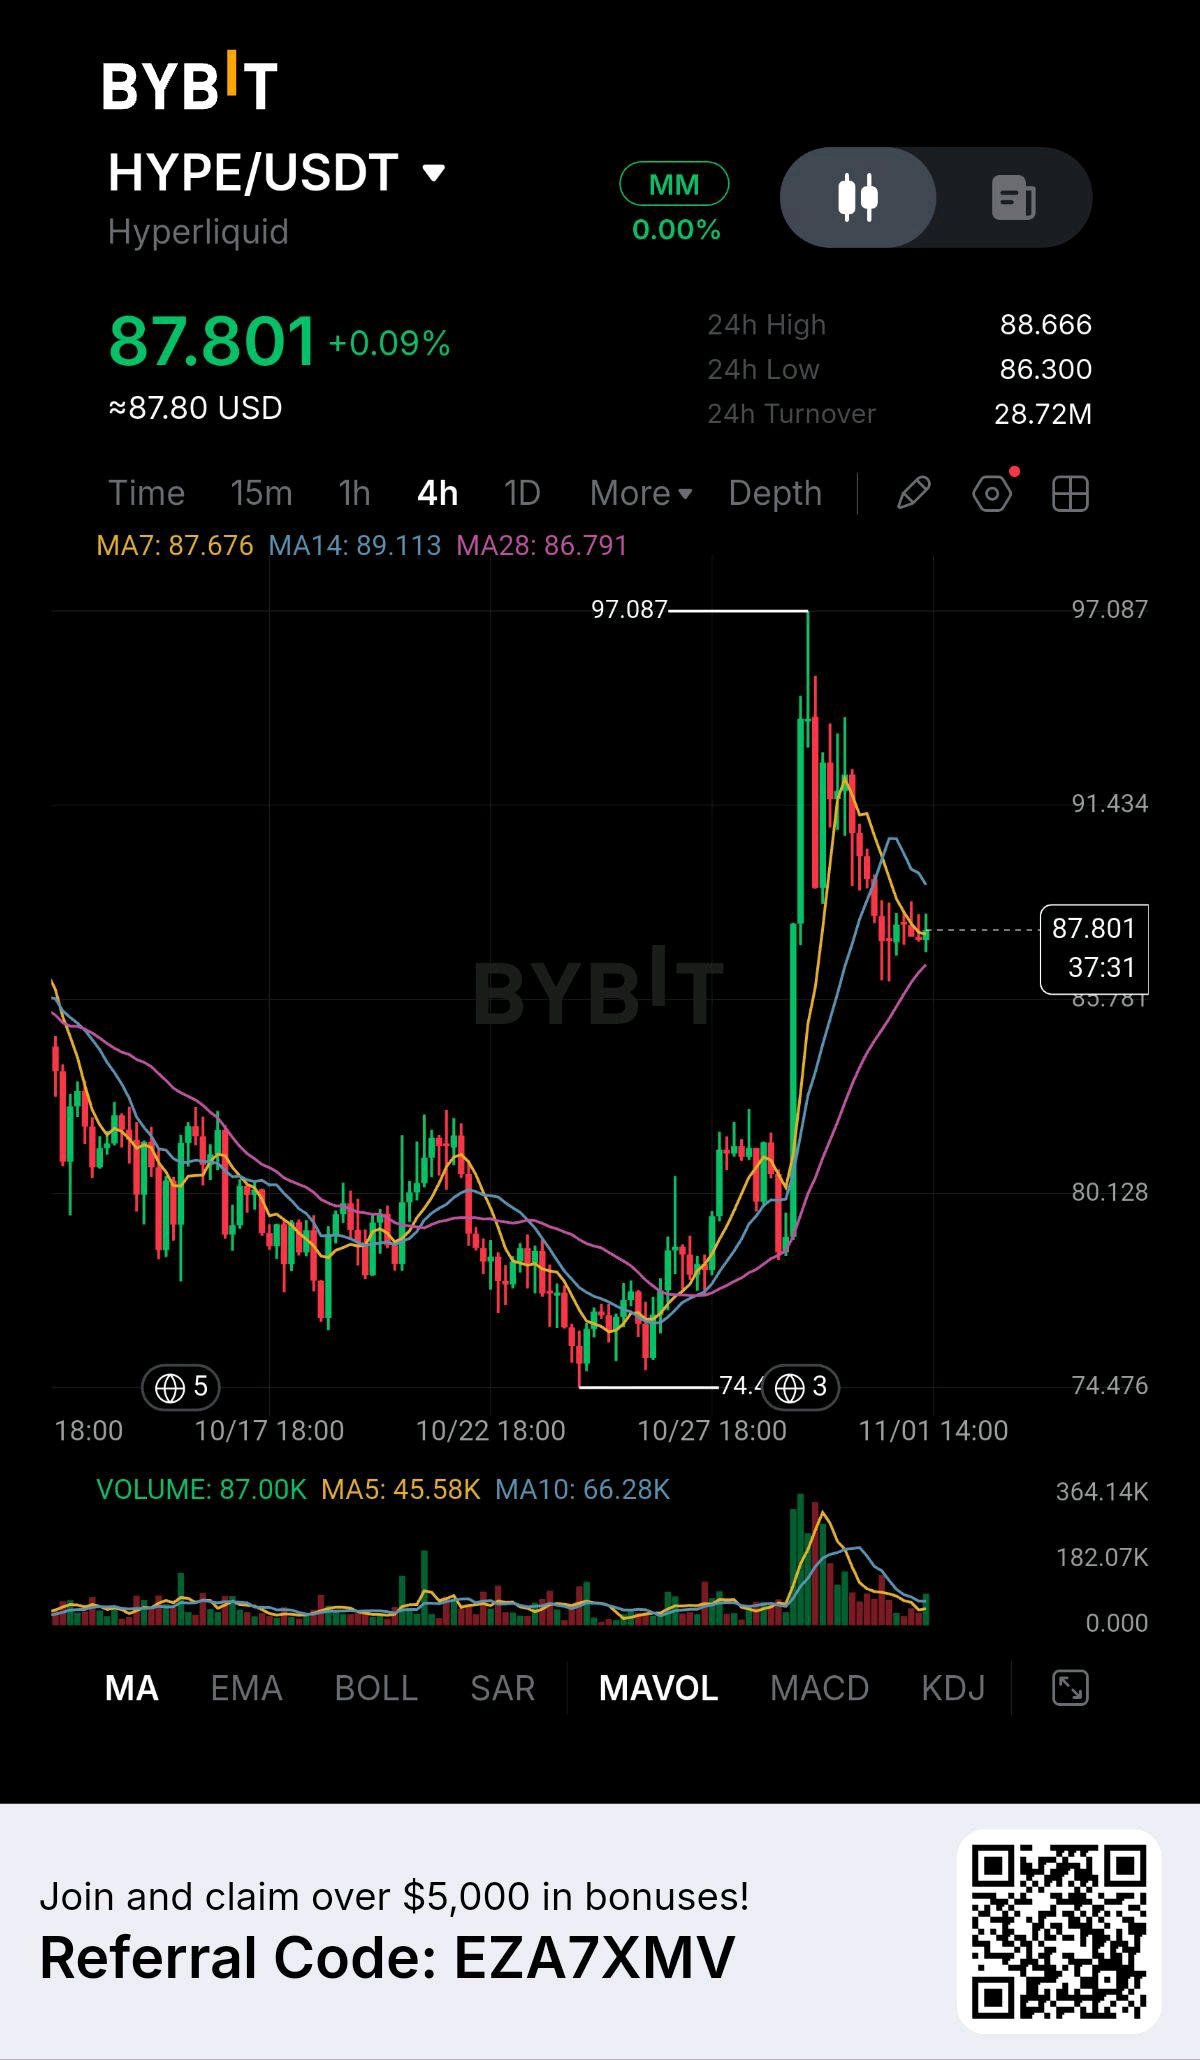
HYPERLIQUID (HYPE): the buyback machine keeps running. But the ETF money has stopped coming. A buyback is a promise of demand. A fund flow is proof of it. Hyperliquid is interesting right now because the two are telling different stories. What’s happening? The buyback. Hyperliquid’s Assistance Fund automatically spends protocol fees on buying HYPE in the open market and burning it. By October 13 it had bought more than 48 million HYPE for about $1.36 billion. A second funding stream. Since October 3, the fund also receives yield from Hyperliquid’s USDC reserves. The first transfer was about $14.6 million. The ETF stall. The three US spot HYPE ETFs hold $410.31 million, about 2.31% of HYPE’s market cap. On October 16, their daily net inflow was $0.00. I lined up the dates. HYPE was near $94 on October 6 and near $78 by October 17, a drop of about 17% in 11 days. The buyback ran the whole time. My read: a buyback is steady support, not a price floor. It can slow a fall, but it cannot stop one on its own. The counterweight. However, new supply is coming too. Hyperliquid’s core contributors unlock about 9.92 million HYPE a month, and the next release is expected around November 6. At the October 19 price of $79.93, that is roughly $790 million. A buyback also depends on revenue. If trading volume falls, the buyback shrinks with it. The market read. HYPE traded at $79.93 on October 19, ranked ninth by market cap at $20.29 billion, and still well below its late-September high of $97.88. The number I keep coming back to is $0.00. One zero is not a trend. But it is the first thing I would want to see change. My conclusion: Hyperliquid has something most tokens don’t: a buyer built into the protocol. But a built-in buyer and a new buyer are two different things. I would watch ETF flows around the November 6 unlock more than any single headline. And here is the question: can the buyback absorb the new supply and the missing ETF demand at the same time? #WSOT2026 #BlockchainSecurity #PiecesOf8 #IMPACTbyTrade $BTCUSDT $HYPEUSDT #ByXIMPACT

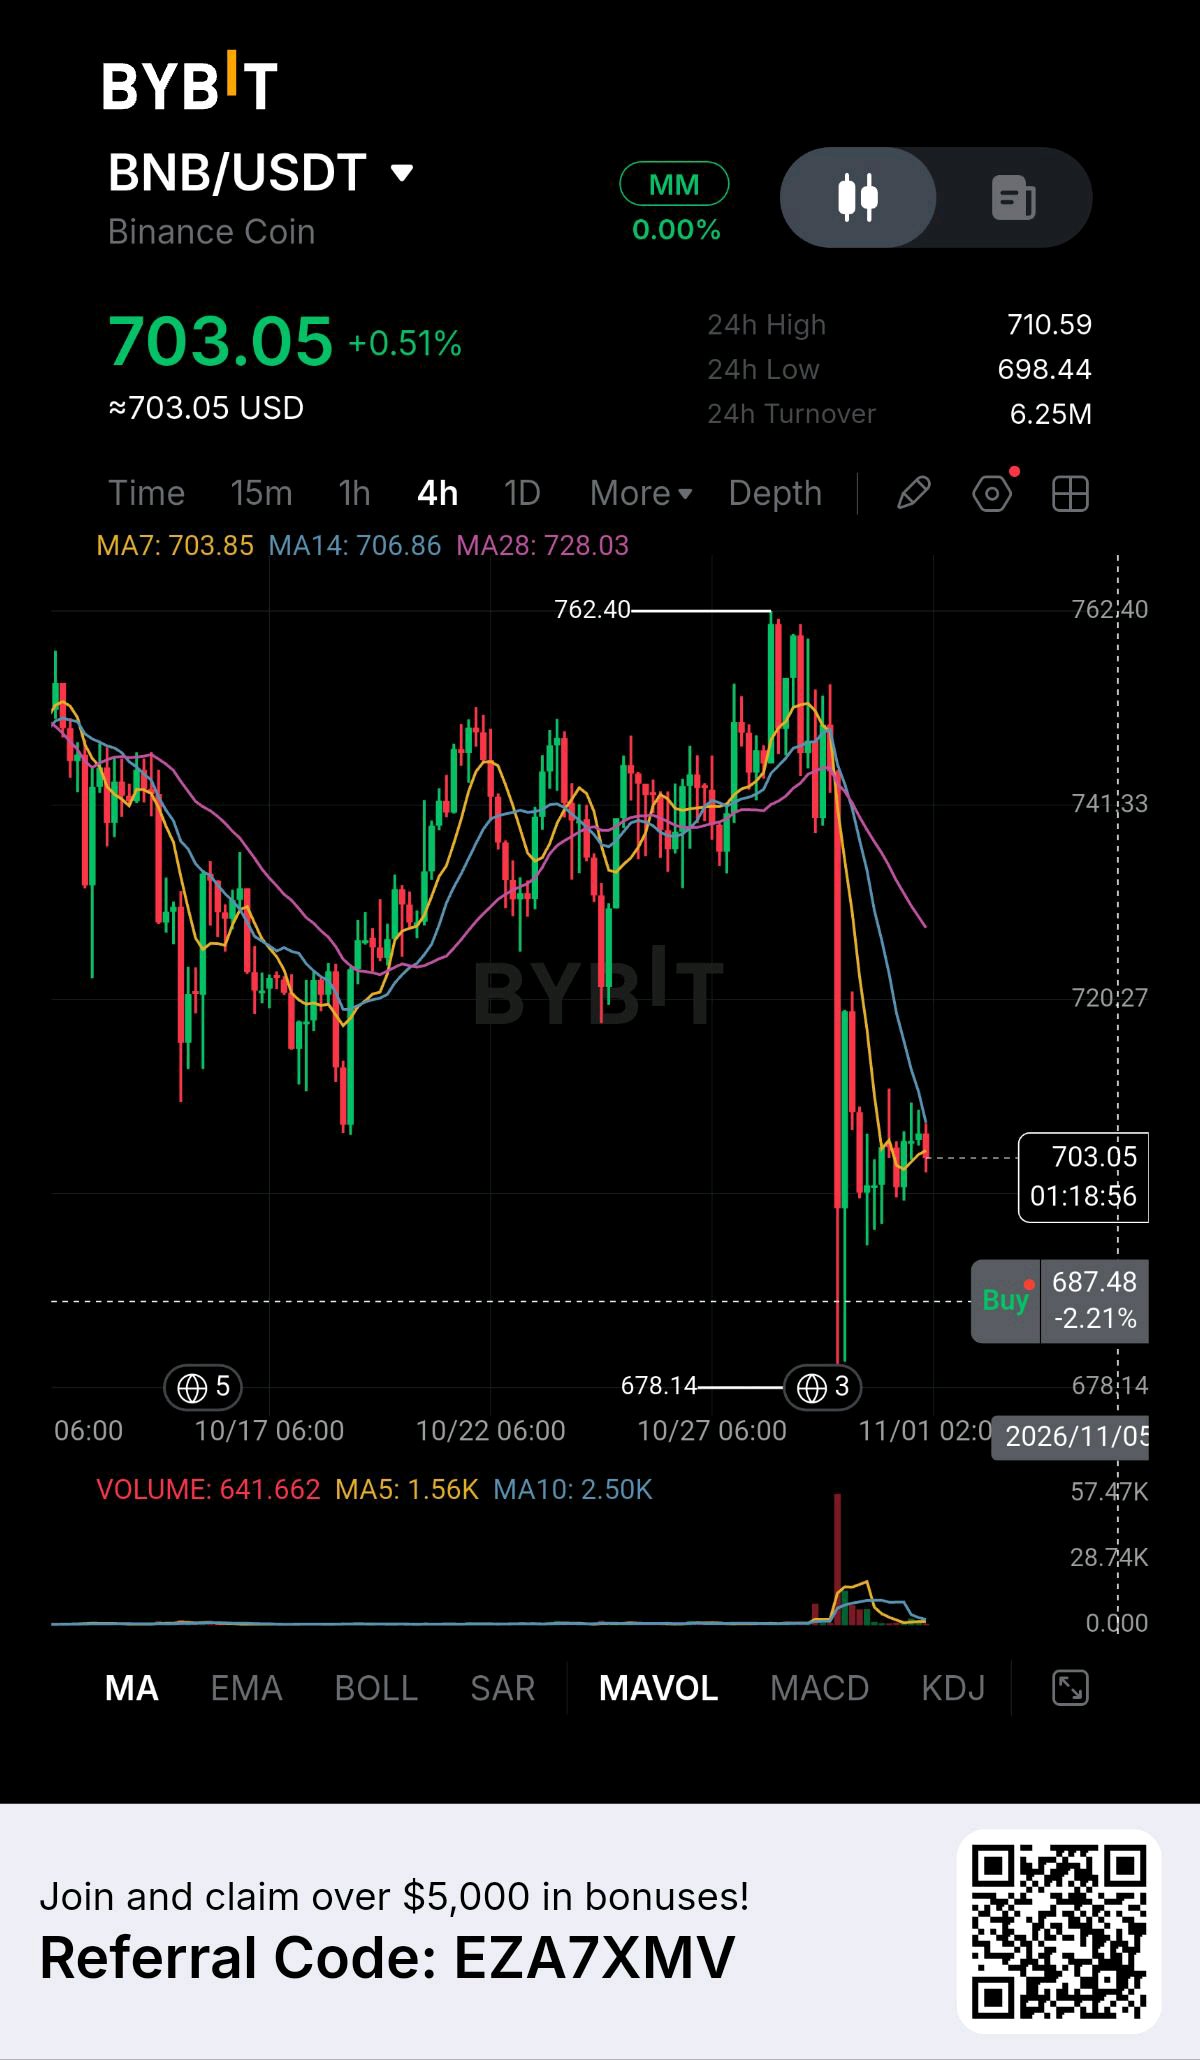
$BNBUSDT is trying to bounce after the biggest shock of the year. The exchange behind this token was hit by a reported $6.3B hack, and BNB flushed from 762.40 down to a wick low of 678.14, about an 11% drop. It has since recovered to 703.32, up 0.54% today, but it’s still about 8% below where it was before the hack. Here’s the key part. The exchange says it has restored backing for about 90% of the stolen assets, and that BNB is fully backed 100%. That doesn’t mean it has recovered 90% from the attacker. The remaining 10% is less liquid tokens outside the top 10, which may take longer to source. So the balance sheet looks repaired, while the chart is still deciding whether to believe it. Turnover The 24-hour turnover is only 6.26M, and the range is tight (698.44 to 710.59). That’s quiet for a coin that just survived a crash. The bounce is happening without heavy flow behind it, so I don’t treat it as confirmed. Volume The crash candle printed a huge volume spike, far above anything else on the chart. That was panic selling. Since then volume has faded: the MA5 (1.56K) sits below the MA10 (2.50K). The current 4h candle is still open, so its reading is incomplete. Buyers are showing up carefully, not aggressively. Moving Averages MA7: 703.89 | MA14: 706.88 | MA28: 728.04 Price (703.32) is sitting just under MA7 and MA14, and well under MA28 (728.04), which is about 3.4% overhead. All three are sloping down. The trend is still down until price gets back above that cluster. Levels to watch · 762.40 — The high before the hack. · 728.04 — MA28, the heavy overhead resistance. · 710.59 — The 24h high. · 706.88 — MA14, the first hurdle to reclaim. · 703.32 — Where we are right now. · 698.44 — The 24h low and the level to hold. · 678.14 — The crash low. Consideration Two dated events decide whether confidence comes back. The exchange says withdrawals are on track to resume Sunday, subject to security checks and final confirmation. A full zero-knowledge proof of reserves is expected Tuesday. If both land cleanly, the fear premium should fade. If either slips, the market will remember the crash fast. The news is improving, but the chart hasn’t confirmed it yet. Trade plan · The Bullish Path: We need a strong 4h close above 710.59 and back over MA14 (706.88) to show a real recovery. If buyers push through, the next stop is MA28 at 728.04. · The Bearish Path: If we lose 698.44, it likely retests the 678.14 crash low. · My take: I’m staying patient. The news flow is improving, but the volume is thin and the MAs are still falling. I want to see 698 hold and a confirmed 4h close above 711 before looking for a long. Support and resistance Support: 698.44 (24h low) → 678.14 (crash low) Resistance: 706.88 (MA14) → 710.59 (24h high) → 728.04 (MA28) Invalidation and risk note This setup is invalidated if we close a 4h candle below 698.44. The biggest risk is a dead-cat bounce: price drifts up on thin volume, then drops back if the withdrawal date or the reserves proof slips. This one is driven by headlines, so it can move fast in either direction. Don’t guess the direction, wait for the break. #ByXIMPACT #MidtermsMarketWatch #NewFinancialPlatform #IMPACTbyTrade $BNBUSDT $BTCUSDT
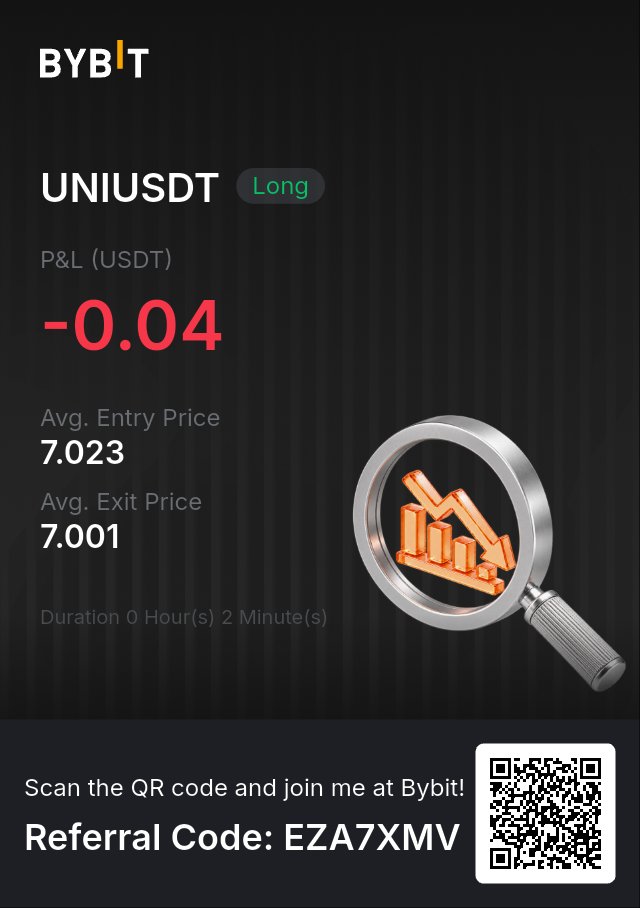
UNI: $44B in monthly volume, yet the token sits under its highs. Does $7.00 hold? My stop hit first. 🛑 Usage is up and the price isn’t. My stop was above the level I wanted to test, so I got no answer. 📊 My trade LONG UNI/USDT 📍 Entry: $7.023 (limit) 🛑 Stop loss: $7.001 (filled at $7.001) ⚙️ Leverage: 10x 📉 P&L: −0.04 USDT (price move −0.31%) 🔍 Why I took it Uniswap v4 handled over $44B in 30-day volume as of Oct 18, and SMBC Nikko is building a trading venue on v4 for Japanese investors. That’s real usage with institutional interest behind it. The token hadn’t followed. UNI pulled back to $7 in early October after a big run, tested $7.26 on Oct 28, then slid to $7.03 a day later. One market summary noted that usage hadn’t turned into price momentum. I don’t think the usage story is wrong, and several of these figures come from secondary sources. The narrower question I wanted answered: with strong usage and price sitting on round-number support, does $7.00 hold? 📐 Key levels 🔹 Support: $7.00 🔹 Recent rejection: $7.26 (Oct 28) 🔹 Resistance above: $8.50, then $10.90 🔹 Entry: $7.023 🔹 Stop: $7.001 ⚠️ Risk Bitcoin was weak and Fear & Greed was near 30, so even a good usage story could be sold with the rest of the market. The $7.26 rejection also showed sellers active above me. Volume on Uniswap also doesn’t force anyone to buy UNI. 🧠 Takeaway My stop sat $0.001 above the level I said I was testing. It triggered at $7.001, which means I was out before price even reached $7.00, and I never learned whether the support held. I also gave the trade almost no room. UNI dropped about 3% in a day ($7.26 to $7.03), and my stop allowed 0.31%. On 1.5 UNI the price move cost roughly 0.033 USDT, with fees making up the remainder. To test a level, the stop belongs below it with space, and the size shrinks to fit. If that size is too small to trade, the trade gets skipped. #ByXIMPACT #BitcoinSlidesBelow$80K #NewFinancialPlatform #MidtermsMarketWatch #IMPACTbyTrade $UNIUSDT $SOLUSDT
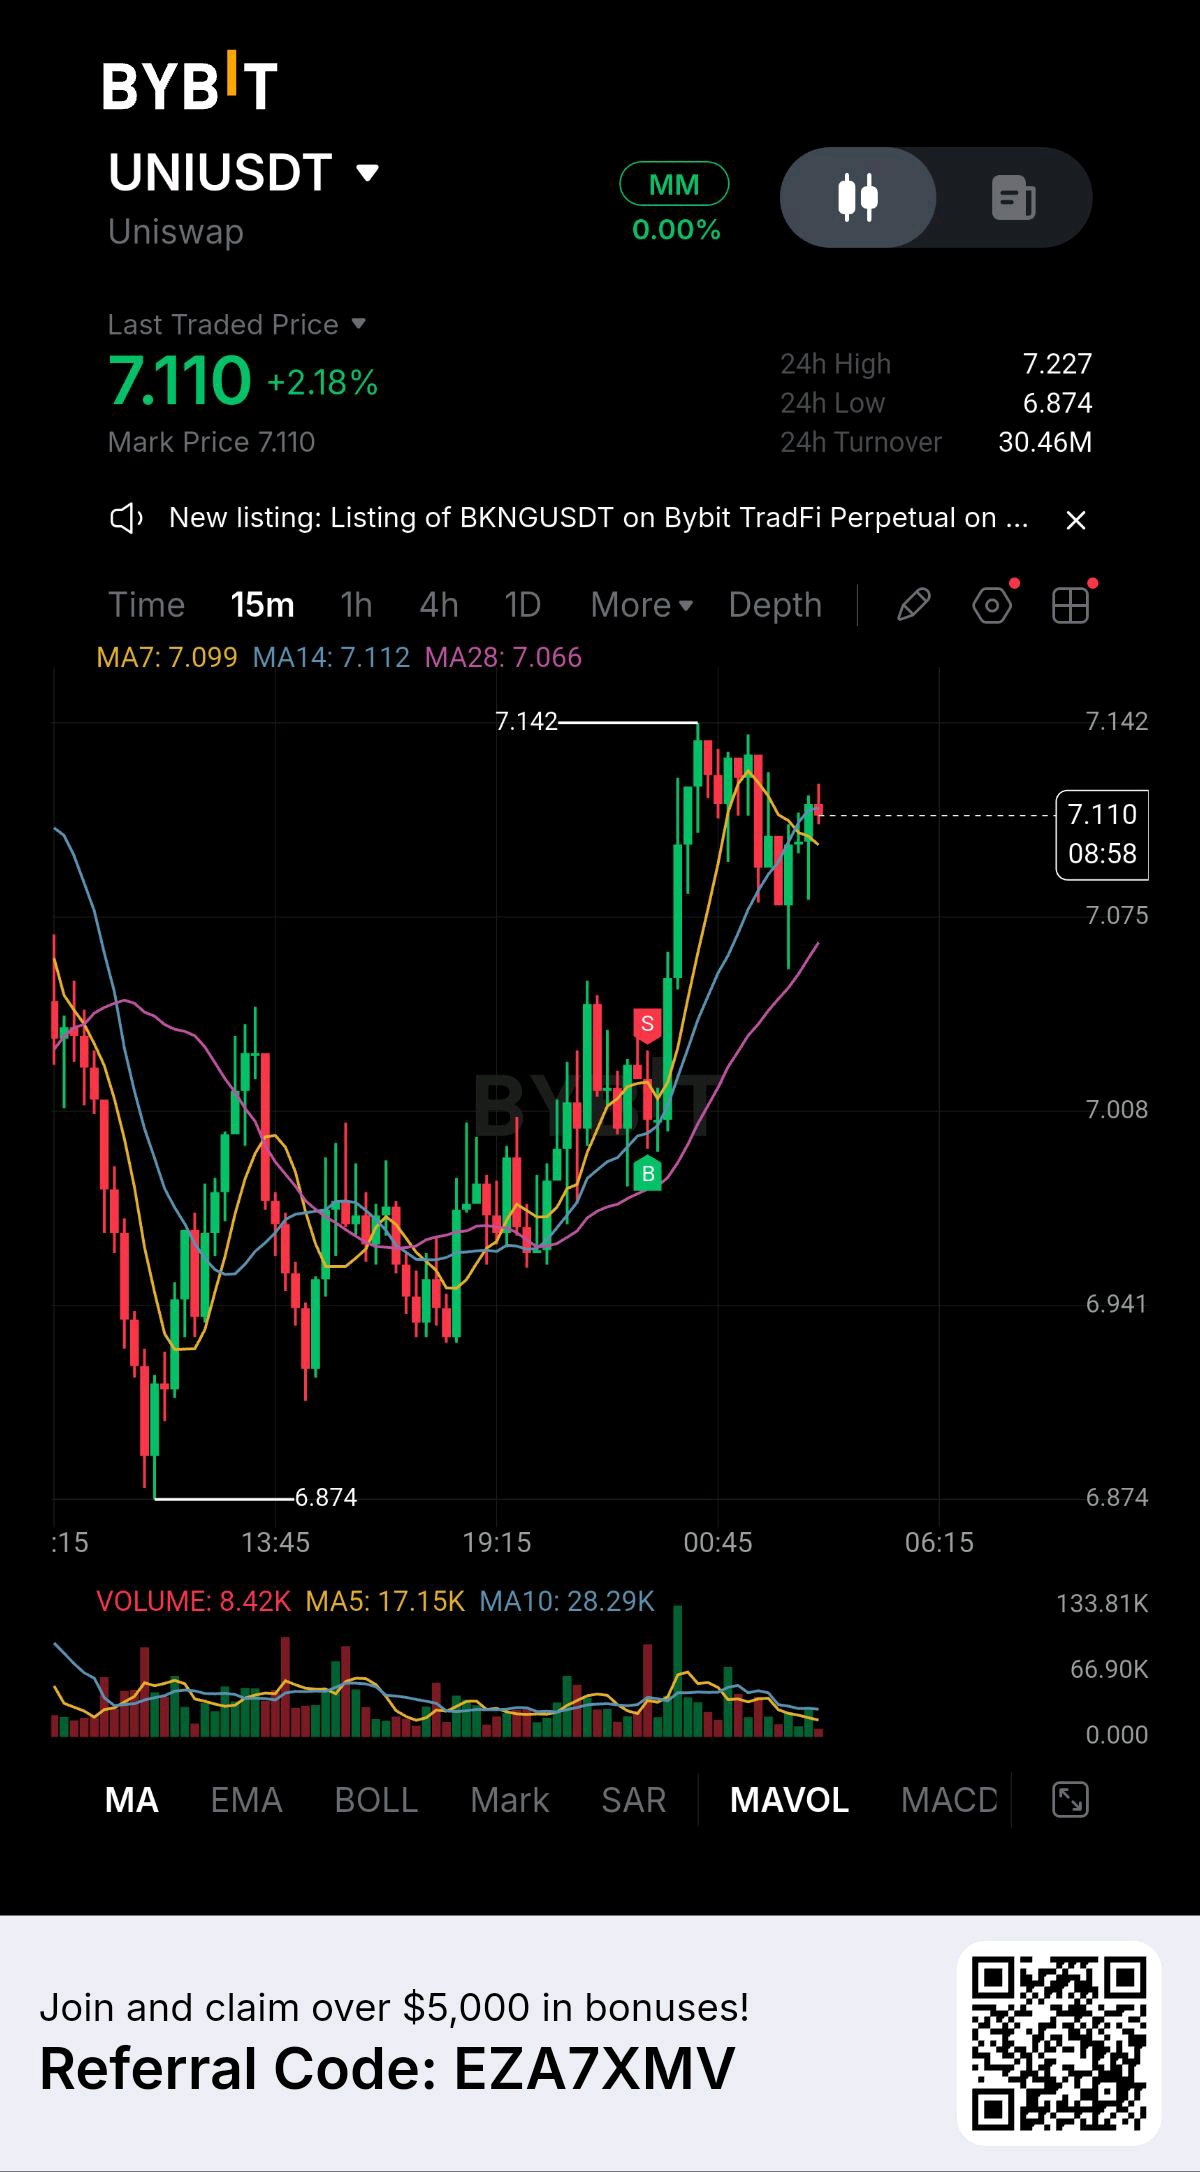
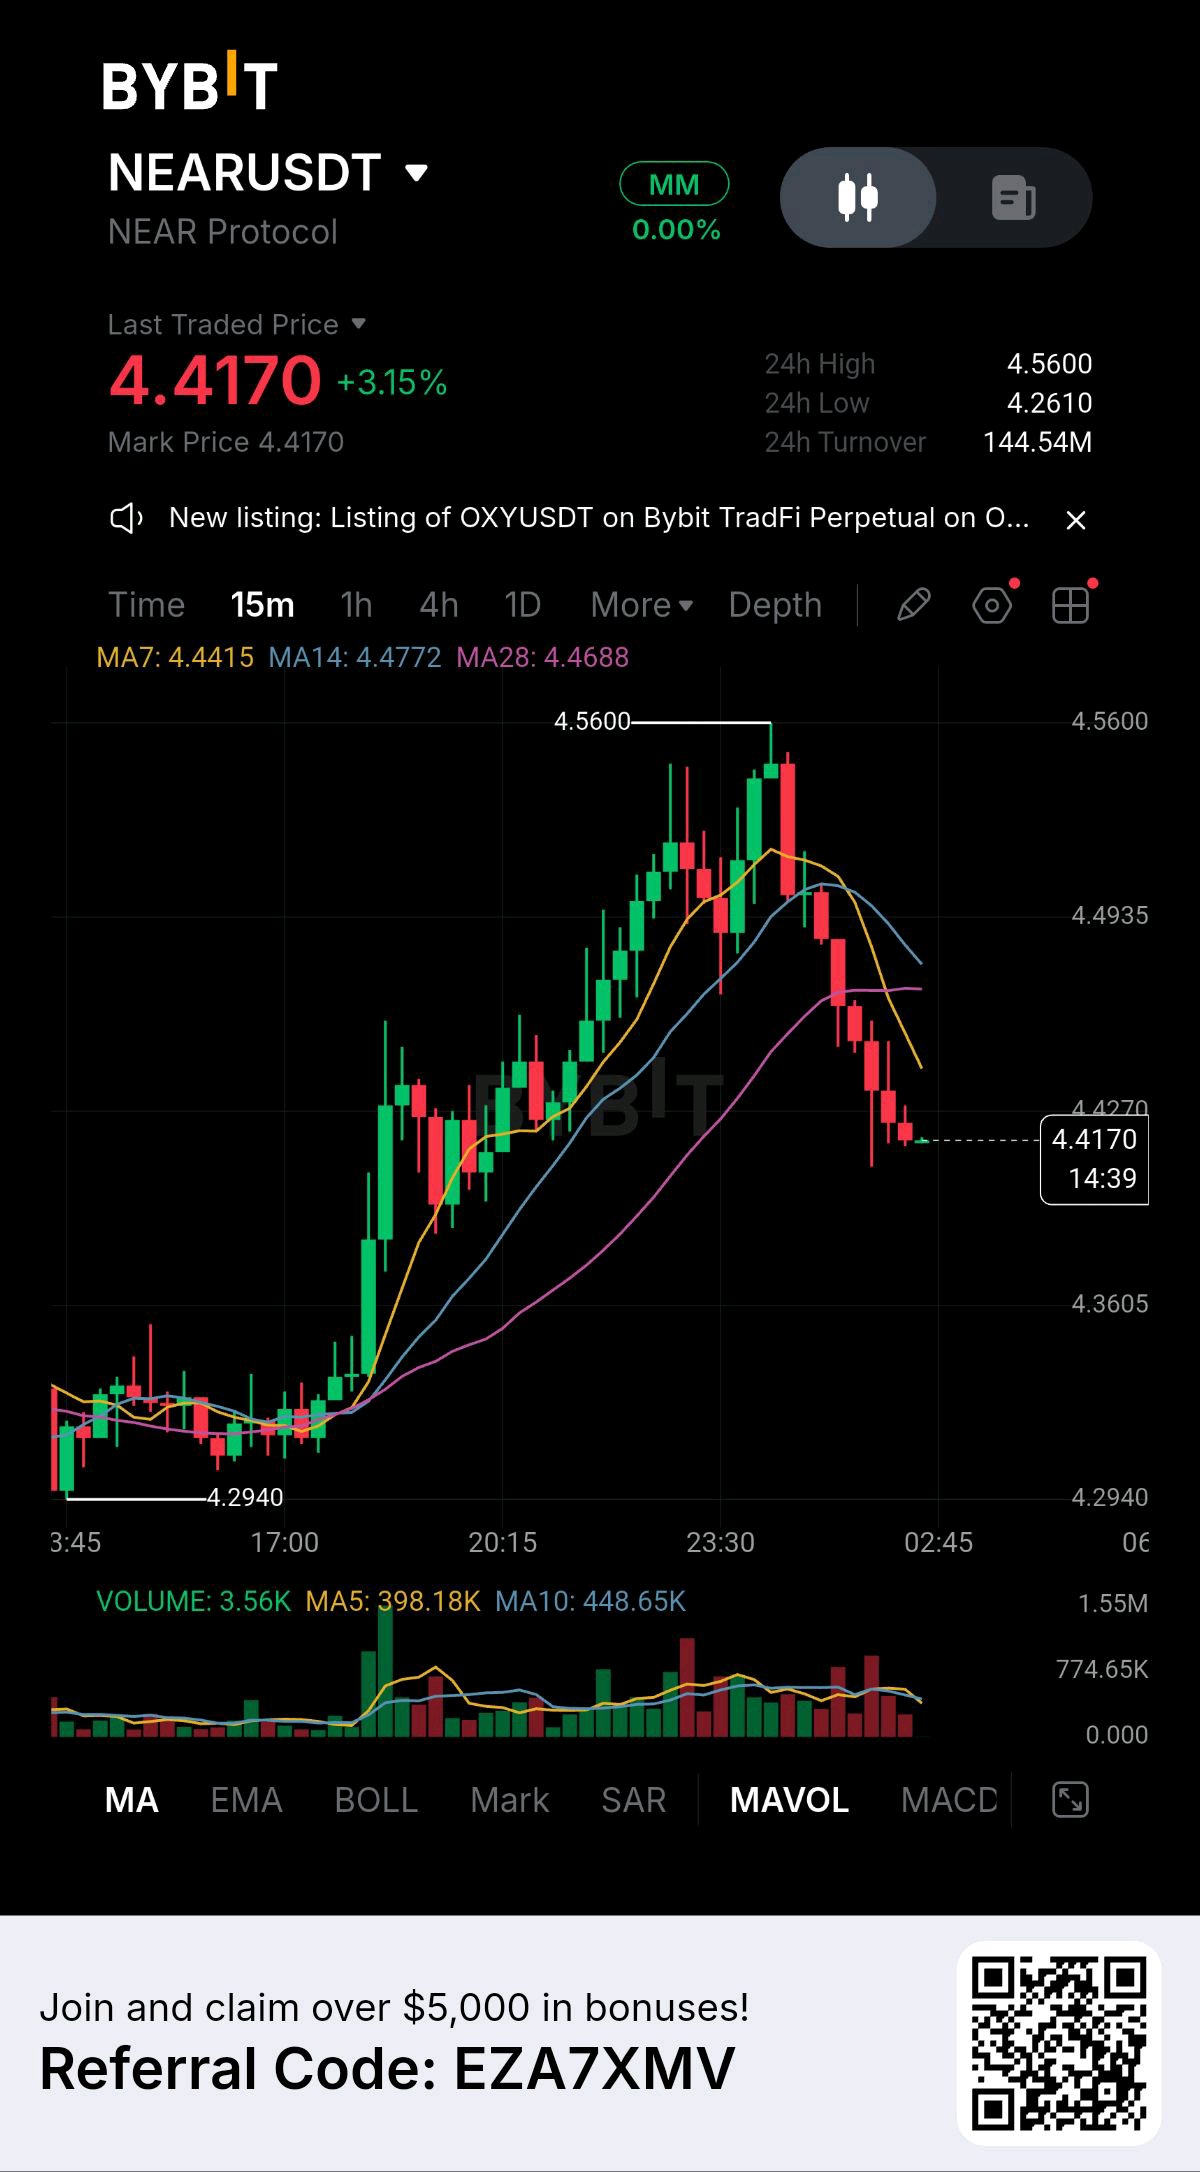
NEAR Protocol: the vote to cut new supply closes November 2. Good for holders, harder on validators. NEAR’s governance body, House of Stake, is voting on proposal HSP-029. It would lower the maximum annual token issuance from 2.5% to 1.6%, a 36% cut. The news Voting opened October 19 and closes November 2. If it passes, a roughly 90-day grace period starts, and then the cap steps down gradually over 24 months. Validators also have to adopt a separate network upgrade, so a yes vote alone changes nothing yet. Market reality NEAR traded around $5.17 on October 21 after a steep run, and CoinStats flagged it as overbought. So part of the optimism may already be in the price. Numbers that matter Issuance cap: 2.5% to 1.6%, stepping down about 3.75 basis points per month Staking yield: from about 5.27% to 3.37% Avoided issuance: about 11.8 million NEAR over two years and 66.1 million over six, roughly 4.36% less supply Reward split stays the same: 90% to stakers, 10% to the treasury Bull case Fewer new tokens means less dilution for everyone holding NEAR. The proposal says 58.7% of NEAR is not staked. Those holders earn no rewards but still absorb every new token, so they gain the most. The number I keep coming back to is that 58.7%. The wider direction is also healthy: paying for network security from product revenue instead of printing more tokens. Risks However, lower issuance means lower rewards. Validators without their own NEAR could lose about 36% of their commission revenue. Meanwhile, avoided issuance is not a buyback or a burn. It slows supply growth but does not create demand. Governance is the other weak spot. Last October the team cut issuance from 5% to about 2.5% even though the community vote failed to reach the 66.67% threshold, and some validators criticized it. This time I checked who wrote the proposal first. It came from the CEO of SVRN, which holds about 55 million NEAR, mostly staked, and plans to vote yes. That is disclosed openly, but it is worth knowing. Bottom line On paper, lower inflation helps the token. But supply is only half of a price. What matters next is the final vote, whether validators adopt the upgrade, and whether new buyers show up. Does a smaller supply matter if nobody new is buying? #ByXIMPACT #NewFinancialPlatform #BitcoinSlidesBelow$80K #MidtermsMarketWatch #IMPACTbyTrade $NEARUSDT
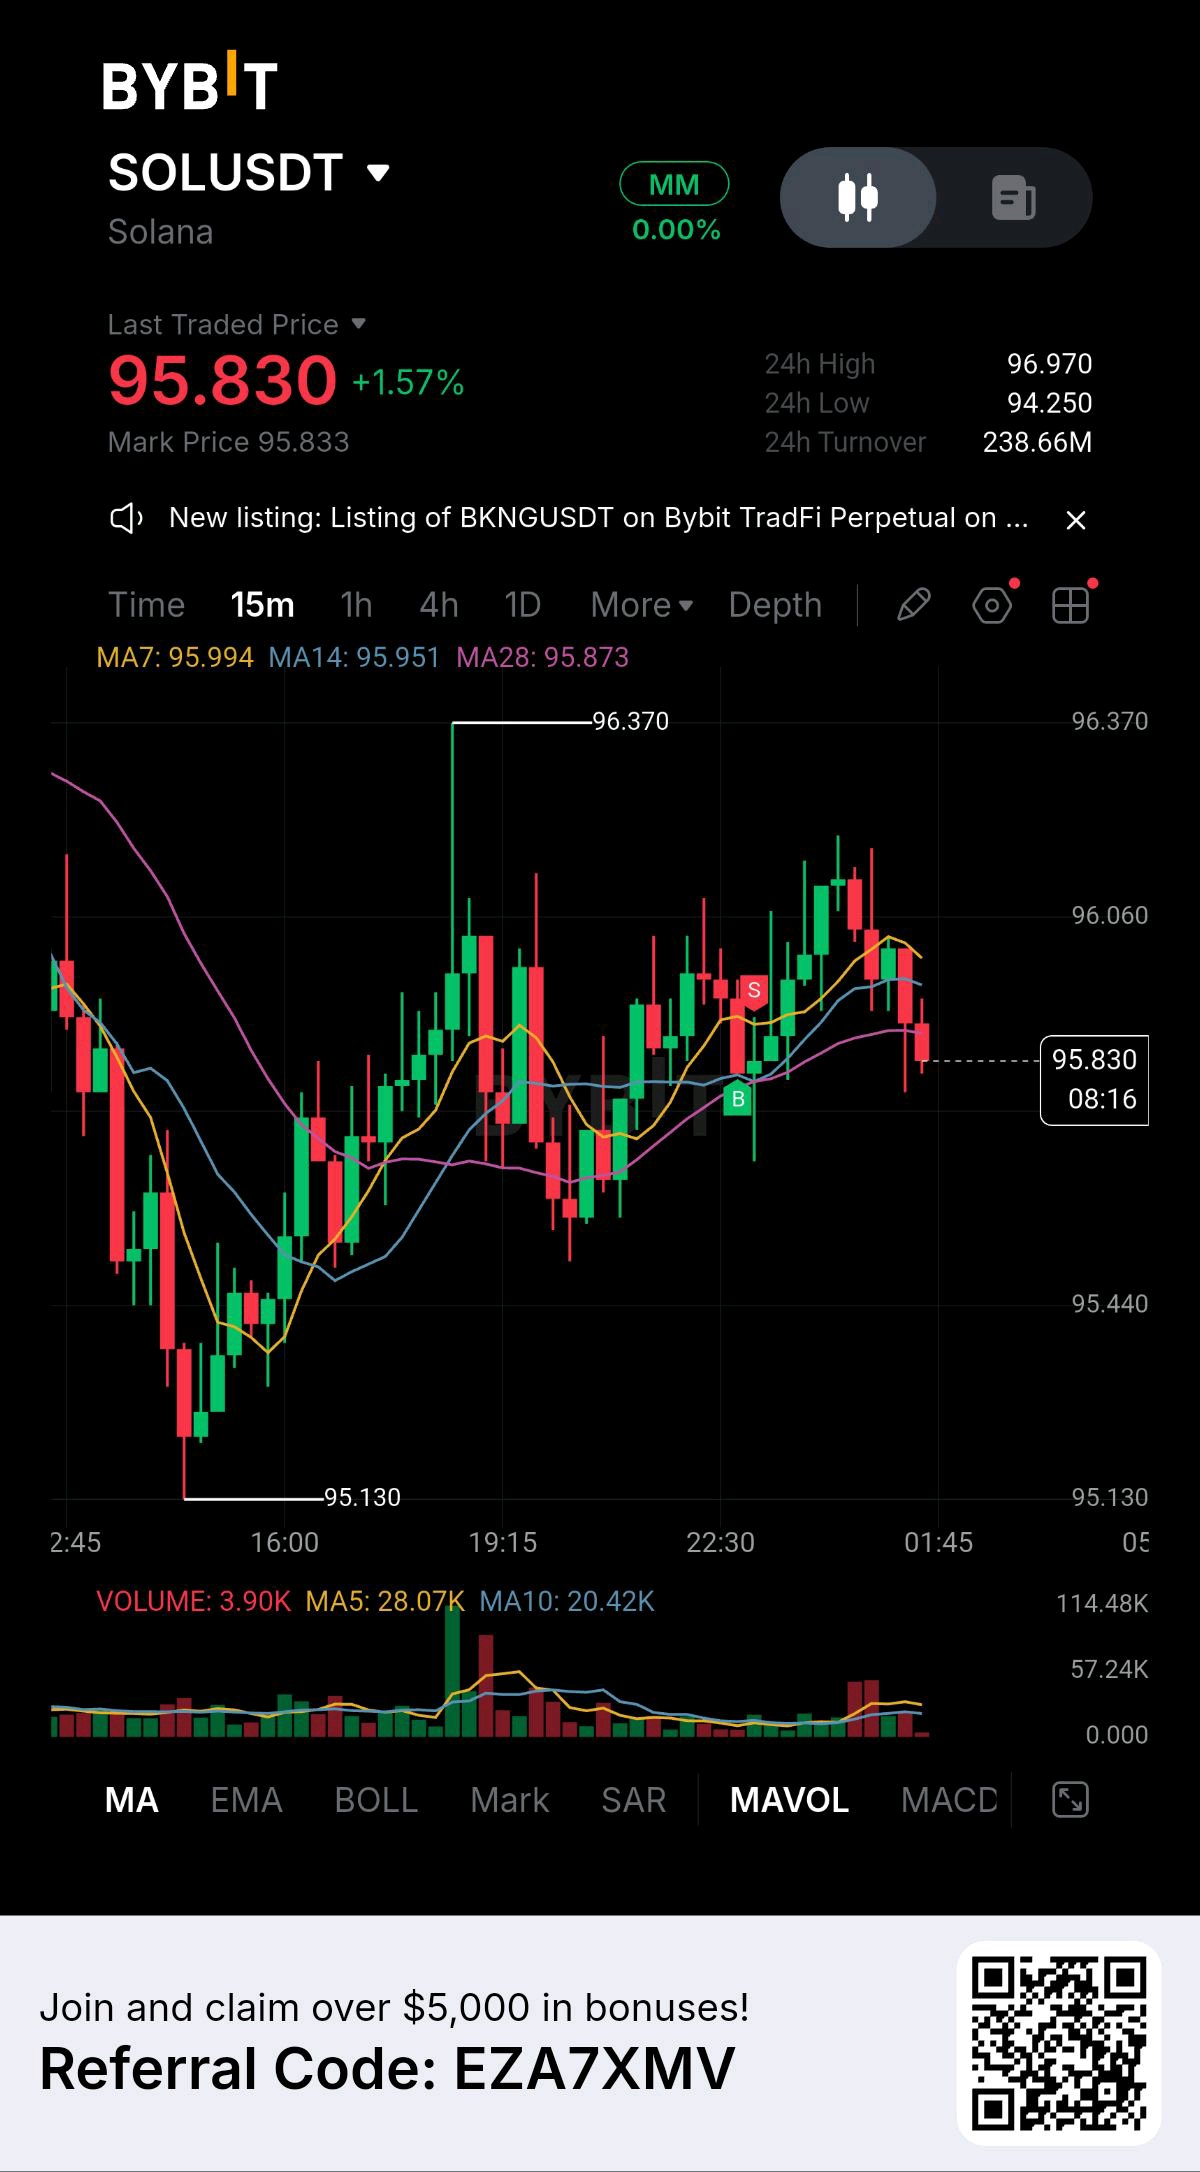
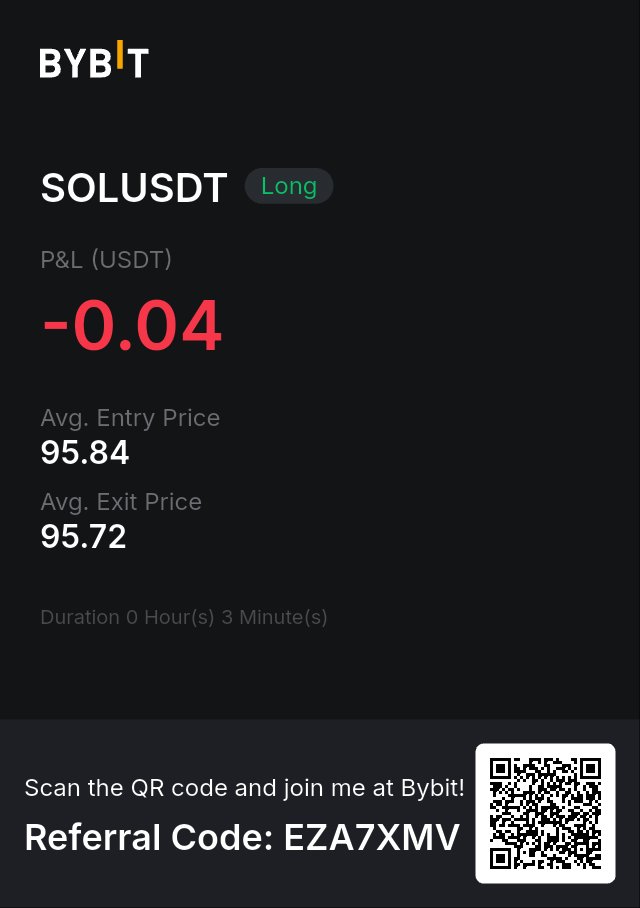
SOL: record tokenized assets on-chain, ETFs leaving, longs crowded. I tested which way it breaks. Stop hit. 🛑 📊 My trade LONG SOL/USDT 📍 Entry: $95.84 (limit) 🛑 Stop loss: $95.72 (filled at $95.72) ⚙️ Leverage: 25x 📉 P&L: −0.04 USDT (price move −0.13%) 🔍 Why I took it On Oct 29, Solana flagged a record $5.19B of tokenized assets on its chain. The same day SOL closed at $95.47, its lowest close in a month, and spot SOL ETFs lost $27.69M, the biggest exit since Sept 30. A whale also sold about 1.02M SOL over five days. Positioning was the odd part. On OKX there were 3.38 long accounts for every short, the widest in two weeks, while open interest barely moved ($377M to $371M). I’m not saying the crowd was right or wrong, and it’s one venue. What interested me was a narrower question: is a crowded long into a weak price a squeeze setup or a flush setup? 📐 Key levels 🔹 Below $92.64, the long side thins out 🔹 Hurdle above: $104 to $105 🔹 My stop: $95.72, just under entry ⚠️ Risk Bitcoin was near a six-week low and Fear & Greed was around 30. A record on-chain number can still get sold with everything else. A crowded long can also be fuel for a flush, and the data didn’t say which one this was. 🧠 Takeaway My stop was 0.13% from entry, but the level that would have proven the idea wrong was $92.64, about 3.3% away. On 0.2 SOL, that’s a risk of 0.024 USDT at my stop against 0.64 USDT at the real level, roughly 27 times more. So the 0.04 USDT loss doesn’t tell me the idea was wrong. A stop that tight can’t tell me that. It only showed that price ticked down, and fees took a share of the loss too. The small loss looks disciplined, but I didn’t test the thesis. Next time, the stop goes where the idea fails, and the size is set from that distance. If that size is too small to be worth trading, I skip the trade. Stop loss triggered, scenario closed. #ByXIMPACT #BitcoinSlidesBelow$80K #NewFinancialPlatform #MidtermsMarketWatch #IMPACTbyTrade $SOLUSDT $BTCUSDT
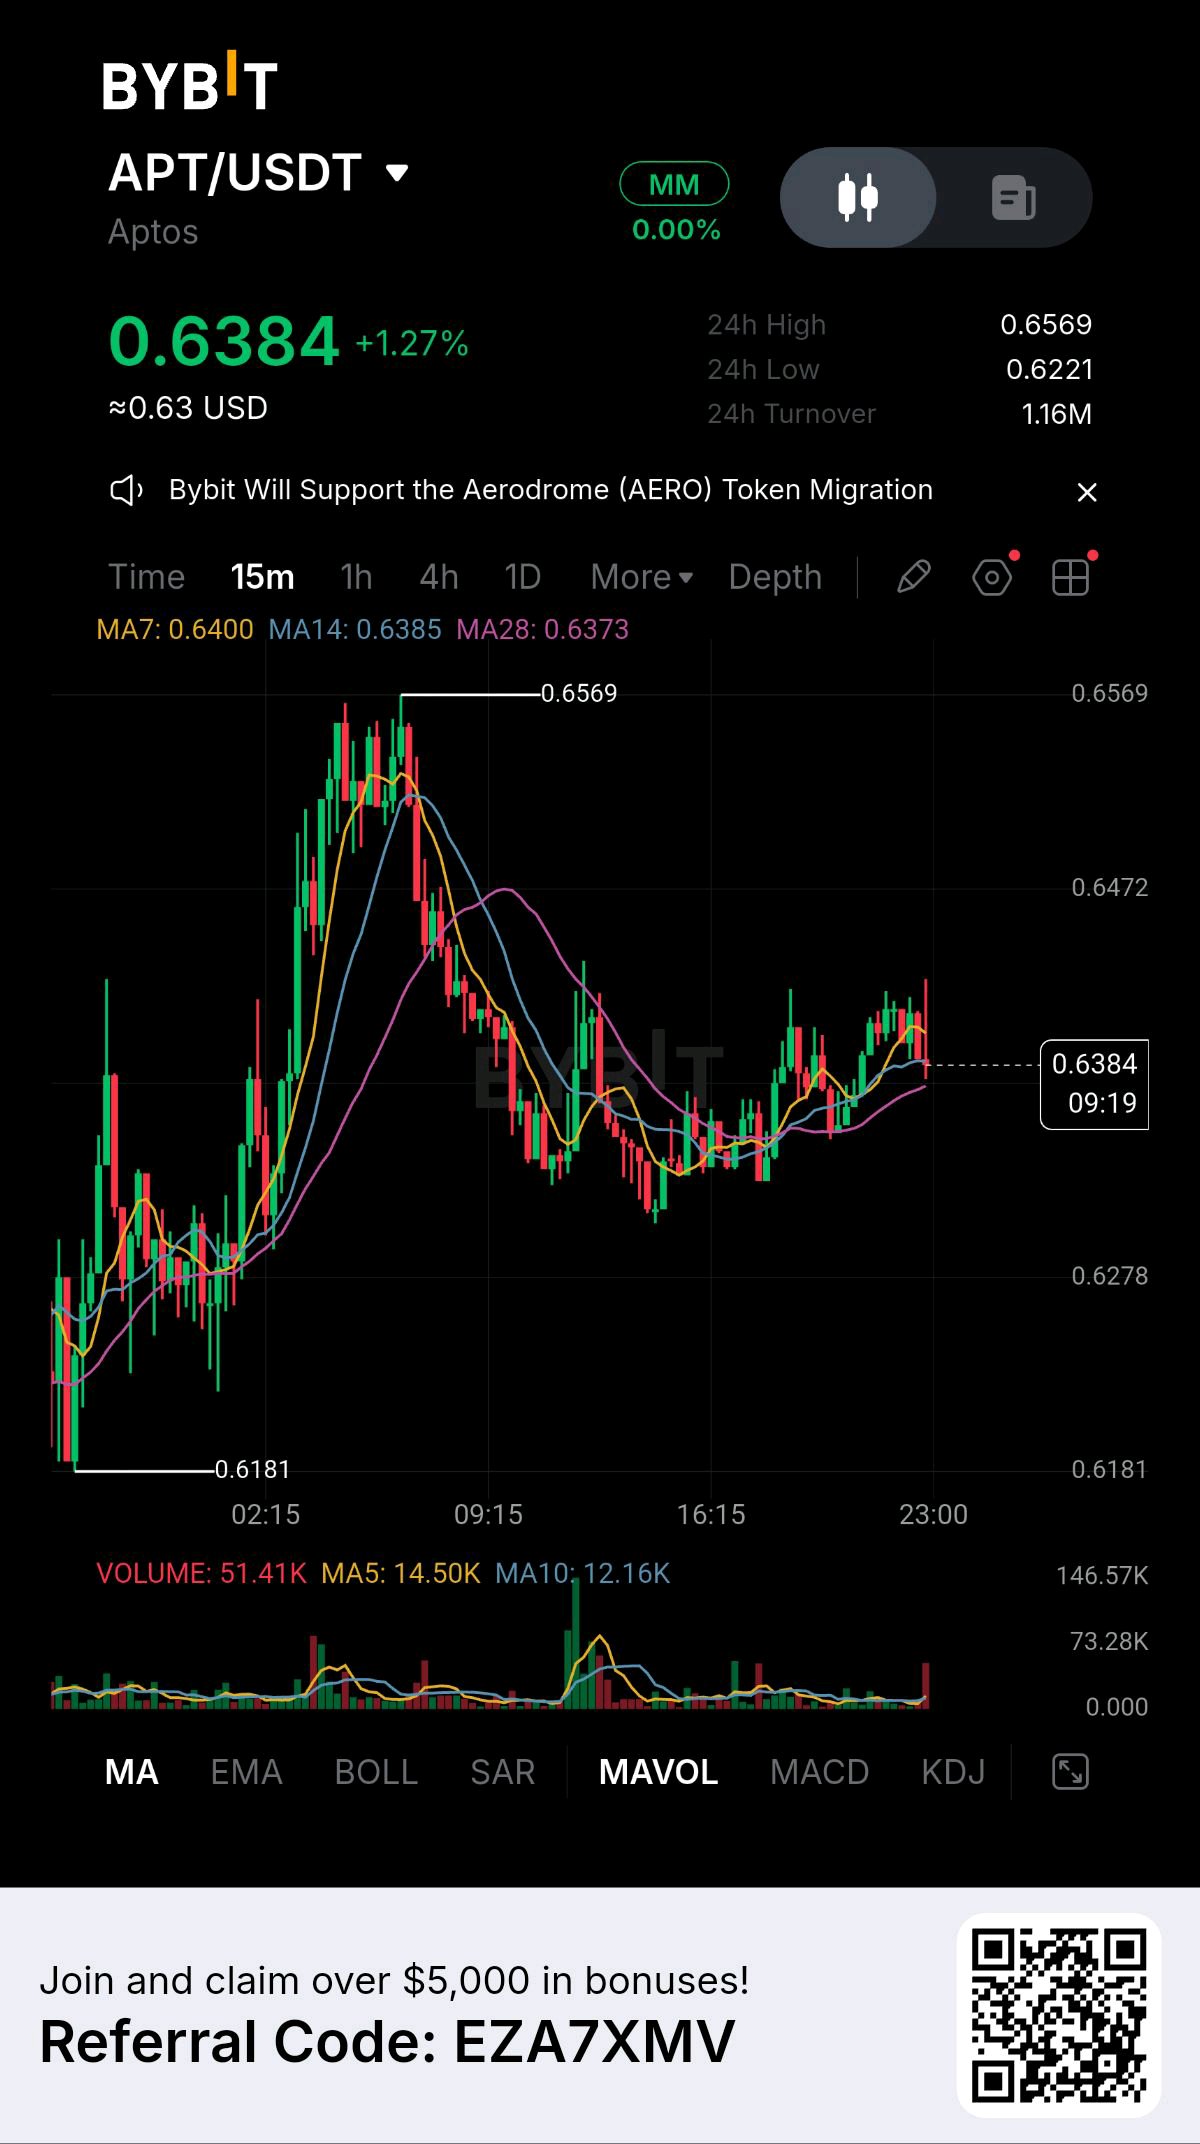
APT: the unlock schedule ended on Oct 12, the exact thing bulls wanted, and the chart still looks broken. 👀 I’ve been looking at Aptos this week and the story doesn’t add up. The four-year vesting for core contributors and early investors finished in October, but APT slid from the $0.80s to around $0.60 and sits under every major moving average. 📊 Why APT is on my screen 🔹 Supply news is done. The schedule ended on Oct 11 to 12. Monthly scheduled releases fell from about 11.31M APT to about 4.54M, roughly 60% lower. That was supposed to be the bullish reset. 🔹 The market shrugged. APT bounced about 6% when this was priced in around Oct 20, then gave it all back. It traded at $0.63 on Binance on Oct 31, under its 7-, 20-, 50- and 200-day averages at once. 🔹 Emissions still matter. One summary from Oct 18 noted that token burn is lagging staking emissions, so new supply keeps coming from staking, not from unlocks. 🔹 Positioning. One report showed open interest up about 20% as price tested the lower Bollinger band. That suggests new positions are leaning on the move. 🔹 Roadmap items like Shelby storage and Raptr consensus are real, but none has a hard date I could confirm. APT is also about 97% below its $20.39 all-time high. 🎯 Levels I’m watching $0.84 to $0.90: mid-October resistance zone $0.76 to $0.78: old support, now resistance $0.69: where APT traded on Oct 28 $0.60: round-number support, the level I’d defend How I’d play it: No long until APT reclaims $0.69 to $0.70 and then $0.78. Nothing below that is a recovery. SHORT only if $0.60 breaks and price can’t climb back over it. In between, I stay out. The supply catalyst is used up, so what’s left is demand, and I don’t see it yet. The unlock overhang is gone, and APT still sits under every moving average. Was “supply is done” the last bullish story Aptos had? #ByXIMPACT #NewFinancialPlatform #MidtermsMarketWatch #IMPACTbyTrade $APTUSDT $BTCUSDT
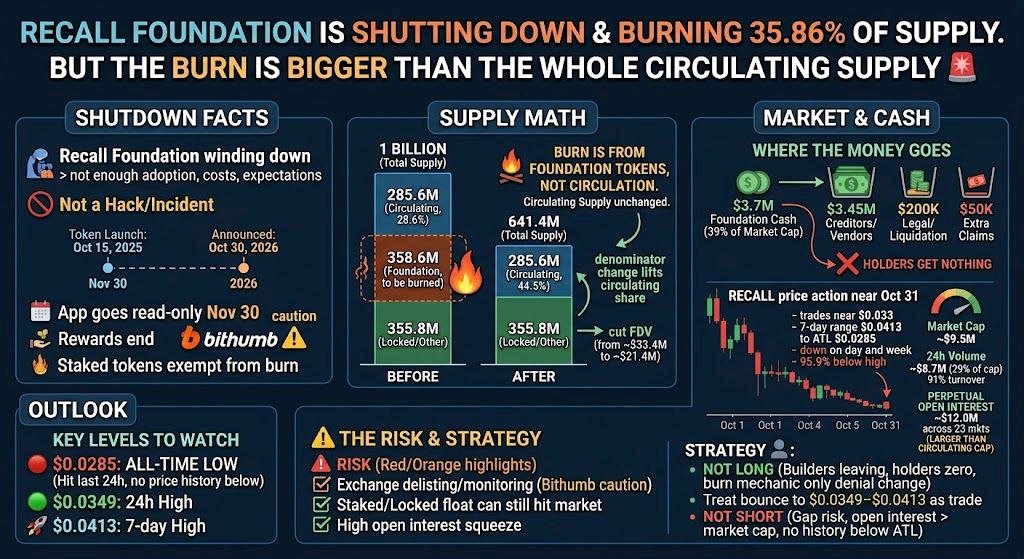
RECALL FOUNDATION IS SHUTTING DOWN AND BURNING 35.86% OF SUPPLY. BUT THE BURN IS BIGGER THAN THE WHOLE CIRCULATING SUPPLY 🚨 On October 30, the Recall Foundation announced it is winding down. Recall built infrastructure for ranking AI agents through on-chain competitions, and its token launched on October 15, 2025. The foundation said protocol adoption, operating costs and growth expectations were not enough to keep going, and that this was not a hack or security incident. 📋 WHAT WAS ANNOUNCED 🔹 About 358.6M RECALL held by the foundation will be burned, 35.86% of the 1 billion supply, leaving about 641.4M. TokenPost reports the burn is expected in Q1 2027, just before the final liquidation. 🔹 No buyback and no payout to holders. The foundation has about $3.7M in cash: $3.45M goes to creditors and vendors, $200K to legal, security and liquidation costs, and $50K is held for extra claims. 🔹 On November 30 the app goes read-only, competitions and rewards end, and tokens can still be claimed through on-chain contracts. 🔹 Staked tokens are excluded from the burn, and Bithumb flagged RECALL as a trading caution item the same day. 🔍 THE NUMBER THAT STOPPED ME A 35.86% burn sounds like scarcity. But CoinGecko lists circulating supply at about 285.6M, only 28.6% of the total, and the burn is 358.6M. It is bigger than everything that is currently trading, so it cannot be coming out of circulation. These are tokens the foundation held, not tokens in anyone’s wallet. By my math, circulating supply stays near 285.6M while total supply falls to 641.4M. That lifts the circulating share from 28.6% to about 44.5% and cuts fully diluted value from about $33.4M to about $21.4M at today’s price. Nothing leaves the market. The headline changes the denominator. None of this means the burn is meaningless. A foundation that is closing has no reason to sell into the market, and removing its allocation clears one source of future supply. What stands out to me is that burns usually mean someone is removing supply to help holders, and this one is the cleanup after a shutdown. Meanwhile the reports on the announcement don’t say what happens to the roughly 356 million tokens that are neither burned nor circulating. 💸 WHERE THE MONEY GOES The foundation’s $3.7M is about 39% of RECALL’s market cap, and holders have no claim on any of it. It all goes to creditors, vendors and costs. 📊 WHAT THE MARKET IS DOING As of this morning RECALL trades near $0.033 on CoinGecko, down 3.2% on the day and 8.8% on the week, and 95.9% below its $0.8211 high. It hit a new all-time low of $0.0285 in the last 24 hours, and the seven-day range runs from $0.0413 down to that low. Market cap is about $9.5M, and about $8.7M traded in 24 hours, up 29%, so roughly 91% of the market cap changed hands in a day. Meanwhile perpetual futures open interest is $12.0M across 23 markets, larger than the entire circulating market cap. Bybit is CoinGecko’s top spot venue by volume at about $1.1M in 24 hours. 🎯 KEY LEVELS TO WATCH 🔴 $0.0285: the all-time low, hit in the last 24 hours. Below it there is no price history to lean on. 🟢 $0.0349: the 24-hour high. 🚀 $0.0413: the seven-day high. These are reference levels from October 31 data, so check them against your live chart. ⚠️ THE RISK Whether RECALL stays listed is decided by each exchange, and Bithumb has already flagged it. A delisting or monitoring tag on a big venue would cut liquidity further. Staked tokens are exempt from the burn and can still be withdrawn from the contract once their lockups end, so more of the locked float can reach the market. And with open interest above market cap, a squeeze can come in either direction. 💎 MY STRATEGY I’m not long. The builders are leaving, holders get nothing, and the only catalyst is burn mechanics that don’t touch what is trading. I’d treat any bounce toward $0.0349–$0.0413 as a trade, not a recovery. I’m also not shorting a market where open interest is bigger than market cap and the chart has no history under $0.0285, because it can gap both ways. #ByXIMPACT #IMPACTbyTrade $RECALLUSDT $BTCUSDT
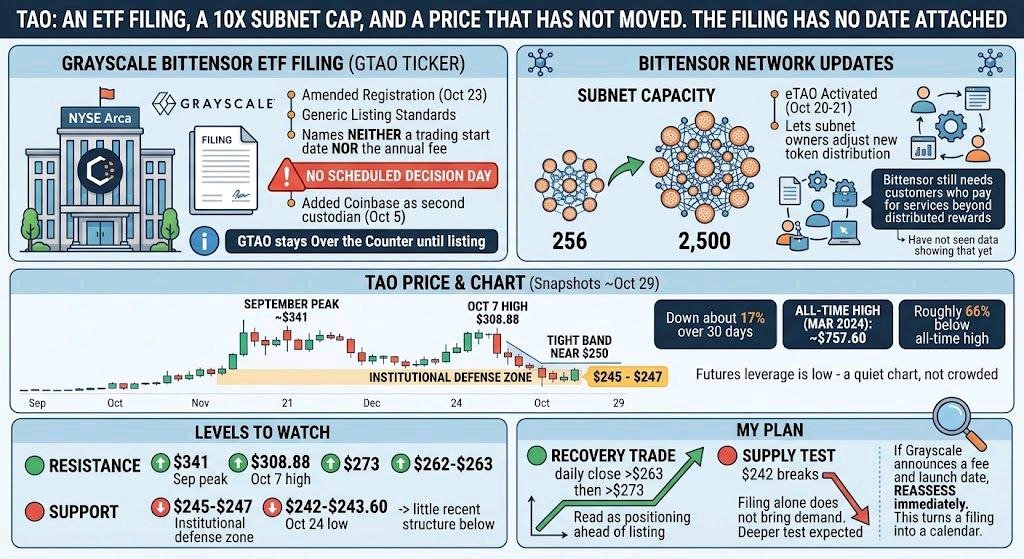
TAO: AN ETF FILING, A 10X SUBNET CAP, AND A PRICE THAT HAS NOT MOVED. THE FILING HAS NO DATE ATTACHED TAO closed Oct 29 at about $253, almost exactly where it was a week earlier. In that week, Grayscale filed an amended registration to convert its Bittensor Trust into an ETF, and the network lifted its subnet cap. The market did not react. I looked at why, and at what would change that. THE FILING Grayscale filed an amended registration statement on Oct 23 to turn the Grayscale Bittensor Trust into the Grayscale Bittensor ETF, with the GTAO ticker, listing on NYSE Arca. The filing identifies NYSE Arca’s generic listing standards for commodity-based trust shares as the route. That suggests a bespoke rule change is not required. It also names neither a trading start date nor the annual fee. So there is no scheduled decision day to trade. The things to watch are the filing becoming effective, a fee and a launch date, and Grayscale’s 8-K disclosures. Grayscale also added Coinbase as a second custodian, alongside BitGo, in an 8-K on Oct 5. Until the ETF lists, GTAO stays over the counter. THE NETWORK SIDE Bittensor activated eTAO on Oct 20 and 21, which lets subnet owners adjust how newly issued alpha tokens are split between owners, validators and miners. Mid-October’s Null Consensus release lifted subnet capacity from 256 to 2,500. Both are real changes. But one analysis still notes that Bittensor needs customers who pay for network services beyond the rewards it distributes, and I have not seen data showing that yet. THE PRICE TAO is down about 17% over 30 days. It touched a weekly high of $308.88 on Oct 7 and has been trading in a tight band near $250 since, above what one report calls an institutional defense zone of $245 to $247. Futures leverage is described as low, so this is a quiet chart, not a crowded one. Its all-time high from March 2024 was about $757.60, so TAO sits roughly 66% below that. THE LEVELS Support: $245 to $247, then $242 to $243.60, where the Oct 24 low sits. Below it, there is little recent structure. Resistance: $262 to $263, then $273. Larger levels: $308.88, the Oct 7 high, and about $341, the late-September peak. THE PLAN An ETF with no date is a slow catalyst, and the price is treating it that way. I want a daily close above $263 and then $273 before I read this as positioning ahead of a listing. If $242 breaks, the market is saying a filing alone does not bring demand, and I would expect a deeper test. If Grayscale announces a fee and launch date, I would reassess right away, because that turns a filing into a calendar. #ByXIMPACT #WSOT2026 #BlockchainSecurity #BybitStocks #IMPACTbyTrade $SOLUSDT $BTCUSDT
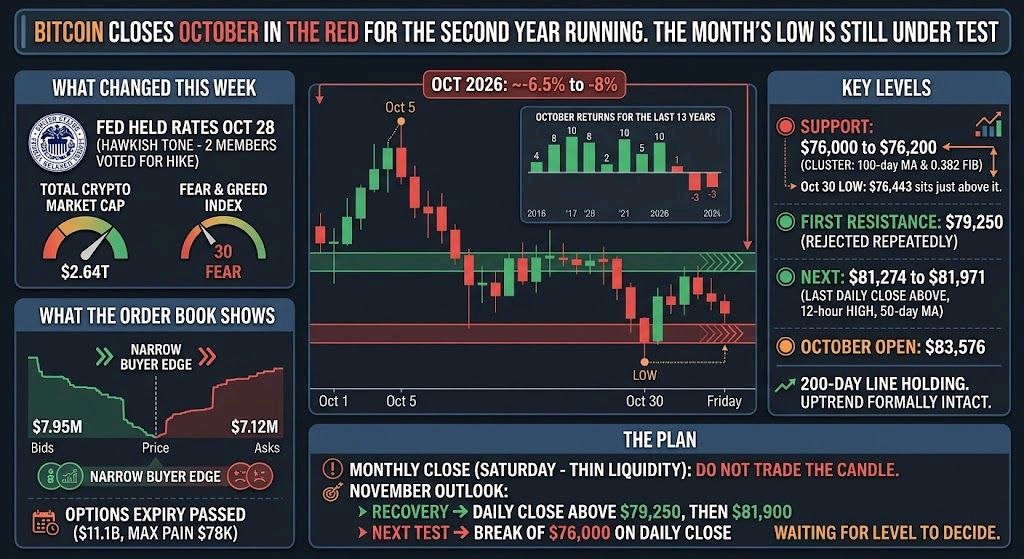
BITCOIN CLOSES OCTOBER IN THE RED FOR THE SECOND YEAR RUNNING. THE MONTH’S LOW IS STILL UNDER TEST Bitcoin opened October at $83,576, peaked at $86,490 on Oct 5, and fell to about $76,443 on Oct 30. That was its lowest daily close since Sept 18. It recovered to about $78,475 on Friday, which still leaves the month down roughly 6.5% to 8%, depending on the source and the hour. October has been Bitcoin’s strongest month historically, and this is the second negative one in a row. WHAT CHANGED THIS WEEK The Fed held rates on Oct 28 with two members voting for a hike, and the market read the tone as hawkish. BTC rebounded briefly after the announcement, then sold off. Total crypto market cap fell to about $2.64T, and the Fear and Greed index dropped to 30. The seasonal case did not show up this year. October has been positive in 10 of the last 13 years, with an average gain near 18% in one count, but that is a small sample, and 2026 has not followed it. WHAT THE ORDER BOOK SHOWS On Oct 30, bids near $78,196 totaled about $7.95M against about $7.12M of sell orders near $78,810. That is a narrow edge for buyers, and a narrow edge is not a trend. The options expiry that same morning, with $11.1B at an estimated max-pain level of $78,000, has also passed, so the price is no longer being pulled toward a single level. THE LEVELS Support: $76,000 to $76,200. This is where the 100-day moving average and the 0.382 Fibonacci retracement cluster. The Oct 30 low of $76,443 sits just above it. A daily close below $76,443 would put the September low in play. First resistance: $79,250. BTC has been rejected below it repeatedly. Next: $81,274 to $81,971, which holds the last daily close above and the 12-hour high, with the 50-day average near $81,920. October open: $83,576. A monthly close back above it would erase the loss, and nothing in the current structure suggests that is close. The 200-day line is still holding, so the broader uptrend is formally intact even with a losing month. THE PLAN Tonight’s monthly close lands on a Saturday, with thin liquidity, so I would not trade the candle itself. For November, I want a daily close above $79,250 first, then $81,900. Both would turn the bounce into a recovery. If $76,000 breaks on a daily close, the next test is lower, and I would not try to catch it. I am not predicting a bottom. I am waiting for the level to decide. #ByXIMPACT #BybitStocks #IMPACTbyTrade #WSOT2026 #BlockchainSecurity $BTCUSDT $SOLUSDT