Asmauhusnah
Crypto Learner | Web3 Enthusiast Sharing market insights, ideas & opportunities Building. Learning. Growing. 🚀 Let’s grow together on ByX.
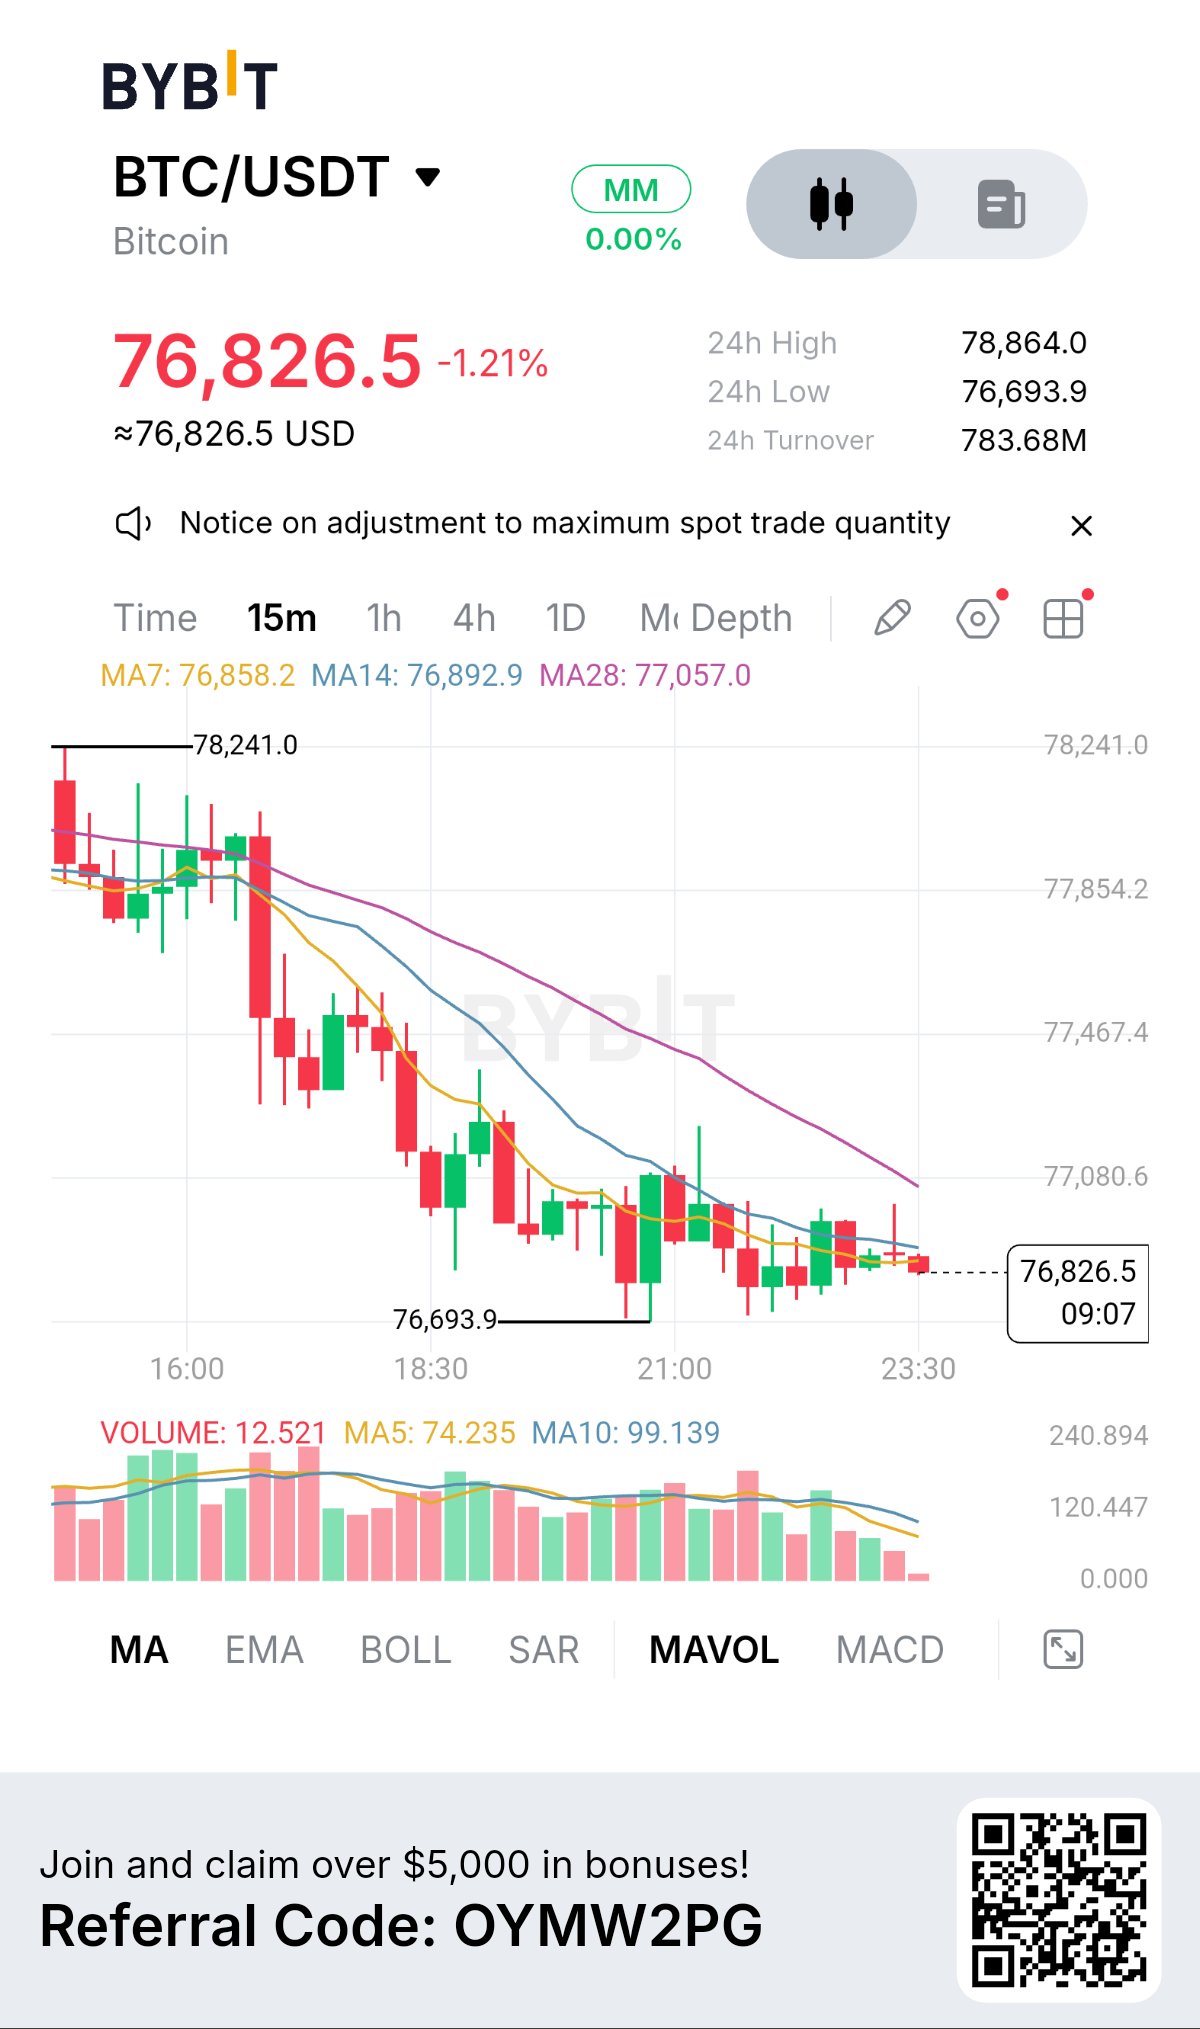
Bitcoin is approaching a decisive support zone, and the latest 15-minute price action shows little evidence of a confirmed recovery. The Market at a Glance $BTCUSDT is trading at 76,826.5, down 1.21% over 24 hours. 24h high: 78,864.0 24h low: 76,693.9 24h turnover: 783.68M Sellers Are Setting the Pace Since rejecting 78,241.0, BTC has continued to form lower highs and lower lows. Several recovery attempts have failed to produce a sustained upward move, leaving sellers in control of the short-term structure. The latest decline has brought price close to 76,693.9, making this level the immediate focus. Why the Chart Still Looks Weak The moving averages remain bearishly aligned: MA7: 76,858.2 MA14: 76,892.9 MA28: 77,057.0 BTC is trading below all three averages. This shows that buyers have yet to regain short-term control. Although a small green candle has appeared near support, one candle is not enough to establish a reversal. The Critical Price Battle 76,693.9 is the immediate support to defend. 76,858.2 is the first resistance buyers must reclaim. 77,057.0 is the MA28 level that could provide stronger evidence of a momentum shift. What Could Happen Next? A successful defense of 76,693.9 followed by a confirmed 15-minute close above 76,858.2 could create room for a relief bounce. However, a confirmed close below 76,693.9 would signal further weakness and expose BTC to a deeper downside move. My Market Perspective Bitcoin is not showing a convincing reversal yet. The bearish moving-average structure and repeated lower highs keep downside pressure in focus. But support is where the next important decision will be made. The reaction around 76.6K matters more than trying to predict the next candle. Will BTC defend 76,693.9 and recover, or are we about to see another breakdown into lower price territory? #IMPACTbyTrade #BybitStocks #AnthropicS1Filing

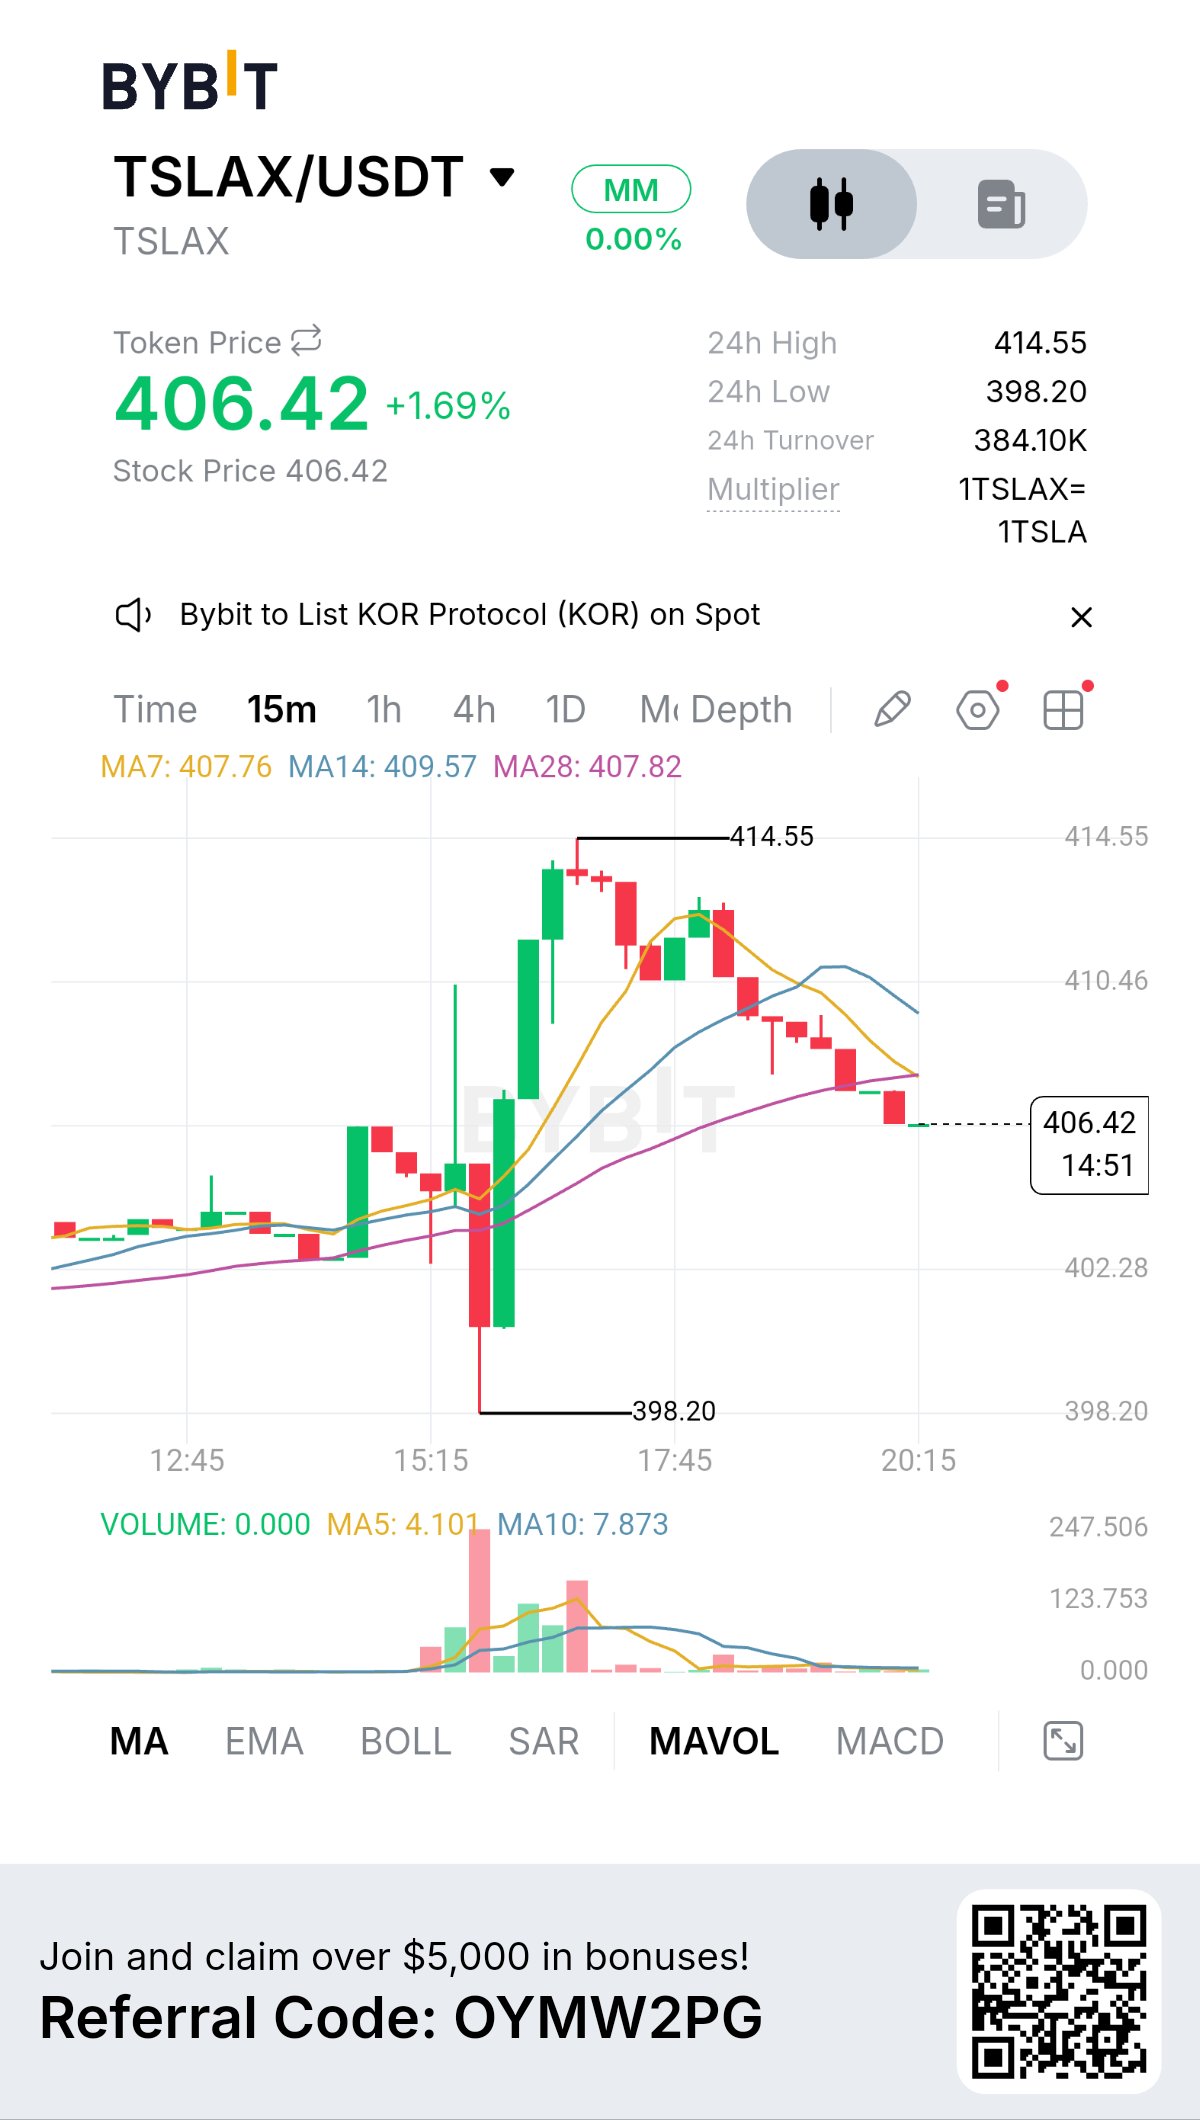
$TSLAXUSDT is still holding a 24-hour gain, but its latest price action suggests that bullish momentum is facing a serious challenge. Market Data Current price: 406.42 24h change: +1.69% 24h high: 414.55 24h low: 398.20 Turnover: 384.10K Underlying stock multiplier: 1:1 A Rally Under Pressure The 15-minute chart shows a sharp rally toward 414.55 followed by a steady retracement. Sellers have gained short-term control, with price moving below the MA7 and MA14. The important question is whether this pullback will stabilize or develop into a deeper correction. The Moving Average Conflict MA7: 407.76 MA14: 409.57 MA28: 407.82 TSLAX is currently trading below all three moving averages. This puts buyers in a challenging position. The MA28 at 407.82 remains an important recovery reference, while the MA14 at 409.57 is a higher hurdle that buyers need to reclaim to improve the short-term outlook. The Levels That Matter 407.82: MA28 recovery reference. 409.57: MA14 resistance. 402.28: Possible downside reference if selling continues. 398.20: Session low and major structural support. Two Scenarios, One Important Test If buyers recover 407.82 and secure a 15-minute close above 409.57, a retest of 414.55 could come into view. However, continued weakness below the moving-average zone, particularly a confirmed close below 407.82, would increase the risk of a move toward 402.28. My Take TSLAX has not erased its entire 24-hour gain, but the short-term chart tells a more cautious story. The recent rally needs confirmation from buyers before bullish momentum can be considered restored. For now, the moving averages provide the roadmap, and price confirmation remains essential. Will TSLAX recover above 409.57 and challenge 414.55 again, or will sellers push it toward 402.28? #BybitStocks #AnthropicS1Filing #IMPACTbyTrade

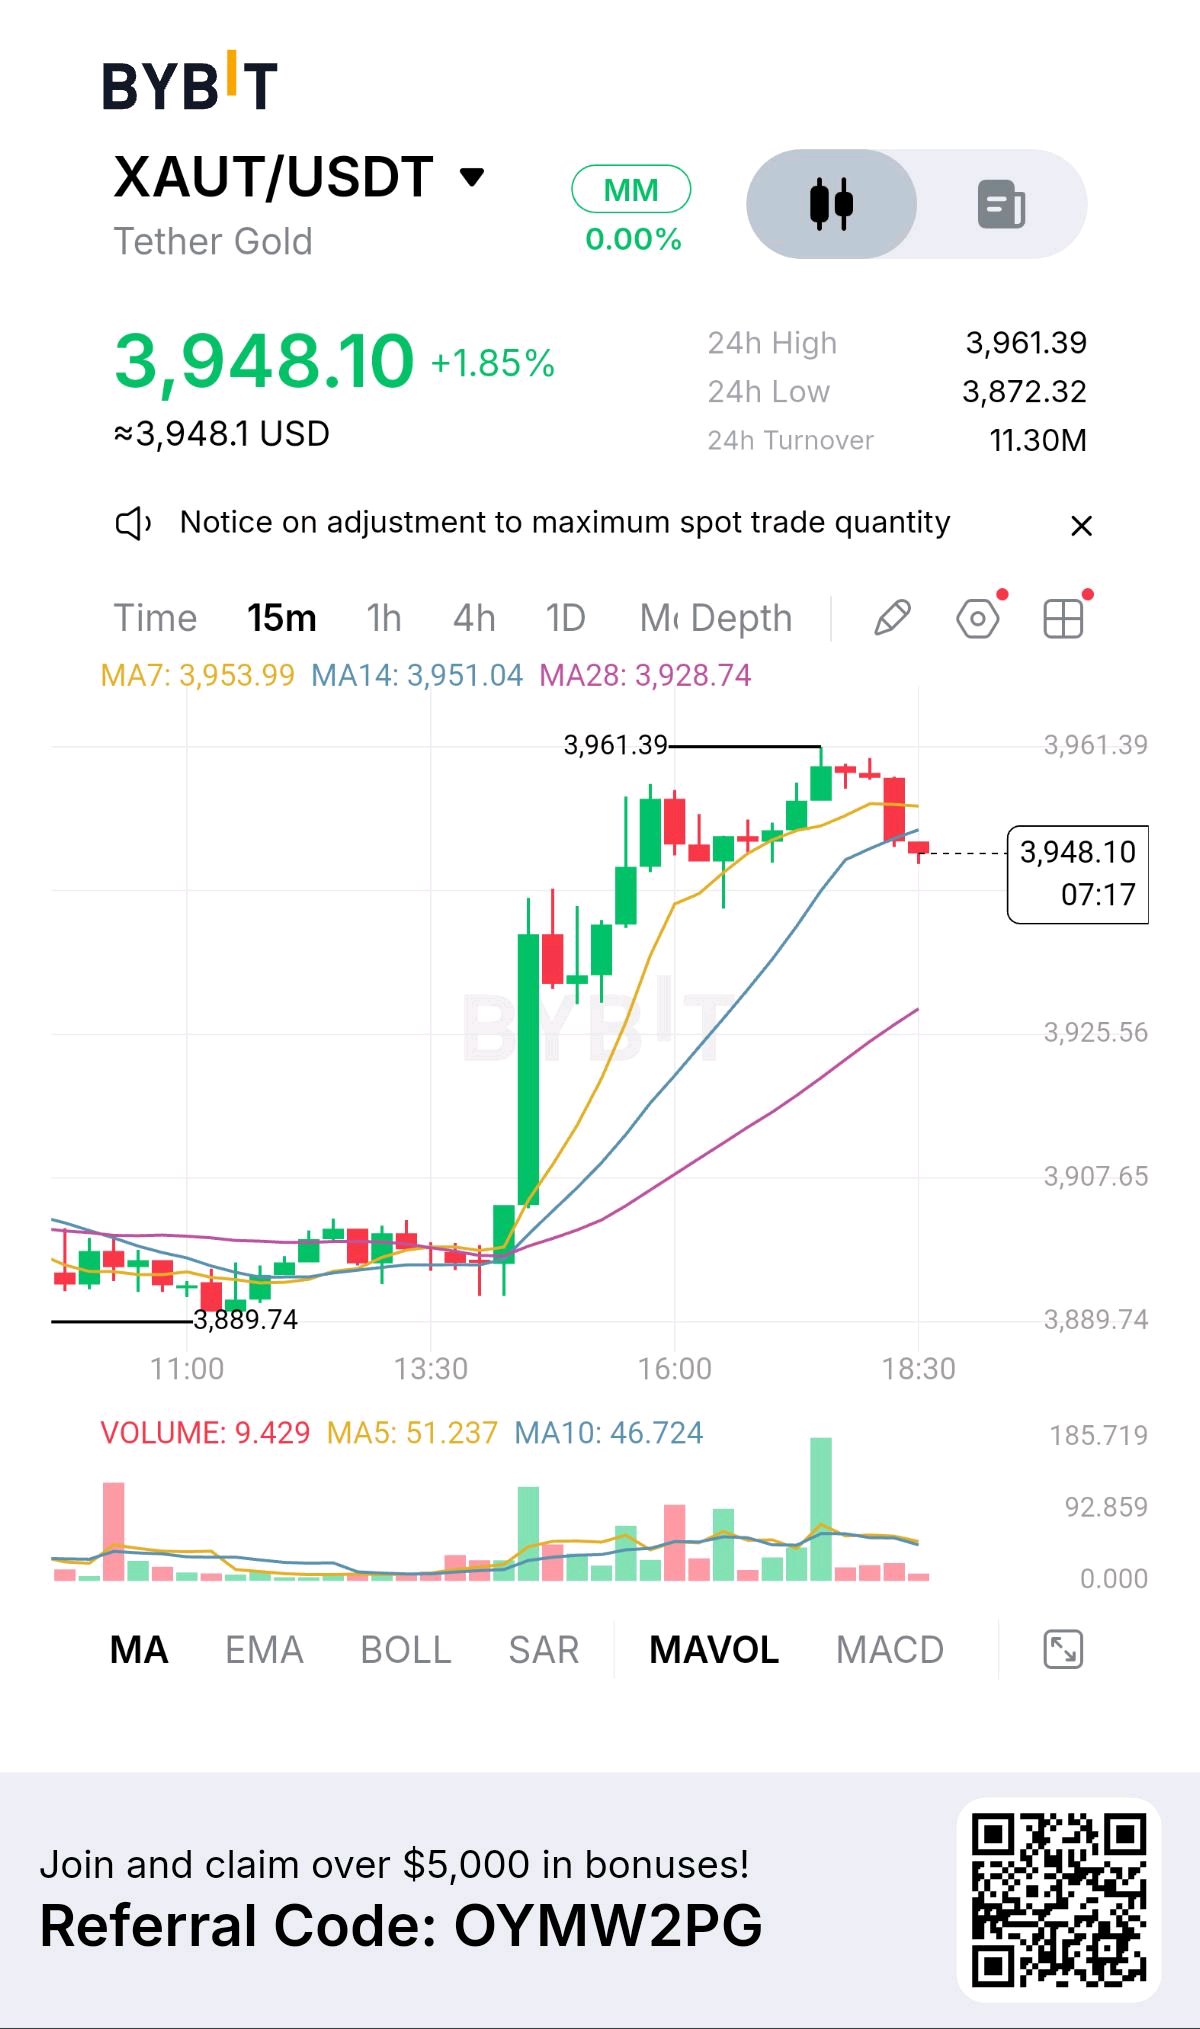
$XAUTUSDT has delivered a strong upward move, but the latest rejection near 3,961.39 is putting buyers under pressure. The market is still up 1.85% over 24 hours, trading at 3,948.10. Its 24-hour range stands between 3,872.32 and 3,961.39, with turnover at 11.30M. The Rally Is Pausing, Not Yet Reversing On the 15-minute chart, buyers pushed XAUT higher from 3,889.74 before reaching 3,961.39. Since then, sellers have triggered a pullback, taking price below the short-term moving averages. The key question now is whether this decline is simply a pause within the bullish move or the start of a deeper correction. Where the Pressure Is Building The moving averages provide three important reference points: - MA7: 3,953.99 - MA14: 3,951.04 - MA28: 3,928.74 Price is currently below MA7 and MA14, showing short-term weakness. However, the upward-sloping MA28 remains an important support reference. The recent red volume increase also suggests stronger selling activity during the pullback. The Next Test A recovery above 3,951.04, confirmed by a 15-minute candle close, could restore short-term bullish momentum and bring 3,961.39 back into focus. But a decisive close below 3,928.74 would weaken the current bullish structure, with 3,907.65 becoming a possible downside reference. My Perspective The strongest part of this chart is the previous rally. The biggest uncertainty is whether buyers can protect its gains. I would pay close attention to MA28. Its ability to hold could tell us more about the strength of this trend than another temporary green candle. Is this just a healthy pause before another gold rally, or are sellers preparing to take XAUT into a deeper correction? #IMPACTbyTrade #BybitStocks #NewFinancialPlatform #MidtermsMarketWatch

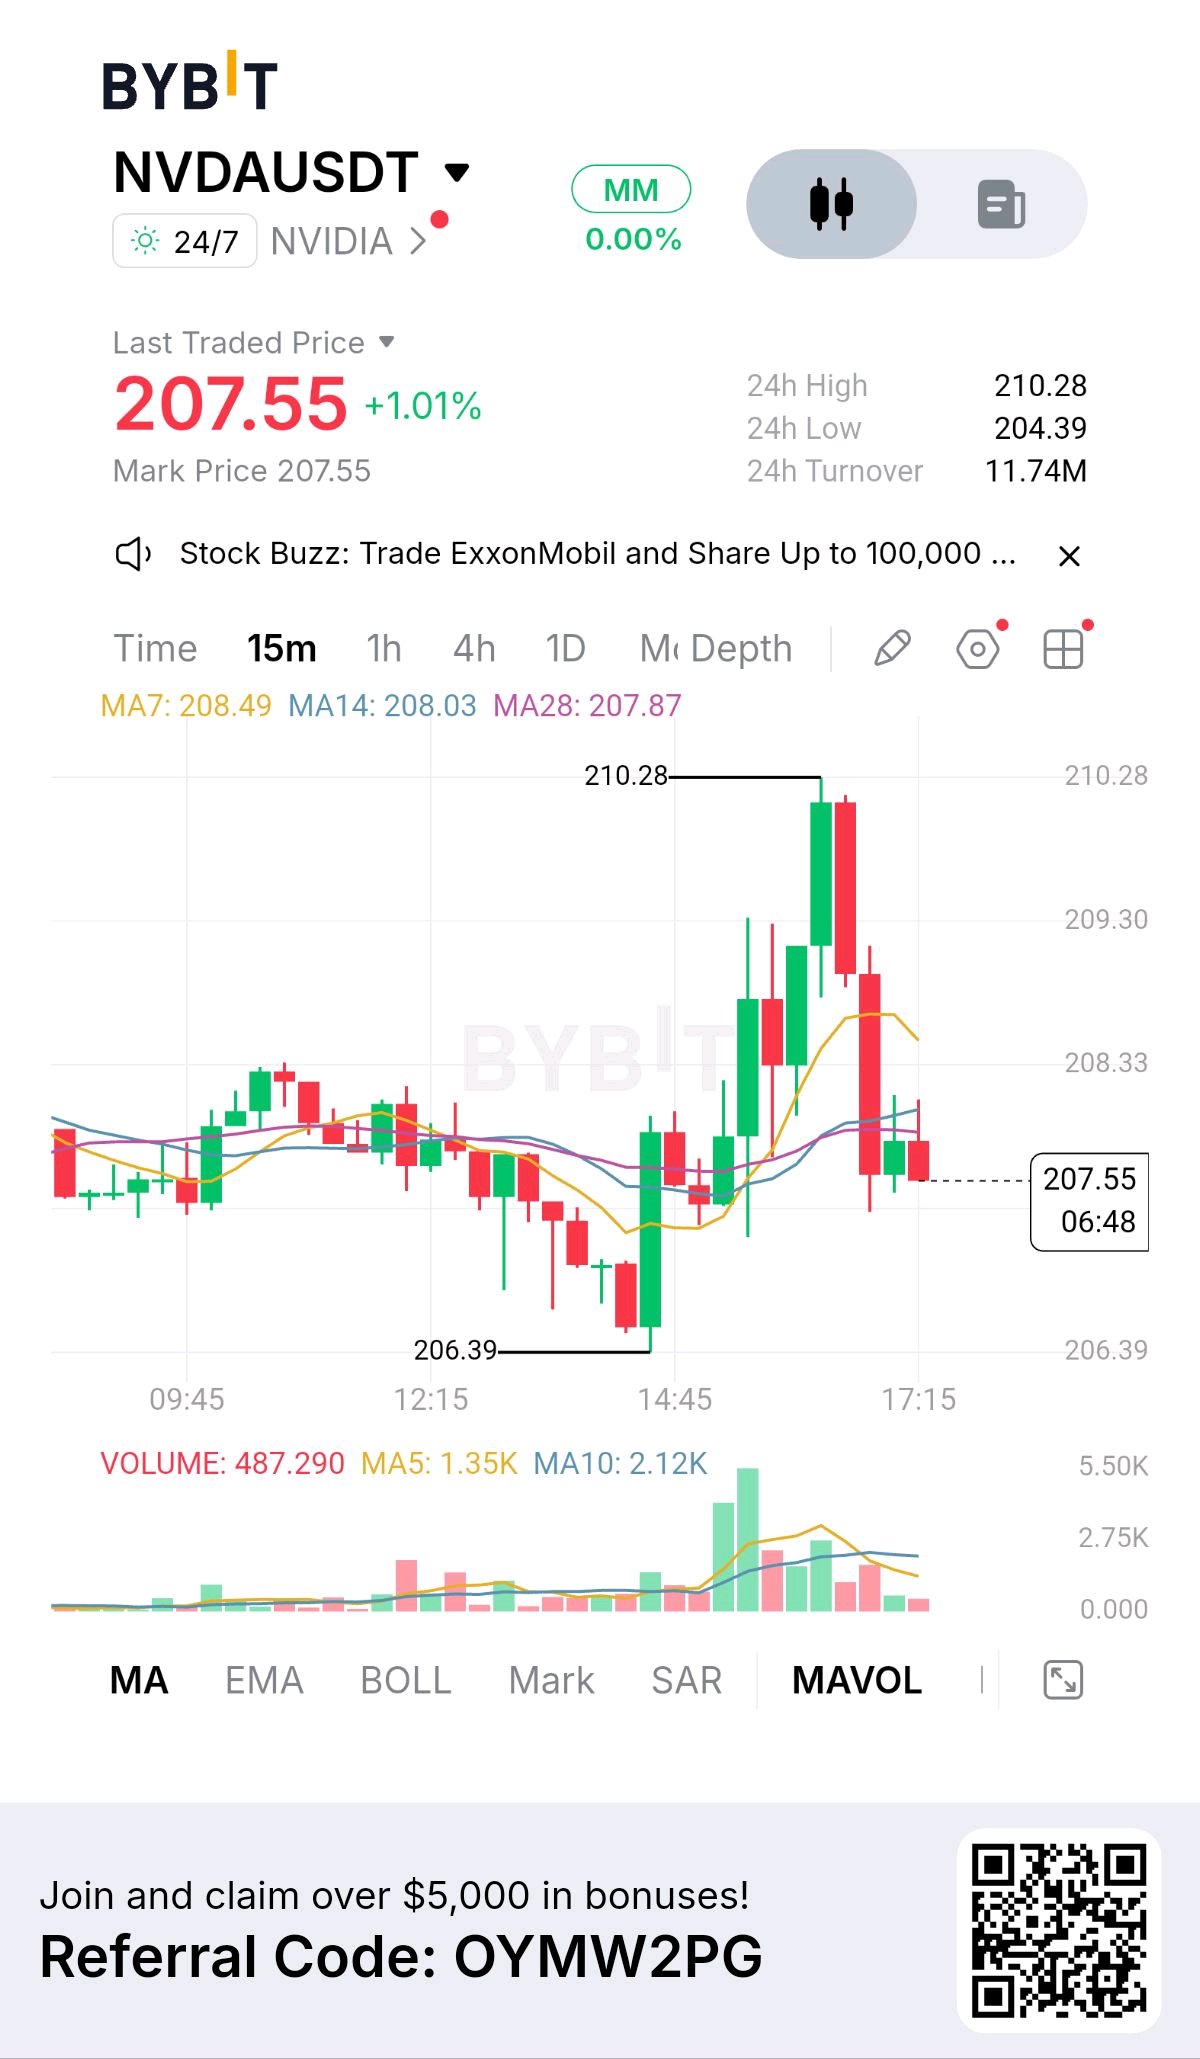
$NVDAXUSDT: The Rally Faces a Reality Check The rejection at 210.28 has changed the short-term momentum. Now, the important question is whether buyers can defend the moving-average zone or whether sellers will force a deeper correction. Market Snapshot NVDAUSDT is trading at 207.55, up 1.01% over 24 hours. The session range is 204.39–210.28, with turnover at 11.74M. A Powerful Rally Meets Heavy Selling On the 15-minute chart, buyers pushed price sharply upward from 206.39 to 210.28. However, the rally failed to sustain its momentum as strong red candles followed the rejection. Price has since moved below MA7 and is now testing the closely positioned MA14 and MA28. The Technical Battlefield MA7: 208.49 MA14: 208.03 MA28: 207.87 The current price is below all three moving averages, placing short-term pressure on buyers. The MA14 and MA28 zone is particularly important because it could determine whether this pullback stabilizes or extends. Three Price Levels Deserve Attention 210.28 remains the recent rally peak and major resistance. 208.49 is the first recovery hurdle for buyers. 207.87 is the critical moving-average support level, while 206.39 remains the lower structural reference. Two Outcomes to Watch If buyers defend the 207.87 area and reclaim 208.49 with a confirmed 15-minute close, another attempt toward 210.28 becomes possible. If price closes decisively below 207.87, the recovery structure weakens and 206.39 could become the next downside area to watch. The Bigger Message A strong rally does not guarantee continued upside. What matters now is how price behaves after rejection. The next move around 207.87–208.49 could reveal whether this is simply a healthy pullback or the beginning of a deeper reversal. Do you see this as a buying opportunity after the rally, or are you waiting for stronger evidence that sellers have lost control? #ByXIMPACT #BybitStocks #NewFinancialPlatform

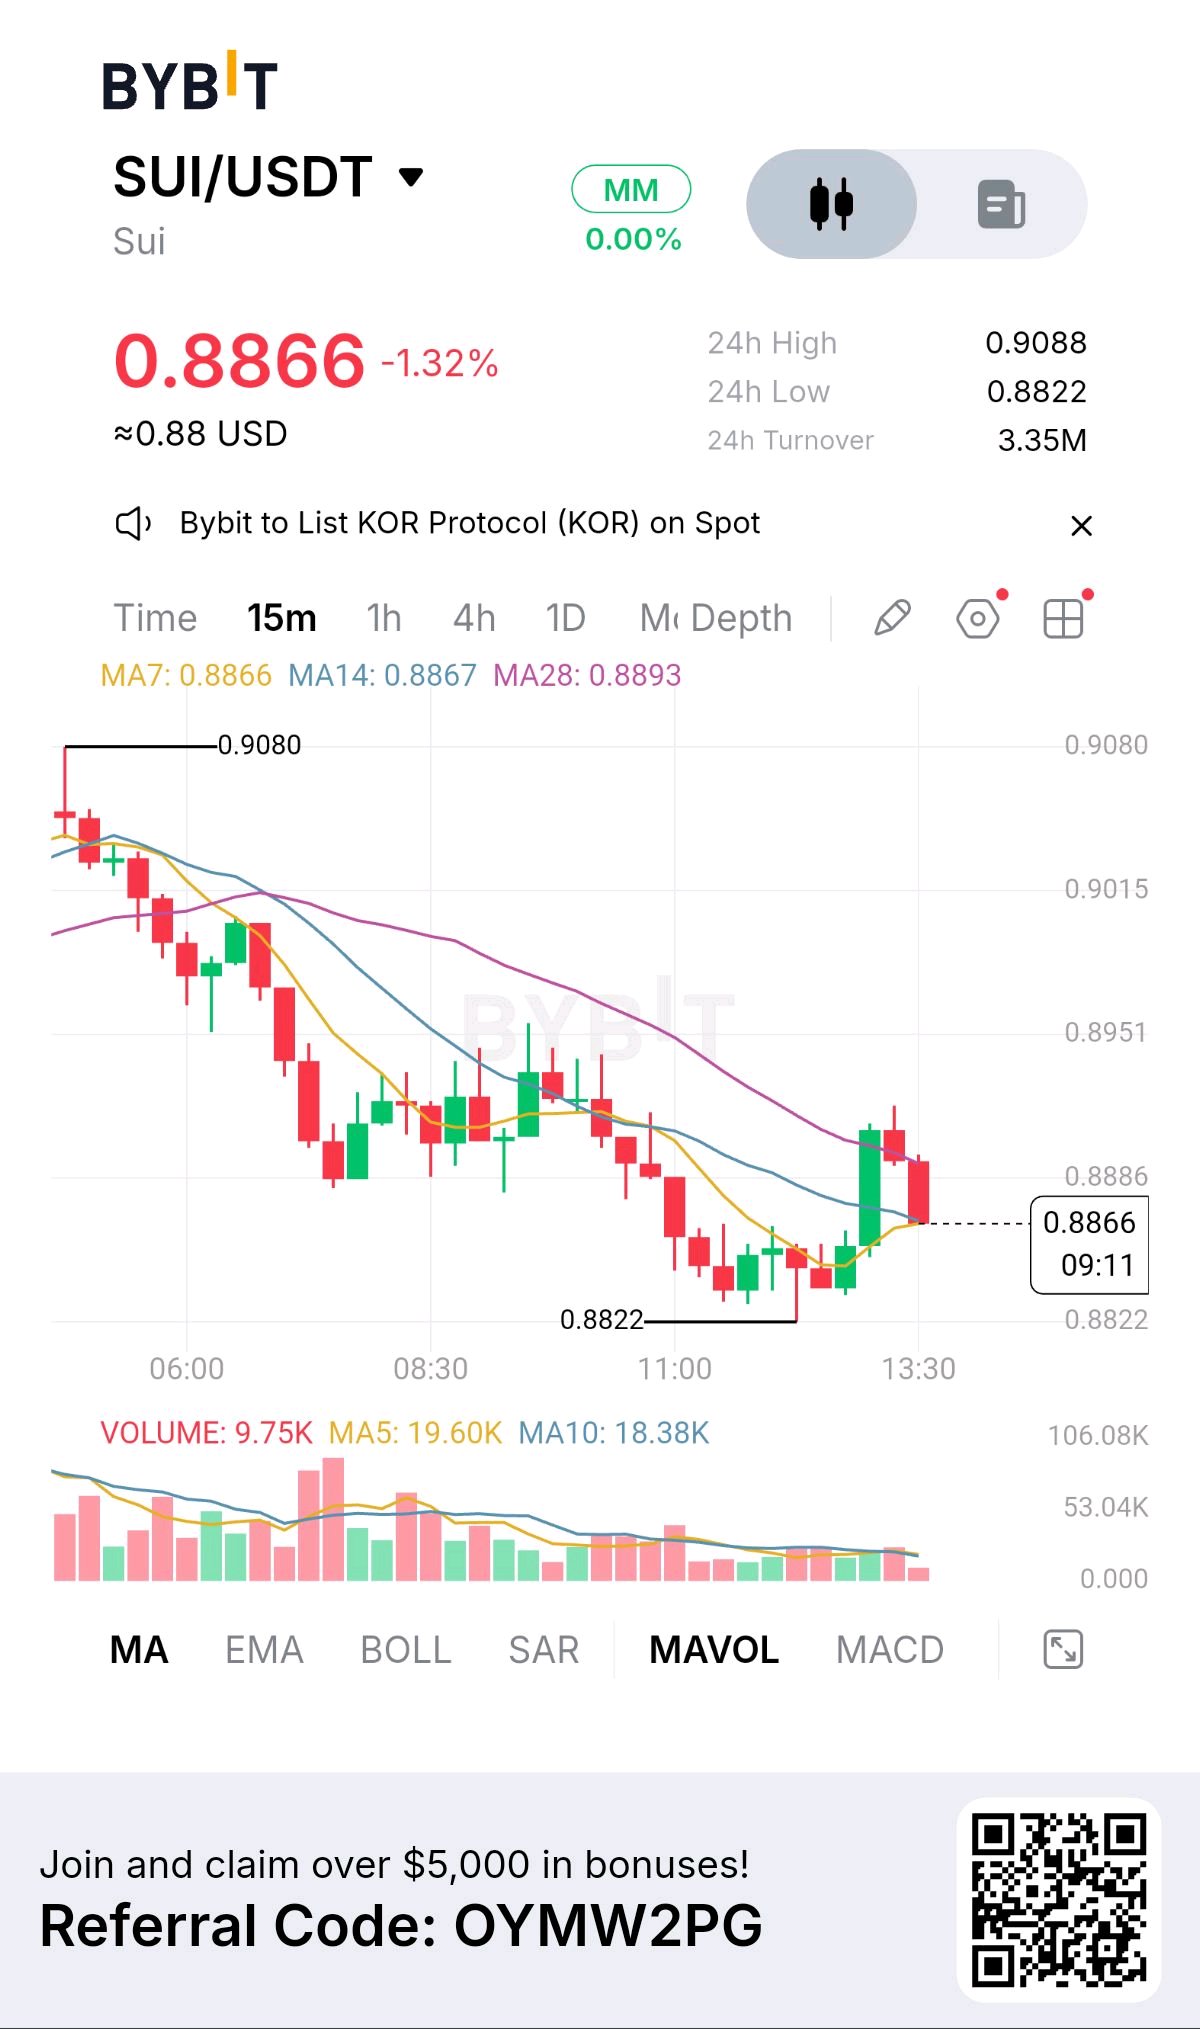
$SUIUSDT is showing signs of stabilization after a sustained decline, but one major obstacle stands between the current price and a stronger recovery. At 0.8866, SUI/USDT is down 1.32% over 24 hours. The trading range stands between 0.8822 and 0.9088, with turnover at 3.35M. Momentum Is Changing, But Has It Turned? The 15-minute chart shows that the decline from 0.9080 eventually found support at 0.8822. Since then, buyers have managed to lift price and establish a short-term recovery. The most interesting development is the behavior of the moving averages: - MA7: 0.8866 - MA14: 0.8867 - MA28: 0.8893 MA7 and MA14 are now almost aligned with the current price. This suggests that the immediate selling momentum has weakened. However, MA28 remains overhead and is still the key resistance to watch. The Level That Could Change Everything A confirmed 15-minute close above 0.8893 would strengthen the recovery argument and bring 0.8951 into focus as the next upside reference. On the other hand, rejection at MA28 followed by a loss of the 0.8866 area could send SUI back toward 0.8822. What the Market Must Prove For now, SUI is caught between a stabilizing short-term structure and a still-declining longer moving average. The reduced selling pressure near the recent low is encouraging, but the small green volume uptick is not enough on its own to confirm buyer dominance. My focus is on 0.8893. That is the level where the next meaningful test begins. Will SUI finally break above MA28 and extend its recovery, or will resistance send price back to 0.8822? #ByXIMPACT #BybitStocks $SUIUSDC

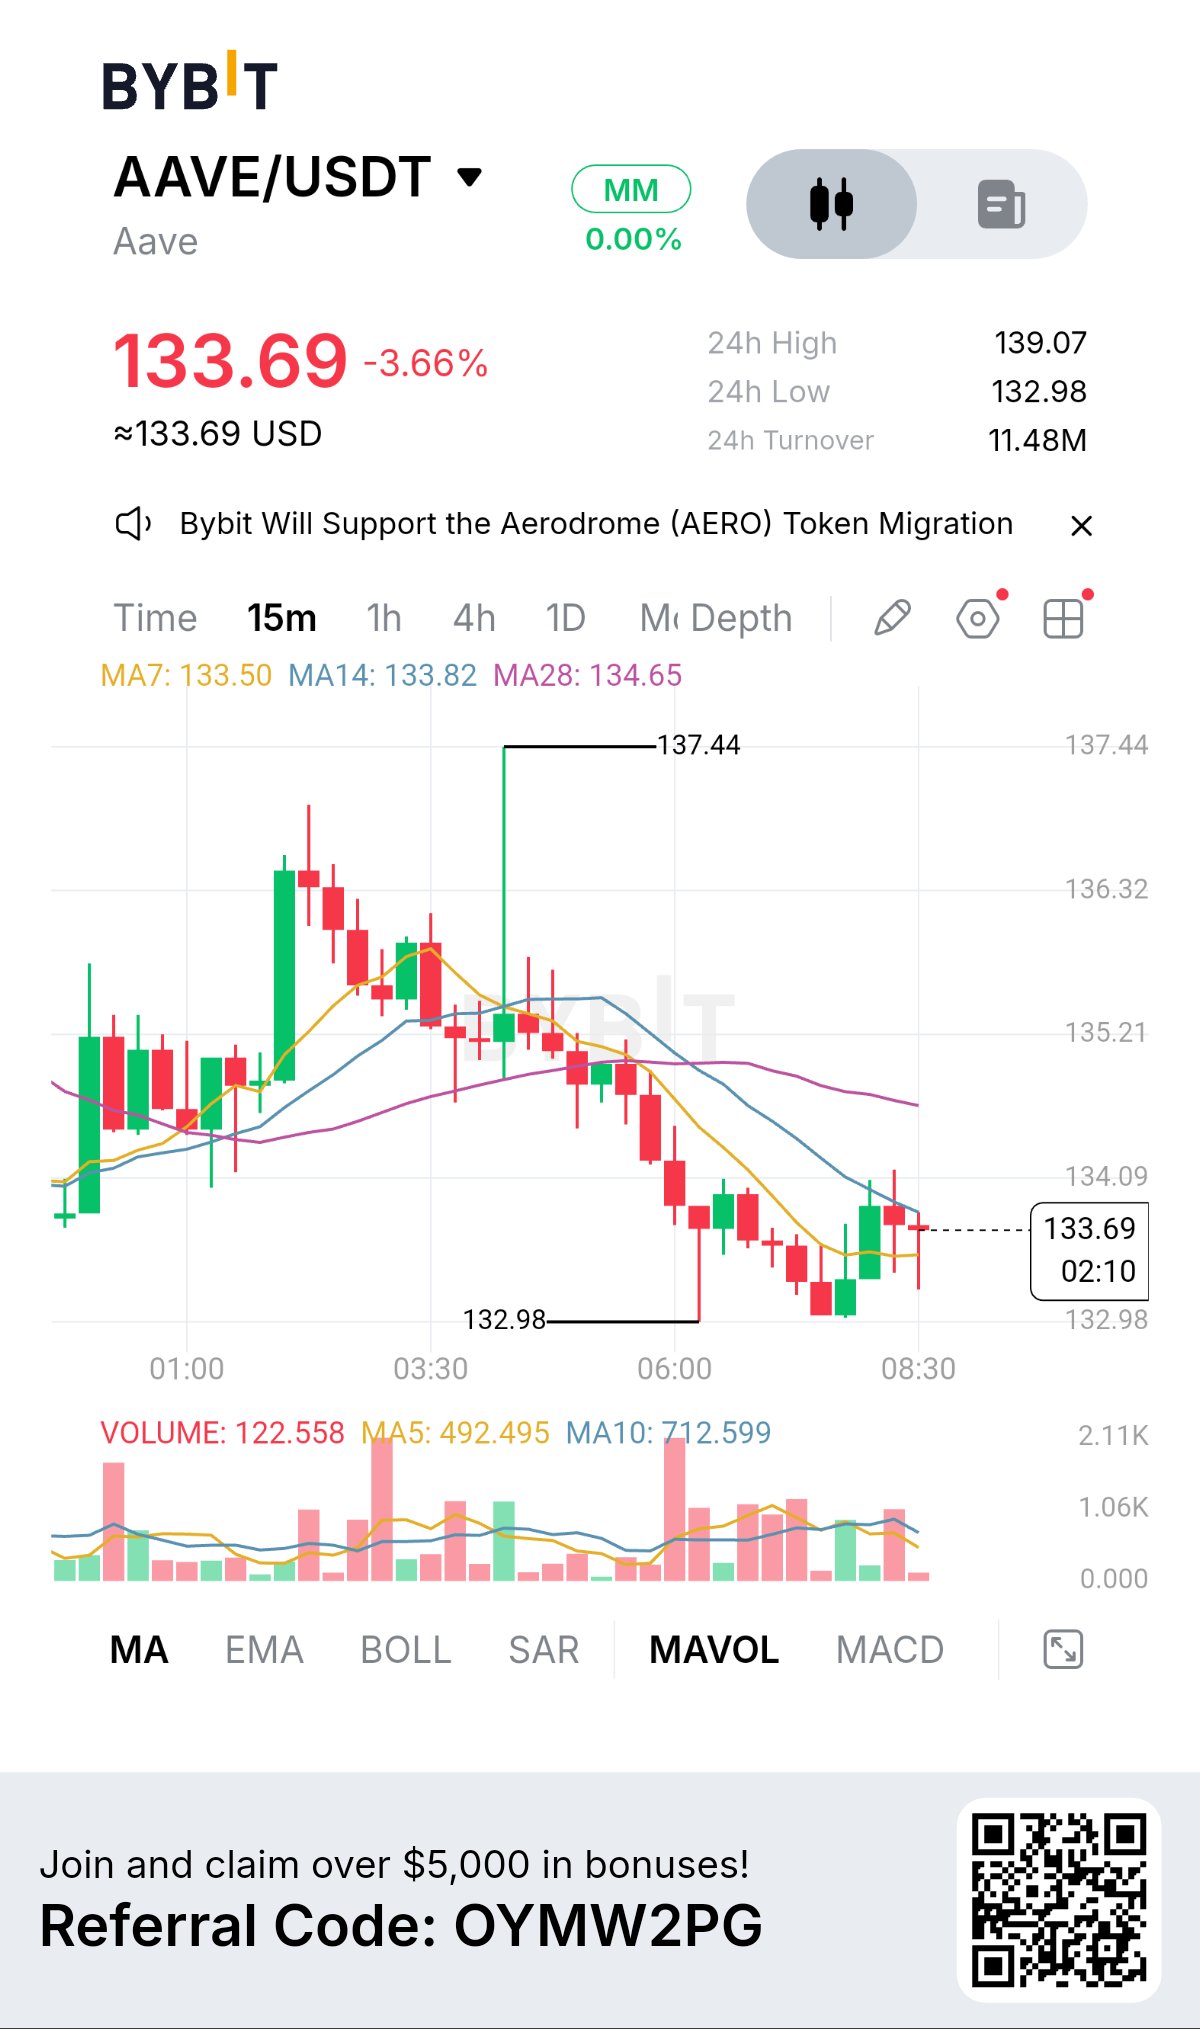
AAVE Finds a Floor, But Is Recovery Real?
$AAVEUSDT has slowed its decline, but the market has not yet confirmed a reversal. Trading at 133.69, AAVE remains down 3.66% over 24 hours. The session has recorded a high of 139.07 and a low of 132.98, with turnover at 11.48M. From Heavy Selling to a Possible Base The 15-minute chart tells an important story. After reaching 137.44, AAVE faced sustained selling pressure, forming lower highs and lower lows before reaching 132.98. Something changed at that low. Selling pressure was followed by a green candle and a period of tighter consolidation. This suggests that buyers are beginning to respond, although it does not yet confirm a trend reversal. A Small Improvement, A Bigger Challenge The moving averages show why caution is still necessary: - MA7: 133.50, now below price. - MA14: 133.82, the immediate resistance. - MA28: 134.65, the higher resistance zone. The MA7 has flattened, offering an early sign that selling momentum may be slowing. However, MA14 and MA28 remain overhead obstacles. The Decision Zone AAVE now has two important possibilities. If buyers maintain support above 133.50 and secure a 15-minute close above 133.82, recovery could extend toward 134.65. If consolidation breaks down and price closes below 132.98, the recent support defense would be weakened, exposing AAVE to further downside. My Observation The interesting part of this chart is the change in behavior around 132.98. Sellers pushed price down aggressively, but the market is no longer falling at the same pace. Still, slowing down is not the same as reversing. AAVE needs to reclaim its moving averages before buyers can claim stronger control. Is this the beginning of a genuine recovery, or just a temporary pause before another sell-off? #BybitStocks #IMPACTbyTrade
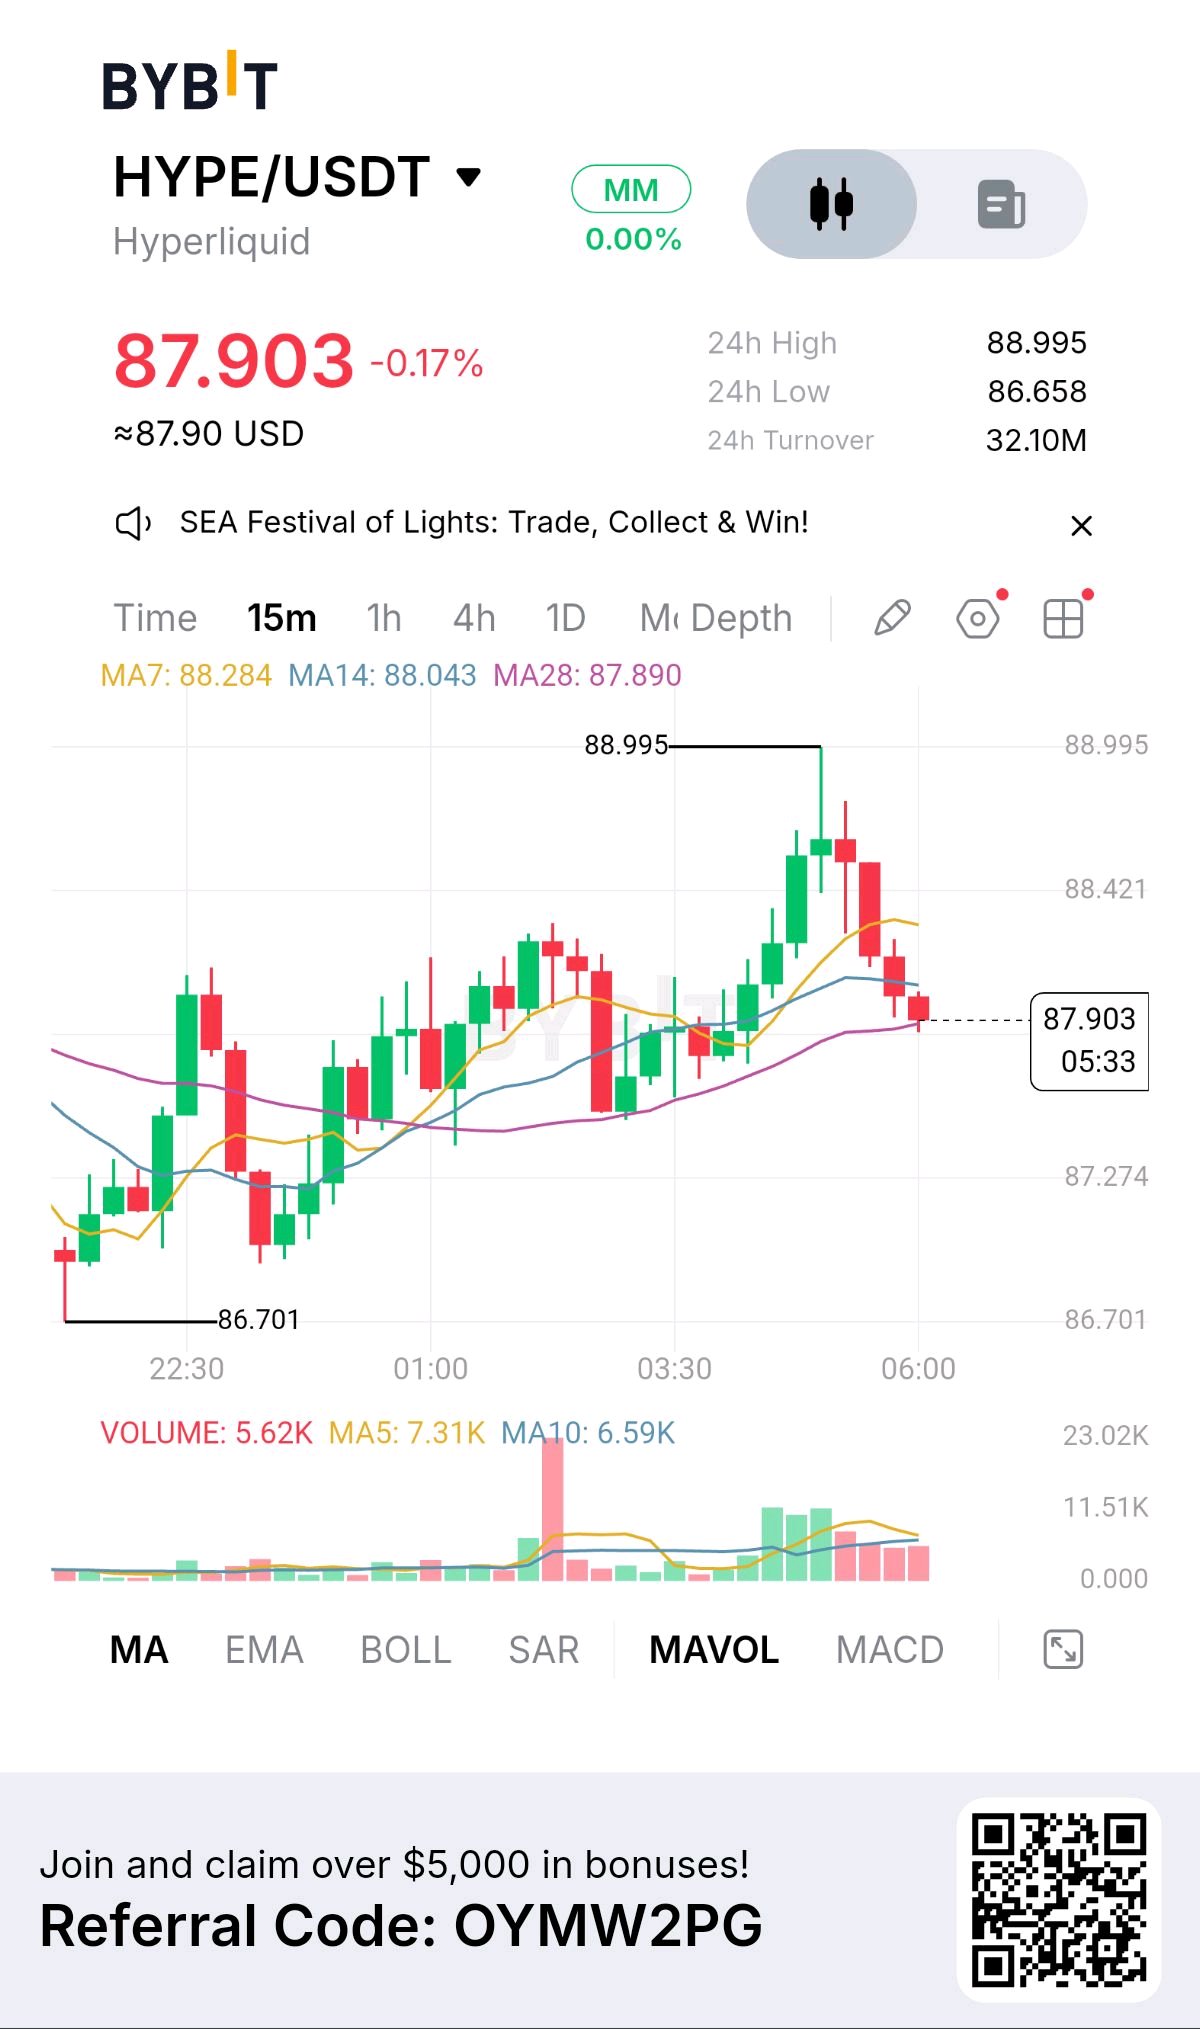
HYPE at a Crossroads: Defend or Break?
$HYPEUSDT is facing a critical moment on the 15-minute chart. Trading at 87.903, down 0.17% over 24 hours, the token is now caught between weakening bullish momentum and increasing selling pressure. Its latest range stretches from 86.658 to 88.995, with turnover at 32.10M. The Battle Between Buyers and Sellers The rejection from 88.995 has changed the short-term picture. Lower highs and lower lows suggest sellers are gaining control, while price struggles to remain above MA28. Here is where the market stands: - MA7: 88.284 - MA14: 88.043 - MA28: 87.890 With price below MA7 and MA14, buyers still have work to do. MA28 is now the immediate support being tested. The Next Move Could Change the Picture If buyers defend 87.890 and recover 88.043, momentum may begin shifting back in their favor. A stronger recovery could bring 88.995 back into focus. But if sellers secure a 15-minute close below 87.890, the downside could extend toward 87.274, with 86.701 as another important support reference. What Makes This Setup Interesting? The key issue is not simply whether HYPE moves up or down. It is whether buyers can defend the longer moving average after the recent rally. A successful defense could keep recovery hopes alive. A confirmed breakdown would suggest that the market needs a deeper correction. One level. Two competing sides. A decisive candle could reveal who has control. Are buyers ready to defend 87.890, or will sellers turn this support into resistance? #ByXIMPACT #MidtermsMarketWatch

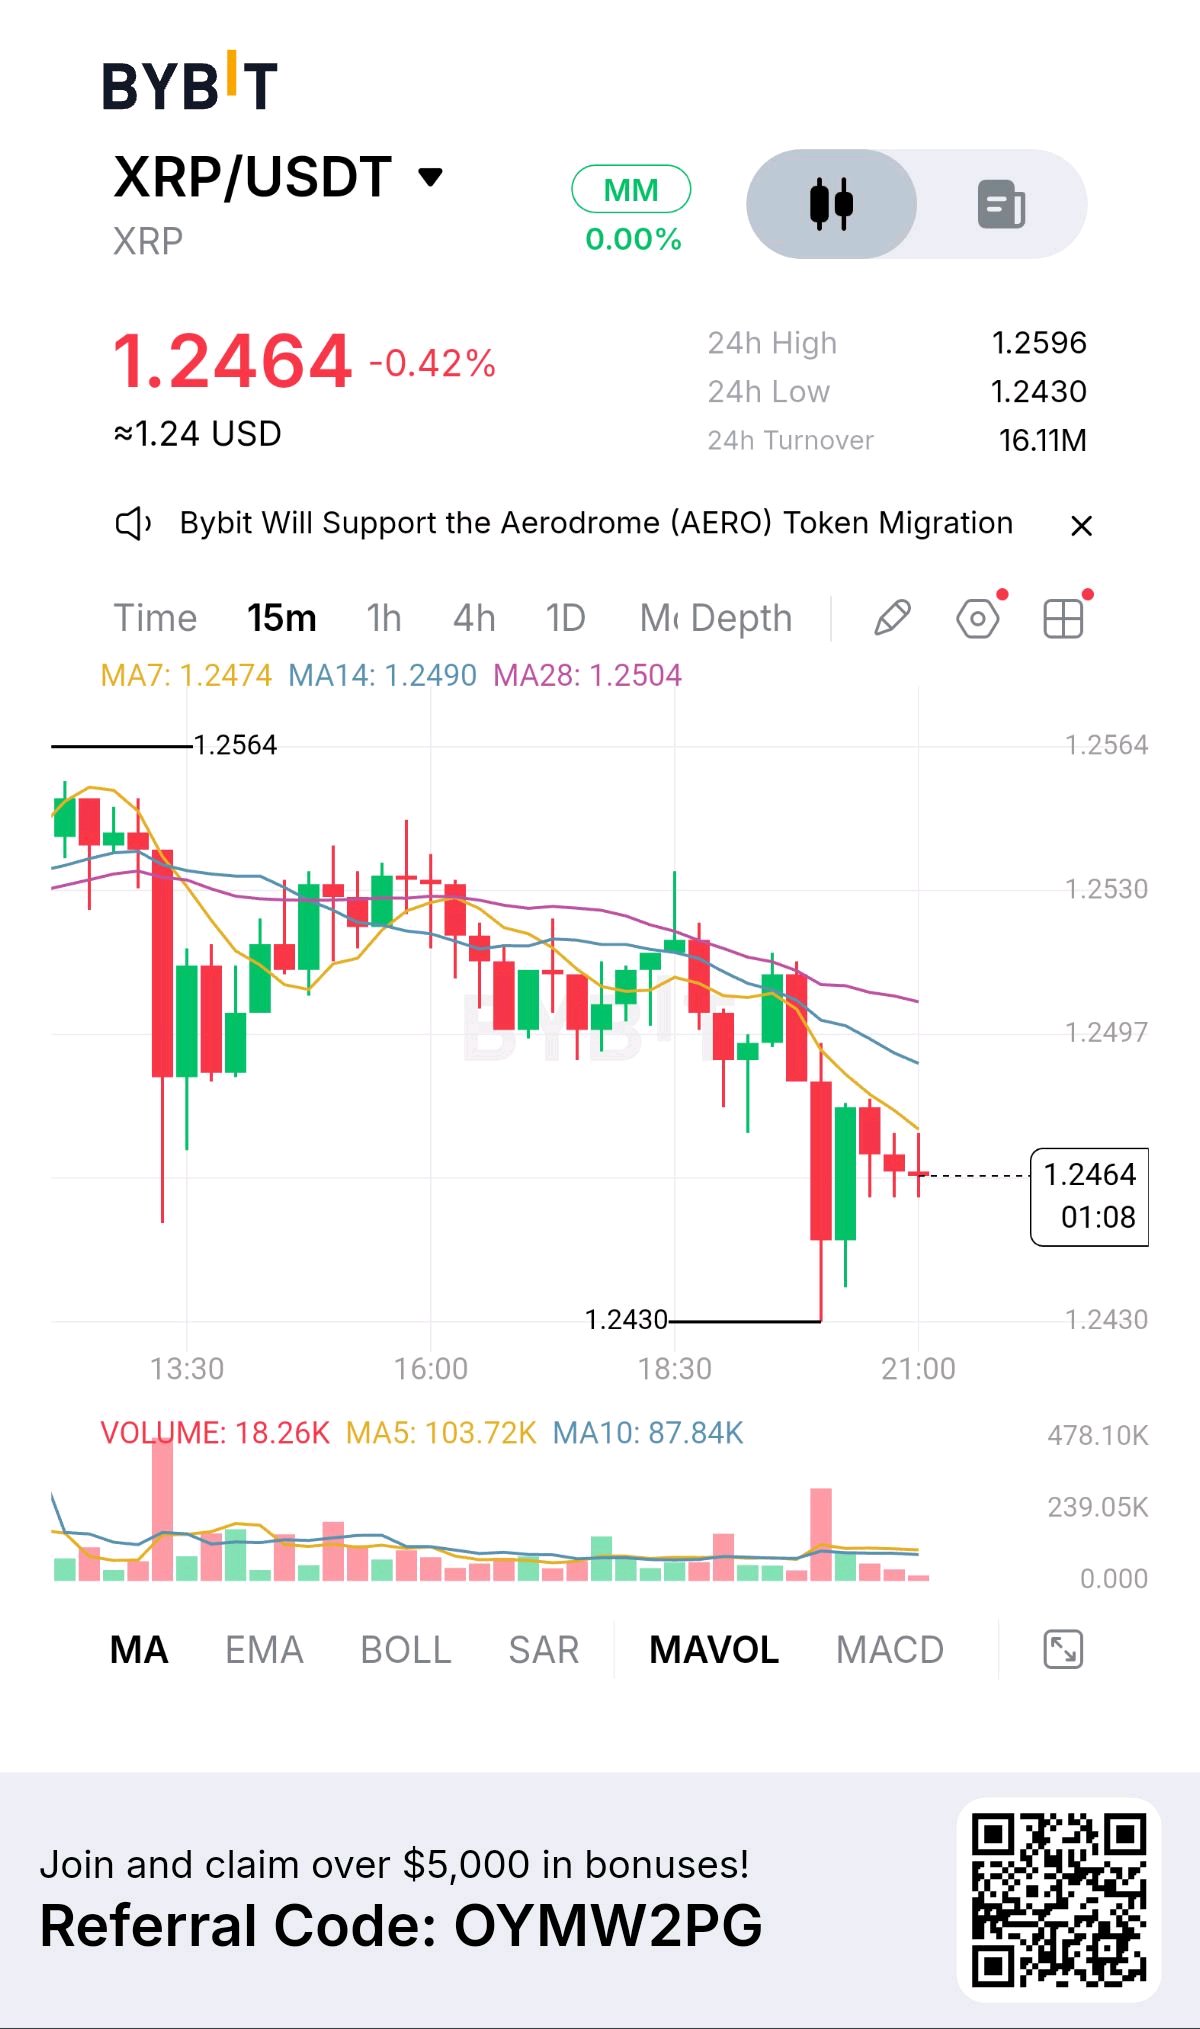
$XRPUSDT is trading at 1.2464, down 0.42% over 24 hours. Price remains close to the session low of 1.2430, while the high stands at 1.2596. Trading turnover is 16.11M. The Sellers Still Have Control The 15-minute chart continues to show bearish momentum. Since reaching 1.2564, XRP has formed lower highs and lower lows, suggesting that sellers remain in control. The latest decline pushed price toward 1.2430. Although the market is attempting to stabilize, there is not yet enough evidence of a confirmed reversal. What the Moving Averages Reveal The moving averages remain bearishly aligned: - MA7: 1.2474 - MA14: 1.2490 - MA28: 1.2504 Price is trading below all three averages, leaving them as potential resistance zones. A noticeable increase in red volume accompanied the latest decline, indicating stronger selling activity during that move. Levels That Matter - Resistance: 1.2474 - Secondary resistance: 1.2490 - Major MA resistance: 1.2504 - Critical support: 1.2430 Two Possible Directions Bullish case: If buyers defend 1.2430 and push XRP above 1.2474 with a confirmed 15-minute candle close, a short-term recovery could develop. Reclaiming 1.2490 and 1.2504 would provide stronger evidence of improving momentum. Bearish case: A confirmed 15-minute close below 1.2430 would weaken the support structure and could expose the psychological 1.2400 level. The Bigger Picture XRP is approaching a decision point. The bearish moving-average alignment favors sellers for now, but the 1.2430 support level remains important. A bounce alone does not confirm a reversal, just as a support test does not guarantee a breakdown. Patience and confirmation matter more than reacting to every candle What is your view? Will XRP defend 1.2430 and recover above 1.2474, or are sellers preparing for another move lower? #IMPACTbyTrade #BybitStocks $XRPUSDC

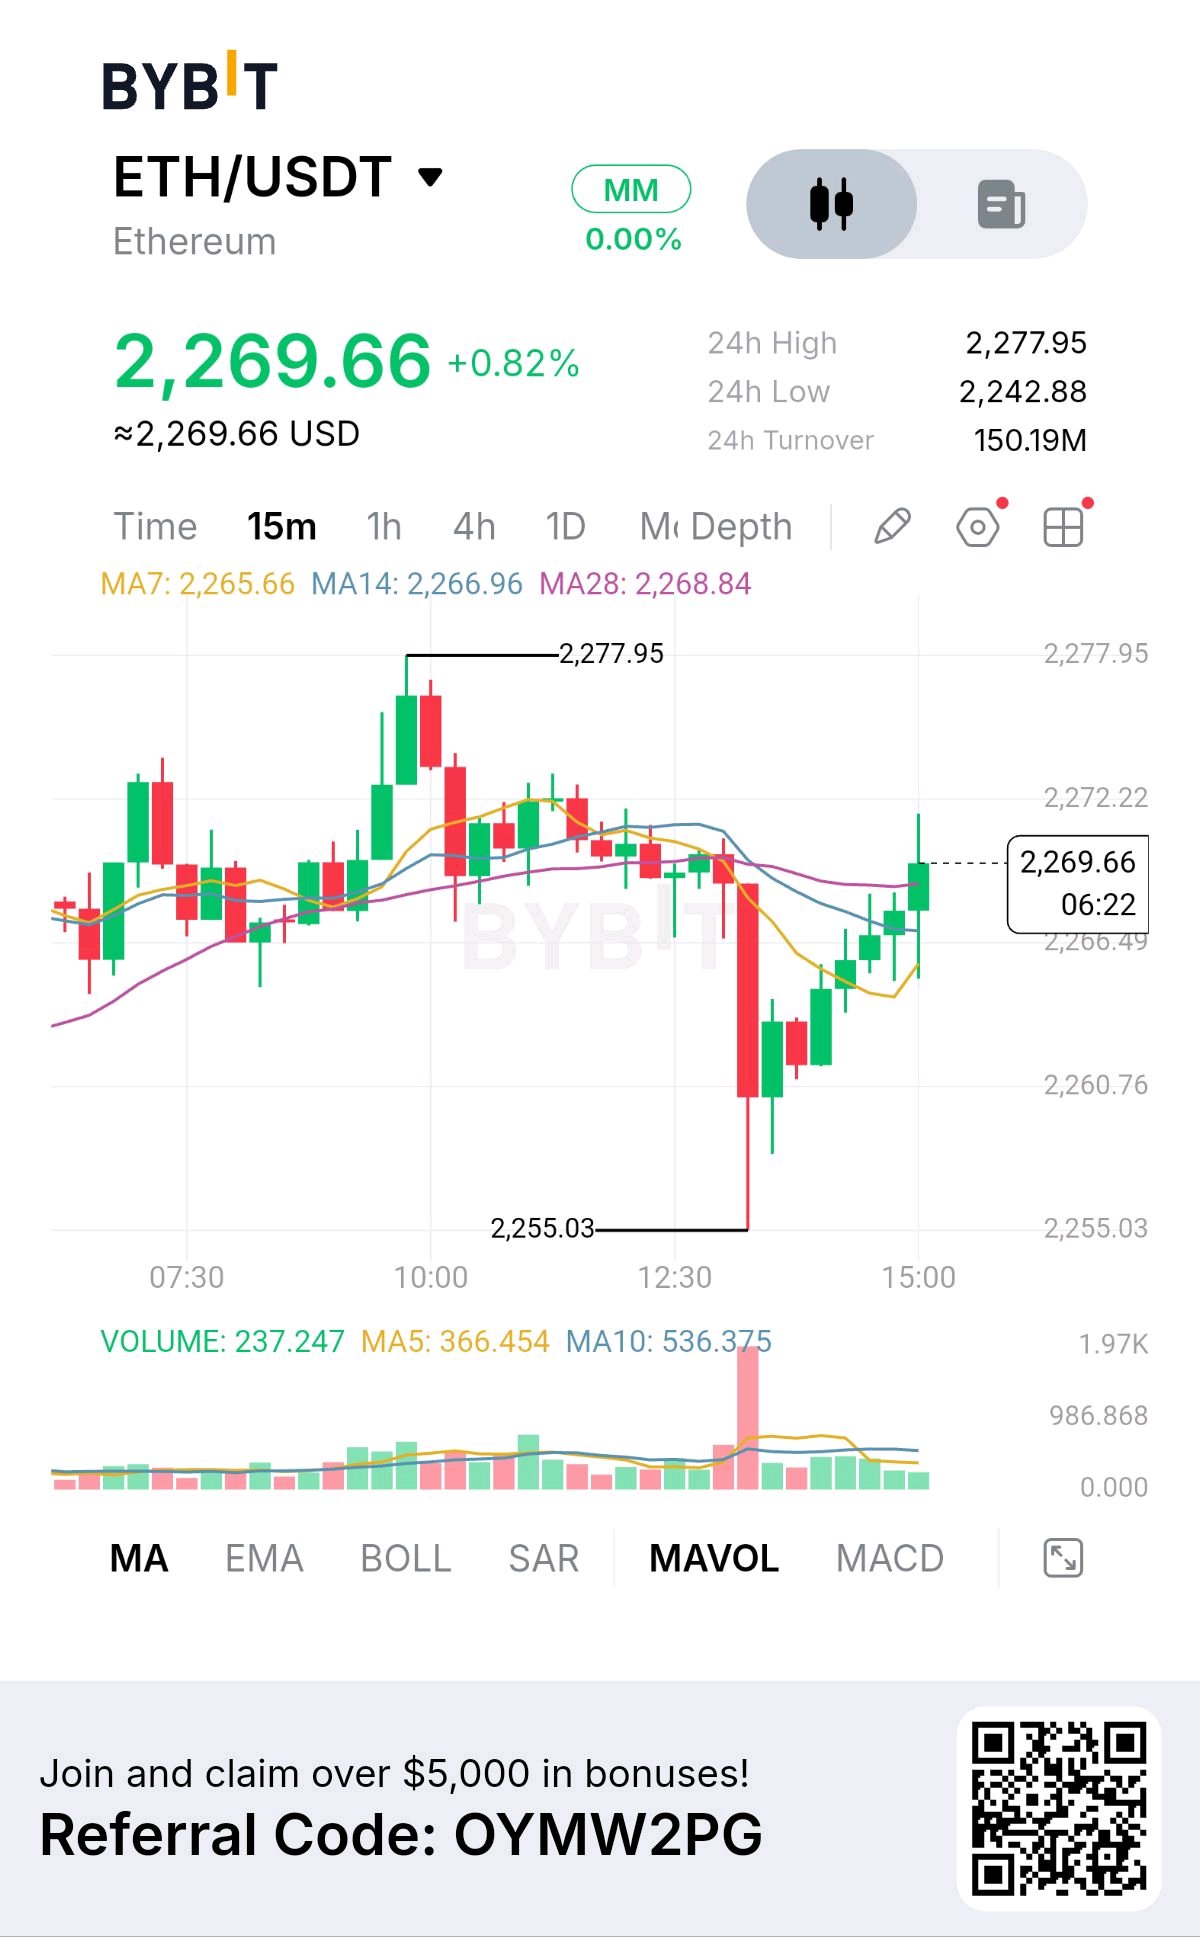
Ethereum is attempting to regain bullish momentum after a sharp sell-off on the 15-minute chart. Buyers have stepped in, but one resistance zone still stands between the recovery and a stronger upward move. THE MARKET IN NUMBERS ETH/USDT: 2,269.66 24H Change: +0.82% 24H High: 2,277.95 24H Low: 2,242.88 24H Turnover: 150.19M WHAT THE CHART IS REVEALING After reaching 2,277.95, ETH experienced a sharp decline toward 2,255.03. The rejection from that low triggered a recovery, with price gradually forming higher lows. ETH has also moved back above MA7 at 2,265.66 and is testing the MA28 at 2,268.84, while MA14 sits at 2,266.96. This suggests that immediate selling pressure has eased, although a confirmed reversal is not yet established. THE LEVELS THAT MATTER - 2,272.22: Key resistance and recovery confirmation zone. - 2,268.84: MA28 and immediate technical barrier. - 2,265.66: MA7 and first support to monitor. - 2,255.03: Recent low and major downside reference. THE NEXT MOVE If buyers take control: A confirmed 15-minute close above 2,272.22 could strengthen the recovery and bring 2,277.95 back into focus. If sellers return: A break below 2,265.66 could weaken the rebound and expose the 2,255.03 low. BEYOND THE CANDLES The sharp volume expansion during the decline makes 2,255.03 an important area to watch. However, volume alone cannot confirm capitulation or prove that selling pressure has been exhausted. The real test is whether ETH can hold its reclaimed moving averages and overcome 2,272.22. JOIN THE DISCUSSION Is ETH preparing for another push toward 2,277.95, or is this recovery likely to face another rejection? What would convince you that buyers are truly back in control? #IMPACTbyTrade #NewFinancialPlatform $ETHUSDT $ETHUSDC

$BTCUSDT is showing signs of short-term weakness despite maintaining a positive 24-hour performance. The latest price action suggests that buyers are losing momentum as key moving averages turn into resistance. Market Overview BTC/USDT: 77,933.9 24H Change: +0.47% 24H High: 78,227.1 24H Low: 77,324.5 24H Turnover: 237.39M What Is Changing on the 15M Chart? The recent rally from 77,678.9 toward 78,227.1 failed to sustain its upward momentum. Since that peak, BTC has developed a sequence of lower highs and lower lows. More importantly, price has slipped beneath the MA28, while MA7 and MA14 are also positioned above the current market price. This combination points to increasing short-term selling pressure. Moving Average Breakdown - MA7: 77,995.3 - MA14: 78,052.7 - MA28: 77,965.7 The moving averages are turning downward, while the recent red volume bars indicate stronger selling activity during the decline. The Next Critical Battle 77,965.7 is now an important recovery threshold. Buyers need to reclaim this level to challenge the current bearish structure. Below the market, 77,744.1 is the first support to monitor, followed by 77,678.9, the recent structural low. What Comes Next? Recovery scenario: If BTC reclaims 77,965.7 and subsequently strengthens above the higher moving averages, bearish pressure could begin to ease. Downside scenario: A confirmed 15-minute close below 77,744.1 could expose 77,678.9 to another test. My Market Take The important signal here is the loss of moving-average support after the rejection at 78,227.1. However, a short-term bearish structure does not automatically mean the broader market has turned bearish. Confirmation matters more than prediction. Traders should watch how BTC reacts around 77,965.7 and 77,744.1 before drawing stronger conclusions. Let's Discuss Will Bitcoin reclaim its moving averages and recover, or are sellers preparing to push BTC toward 77,678.9? Which level carries more weight in your analysis? #ByXIMPACT #BybitStocks $BTCUSDC

HYPE is approaching a critical decision zone after a sharp intraday decline and a noticeable recovery. The question now is whether buyers have enough strength to turn this rebound into a stronger upward move. Market Pulse $HYPEUSDT is trading at 88.141, down 0.30% over the last 24 hours. 24H High: 88.949 24H Low: 86.300 24H Turnover: 33.30M The Battle for Momentum The 15-minute chart reveals an interesting shift in price behaviour. After reaching the 88.637 area, HYPE faced selling pressure that pushed it down to 87.507. However, buyers stepped in and drove a recovery through several green candles. Price has now returned to 88.141, but the latest candles suggest that momentum is meeting resistance rather than moving freely higher. This is where the next market decision becomes important. The Levels That Could Change the Picture - 88.354: Immediate resistance to watch. - 88.141: Current price and short-term decision area. - 87.789: Near-term support. - 87.507: Recent chart low and major downside reference. Two Sides of the Market BULLISH POSSIBILITY A sustained 15-minute close above 88.354 could strengthen the recovery and bring 88.637 back into focus. A break above that swing high would provide stronger evidence of continued buying pressure. BEARISH POSSIBILITY If HYPE fails to overcome resistance and falls below 87.789, the recovery could lose momentum. A deeper move may expose the 87.507 low again. The Analyst's Perspective The most interesting part of this chart is not simply the rebound. It is how price behaves after recovering from 87.507. Buyers have demonstrated a willingness to defend lower prices, but they still need to prove they can overcome nearby resistance. Rather than chasing the latest green candles, watching the next confirmed 15-minute close may offer a clearer picture. EMA, MACD, and volume indicator readings are not displayed, so this assessment focuses on visible price action. ONE QUESTION FOR THE COMMUNITY Is HYPE preparing for another push toward 88.637, or is this recovery simply a temporary pause before sellers return? Which level will determine your market bias? #BitcoinSlidesBelow$80K #NewFinancialPlatform #MidtermsMarketWatch #IMPACTbyTrade #BybitStocks $DOGEUSDT

XAUT Rebounds From 3,873.60: Bulls Face a Key Test $XAUTUSDT is trading at 3,875.79, up 0.03% over the last 24 hours. The session has recorded a high of 3,880.39, a low of 3,873.60, and 6.10M in turnover. A Sharp Rebound After Selling Pressure The 15-minute chart shows a relatively quiet market followed by a sudden bearish move. Several red candles pushed price down toward 3,873.60, where buying interest emerged. The latest candle shows a strong bullish recovery, lifting XAUT back to 3,875.79. This suggests buyers are responding to the dip, although one green candle is not enough to confirm a full trend reversal. Key Price Zones - 3,877.16: Immediate chart resistance. - 3,876.27: Near-term recovery level. - 3,874.49: First support area. - 3,873.60: Recent session low and key downside reference. Two Scenarios to Watch Bullish outlook: If buyers maintain momentum and secure a 15-minute close above 3,877.16, the recovery could strengthen and bring the 24-hour high of 3,880.39 back into focus. Bearish outlook: If the rebound loses strength and price falls below 3,874.49, sellers could attempt another test of 3,873.60. Market Insight XAUT is showing a recovery after a sharp intraday dip, but the market remains close to its recent support and resistance zones. The next candle closes will be important in determining whether this is the beginning of a stronger recovery or simply a temporary bounce. EMA, MACD, and volume indicator readings are not displayed, so this analysis is based on visible price action. What Is Your View? Can XAUT reclaim 3,877.16 and challenge 3,880.39, or will sellers push the price back toward 3,873.60? #IMPACTbyTrade #BybitStocks #MidtermsMarketWatch

BNB RECLAIMS MOMENTUM: 707.51 IS THE KEY TEST
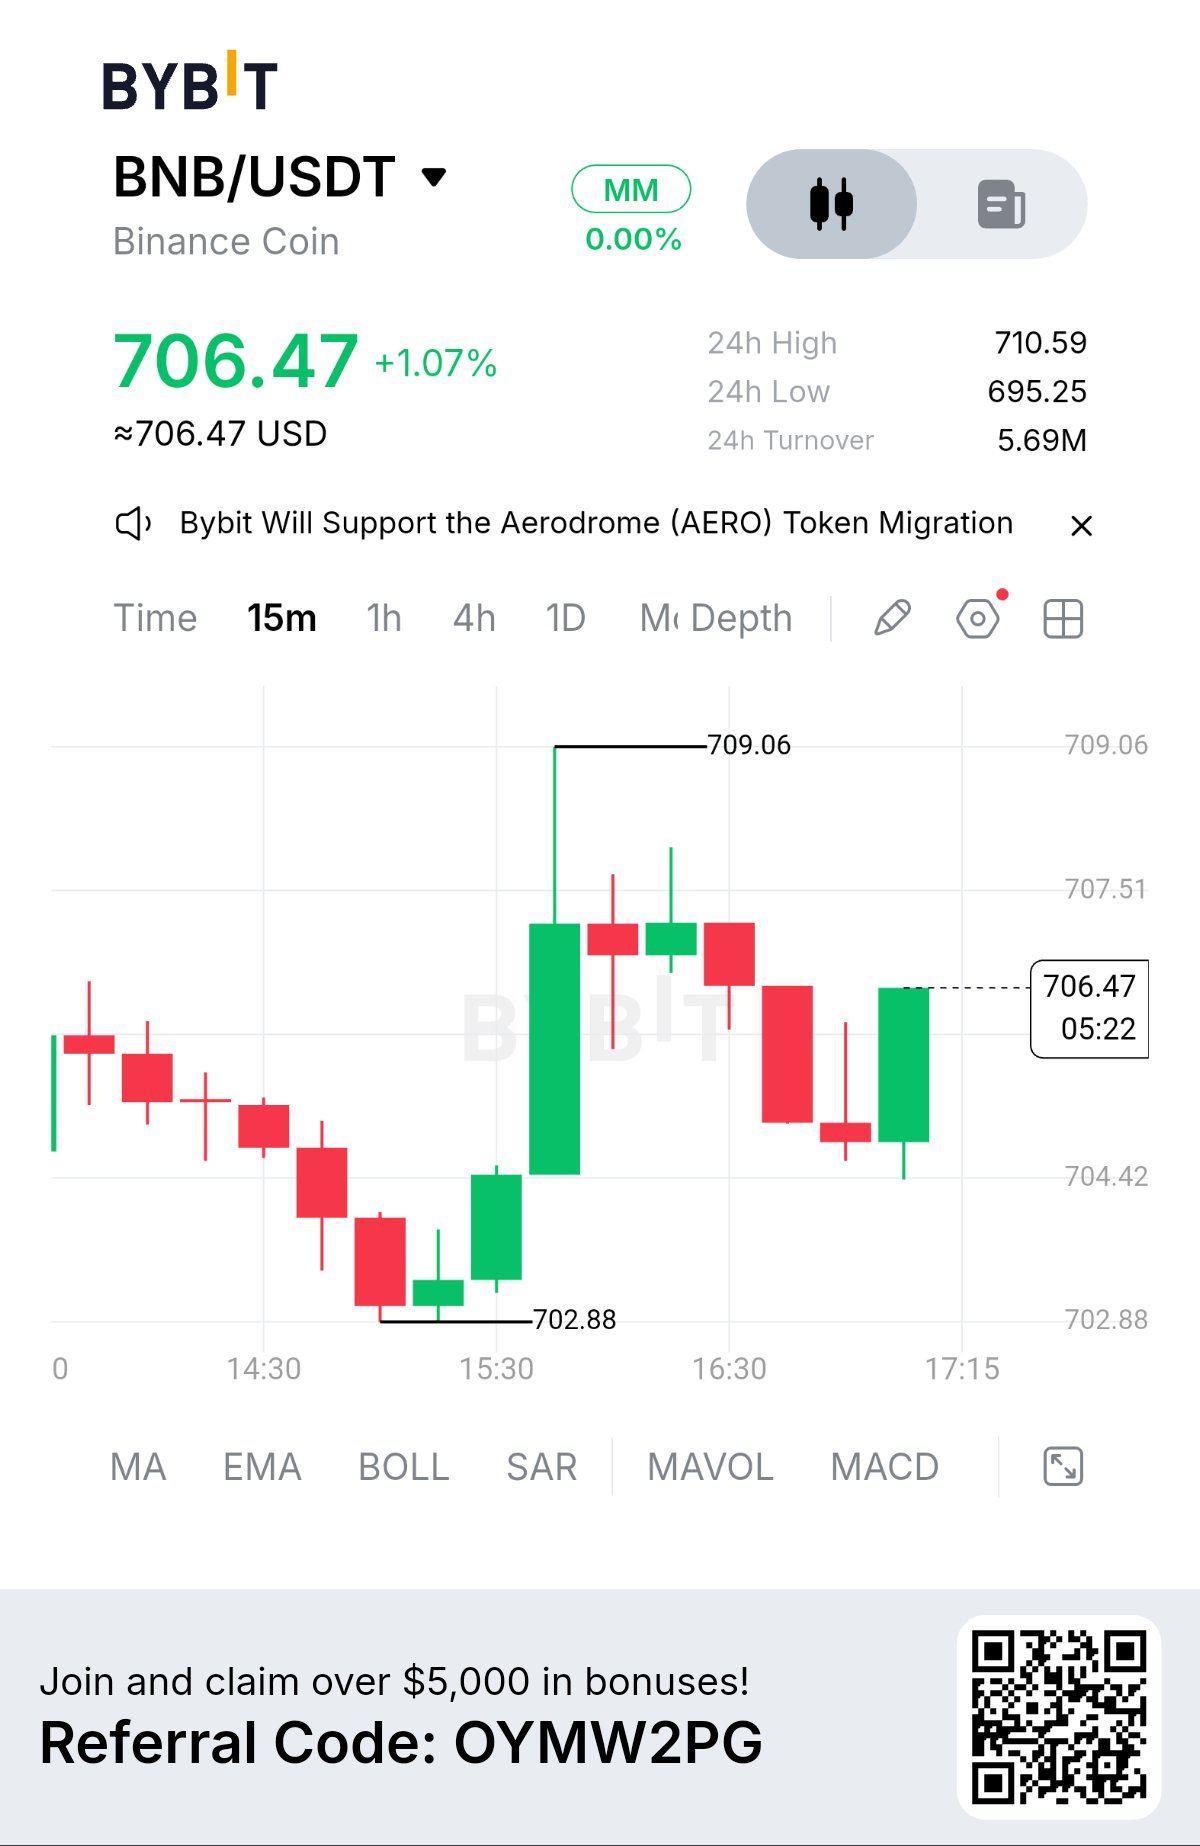
$BNBUSDT is trading at 706.47, up 1.07% over the past 24 hours. The session has recorded a high of 710.59, a low of 695.25, and 5.69M in turnover. Recovery Meets Resistance The 15-minute chart shows a volatile recovery after price tested the 702.88 area. Buyers responded with a strong upward impulse, lifting BNB toward 709.06 before momentum slowed. The latest bullish candle has engulfed the previous red candle's body, suggesting renewed buying interest. However, this recovery is still facing resistance, so confirmation remains essential. Three Levels That Matter - 707.51: Immediate resistance and the next bullish confirmation point. - 704.42: Near-term support that buyers need to defend. - 702.88: Recent structural low and an important downside reference. What Could Happen Next? Bullish case: A sustained 15-minute close above 707.51 could open the way for a retest of 709.06. Holding above the reclaimed level would strengthen the recovery. Bearish case: If BNB loses 704.42, the latest buying response may weaken, exposing the 702.88 area again. Market Perspective The current candle shows buying strength, but one bullish candle does not establish a confirmed trend reversal. With price trading beneath 707.51, patience may be more valuable than chasing the move. EMA, MACD, and volume readings are not visible in the supplied chart, so this assessment is based on price action and the stated levels. Your View Matters Will BNB break above 707.51 and challenge 709.06, or will sellers push price back below 704.42? Which level are you watching most closely? #BybitStocks #IMPACTbyTrade
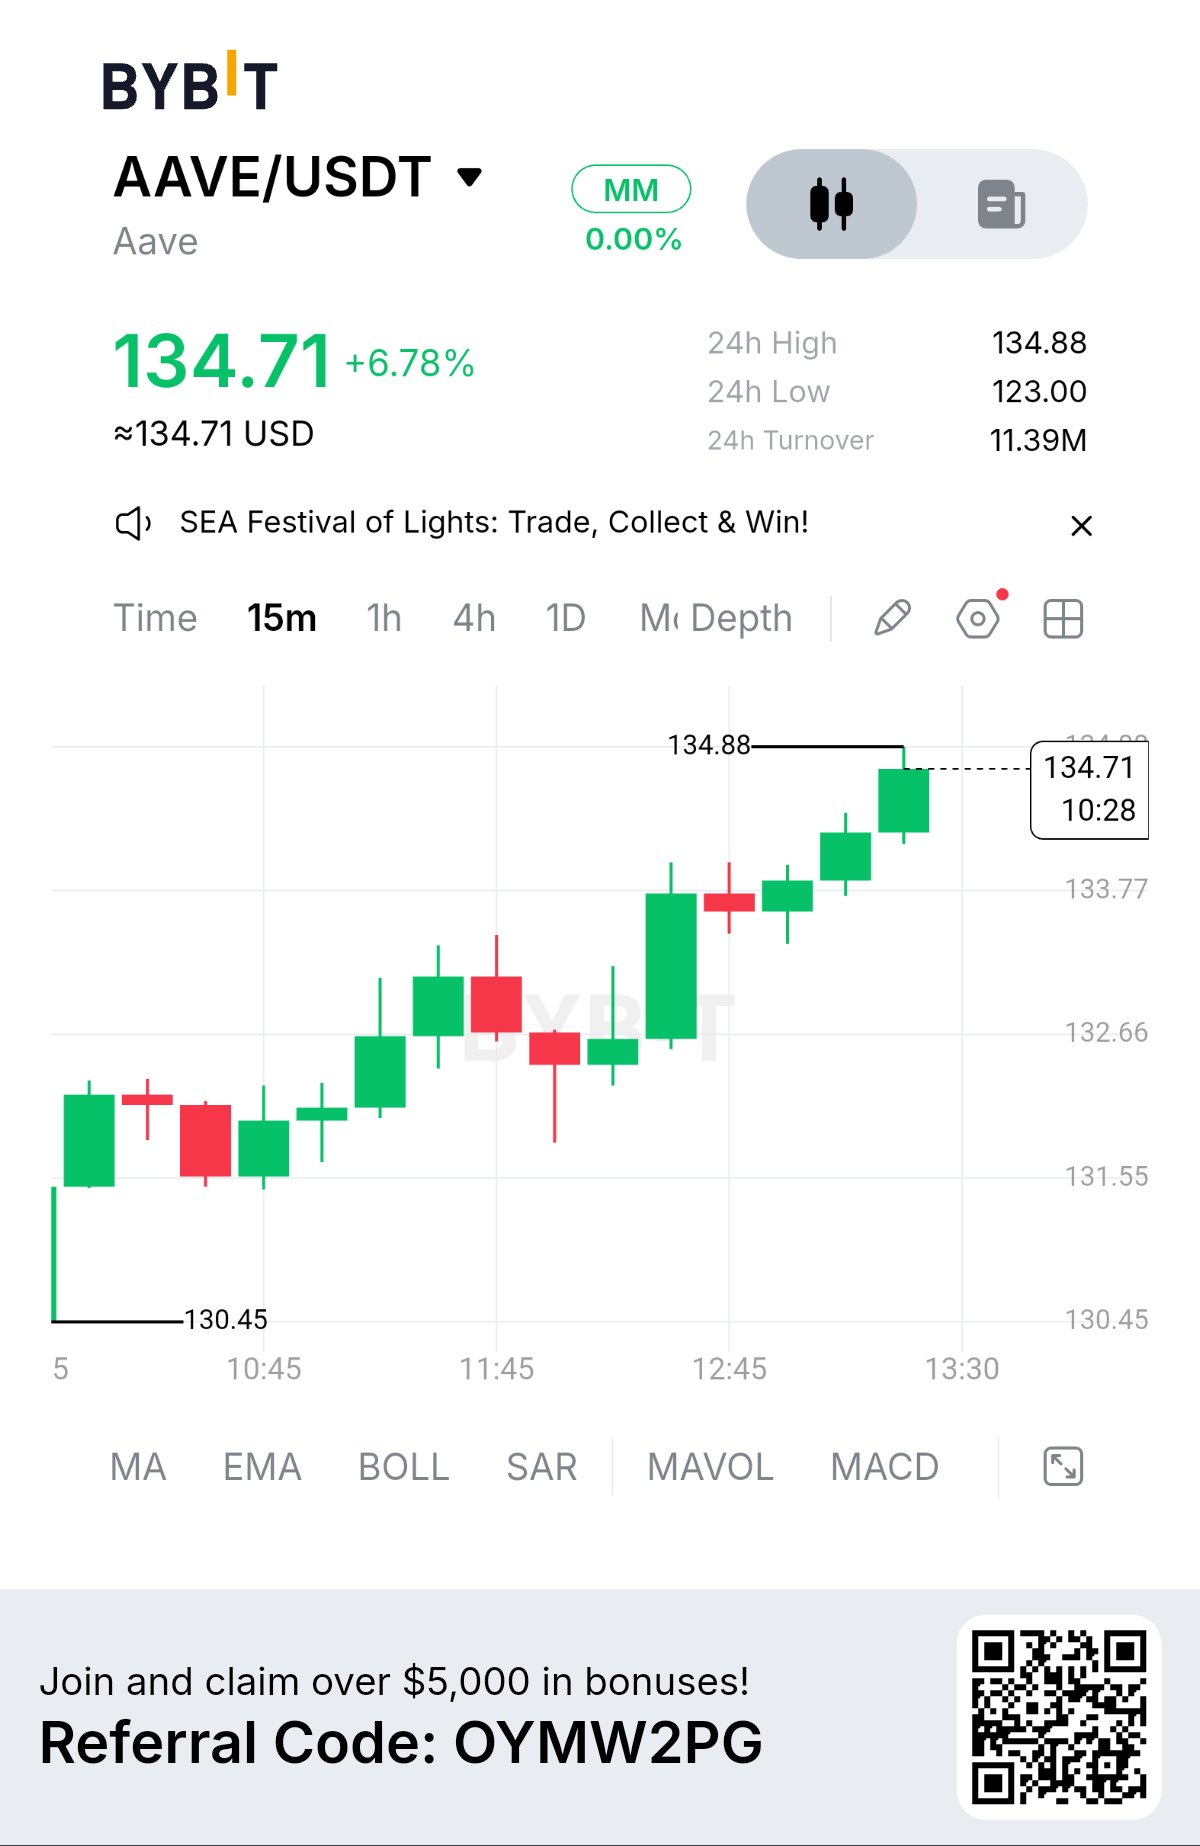
AAVE at 134.71: Breakout Strength Meets Resistance
$AAVEUSDT is showing strong bullish momentum on the 15-minute chart, trading at 134.71 with a 24-hour gain of 6.78%. The asset has moved between 123.00 and 134.88, recording 11.39M in 24-hour turnover. Price action is now approaching the upper boundary of the current session range. The Structure Behind the Rally Since recovering from the 130.45 session-area low, AAVE has formed a sequence of higher highs and higher lows. Pullbacks have remained relatively shallow, suggesting that buyers are still defending the short-term trend. However, price is now testing 134.88, a level that could determine whether the rally extends or pauses. Critical Levels to Watch - Resistance: 134.88 - First support: 133.77 - Structural support: 132.66 Two Possible Outcomes Bullish continuation: A confirmed 15-minute close above 134.88 could strengthen the case for another upward move. Holding above the breakout area would be important for continuation. Potential pullback: Failure to clear 134.88 could trigger short-term profit-taking. A move below 133.77 would weaken the immediate structure and bring 132.66 into focus. What Matters Now The rally is strong, but strength alone does not guarantee continuation. Chasing price directly beneath resistance carries risk, especially without confirmation from volume or momentum indicators. EMA, MACD, and volume readings are not available in the supplied chart data, so the analysis remains focused on visible price structure. The Bigger Question AAVE is approaching 134.88 after a strong stair-step rally. Will buyers secure a confirmed breakout, or will sellers force a pullback toward 133.77? The next 15-minute closes may provide the clearest clue. #BybitStocks #IMPACTbyTrade
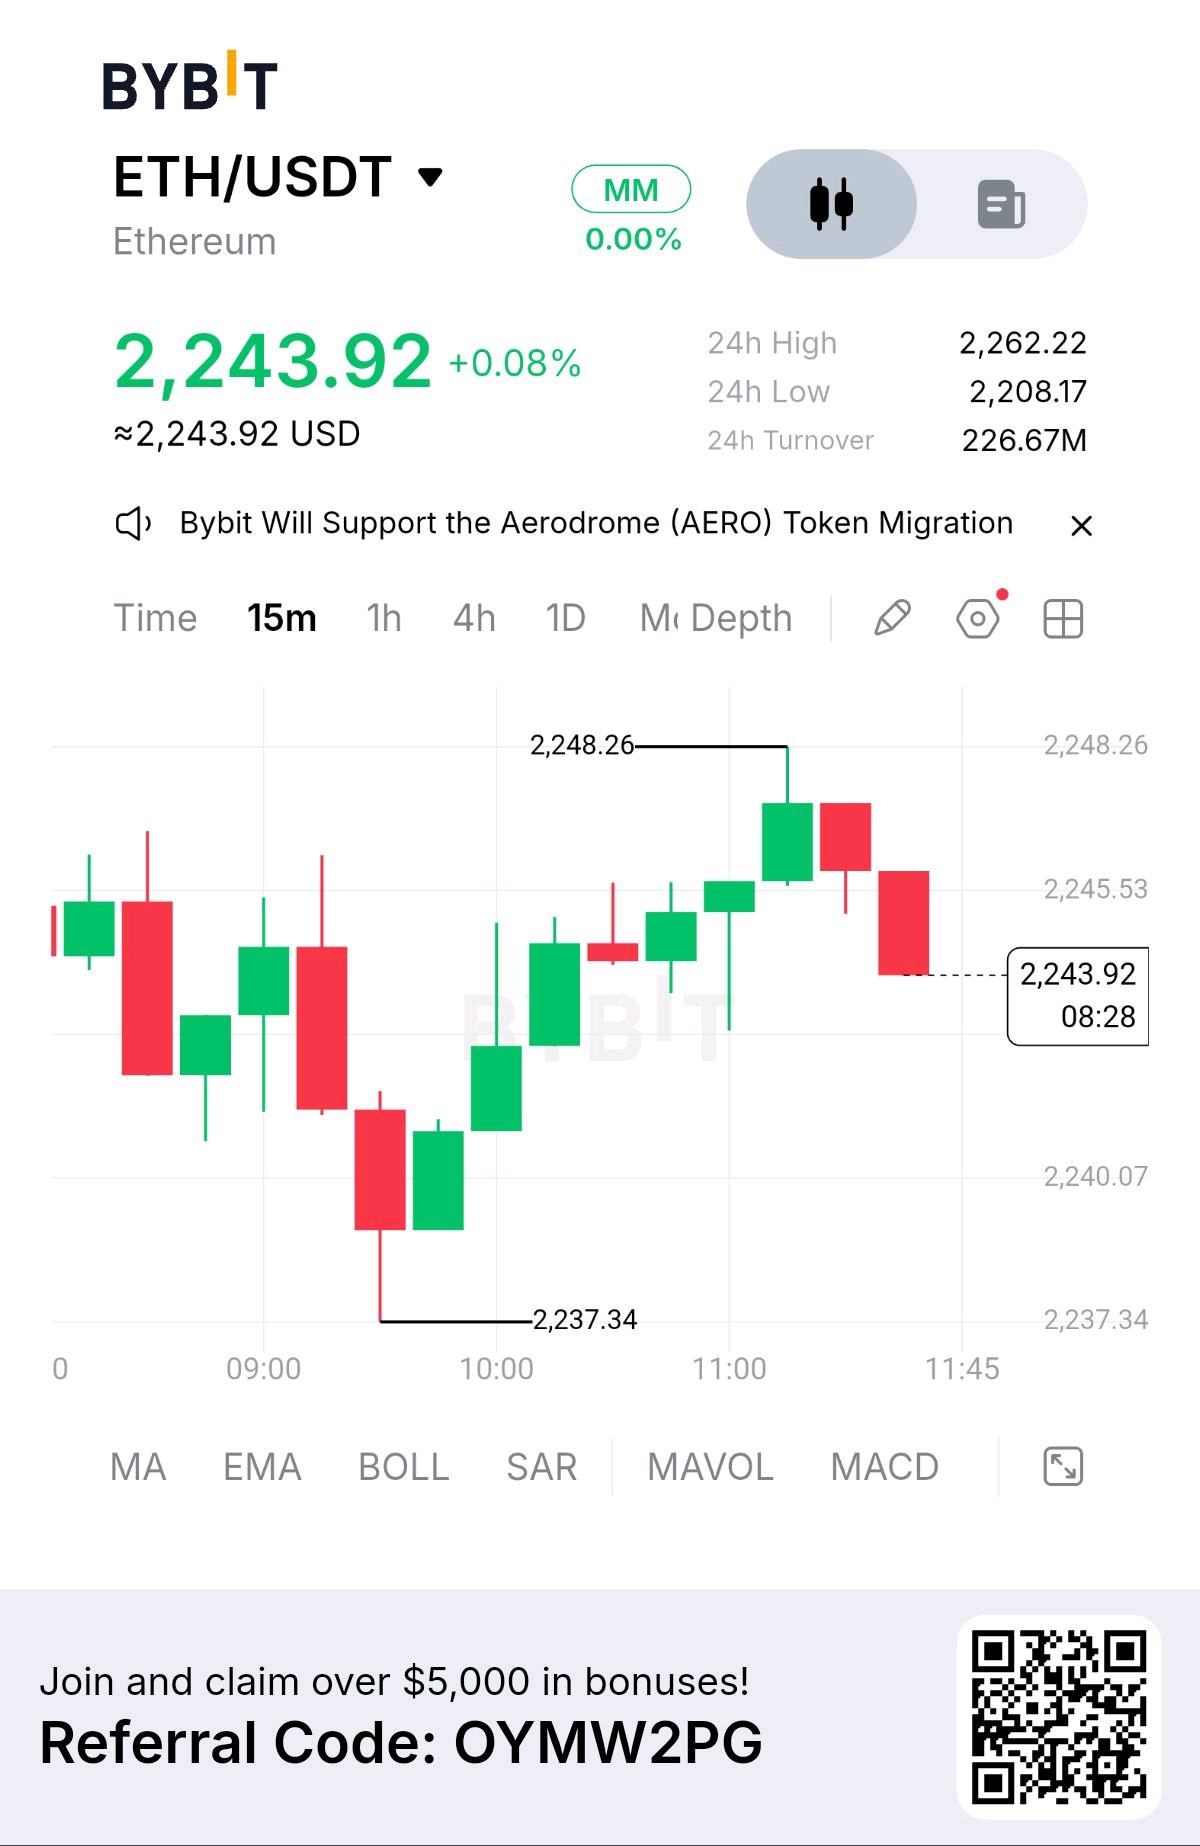
ETH at 2,243: Can Buyers Protect the Recovery?
$ETHUSDT is trading at 2,243.92, marginally up 0.08% over the last 24 hours. The session high stands at 2,262.22, while the low is 2,208.17. Trading turnover has reached 226.67M. Bullish Momentum Faces a Reality Check On the 15-minute chart, ETH staged a recovery from 2,237.34, building a sequence of higher highs before reaching 2,248.26. However, the rally encountered rejection around that local peak. A strong bearish candle followed, pulling price back toward 2,243.92 and raising questions about the strength of the recovery. The latest candle shows a lower wick, suggesting some buying interest near the current price. Still, buyers need to demonstrate that they can defend the nearby support zone. Key Levels to Watch - Immediate resistance: 2,245.53 - First support: 2,240.07 - Structural support: 2,237.34 - Recent local high: 2,248.26 The Next Move Bullish Scenario: If ETH holds above 2,240.07 and produces a convincing 15-minute close above 2,245.53, buyers could regain short-term momentum and attempt another test of 2,248.26. Bearish Scenario: A decisive close below 2,240.07 would weaken the recovery structure and expose the 2,237.34 session low to another test. Market Insight ETH is approaching an important decision zone. The rejection at 2,248.26 shows that buyers are facing resistance, but the pullback has not yet confirmed a full bearish reversal. A successful defense of 2,240.07 could preserve the recovery attempt. A breakdown, however, would shift short-term attention back toward the sellers. EMA, MACD, and volume readings are not visible, so this analysis is based on the displayed price action and key levels. Your Perspective Will ETH defend 2,240.07 and reclaim 2,245.53, or are sellers preparing to push the price back toward 2,237.34? #WSOT2026 #IMPACTbyTrade $ETHUSDC
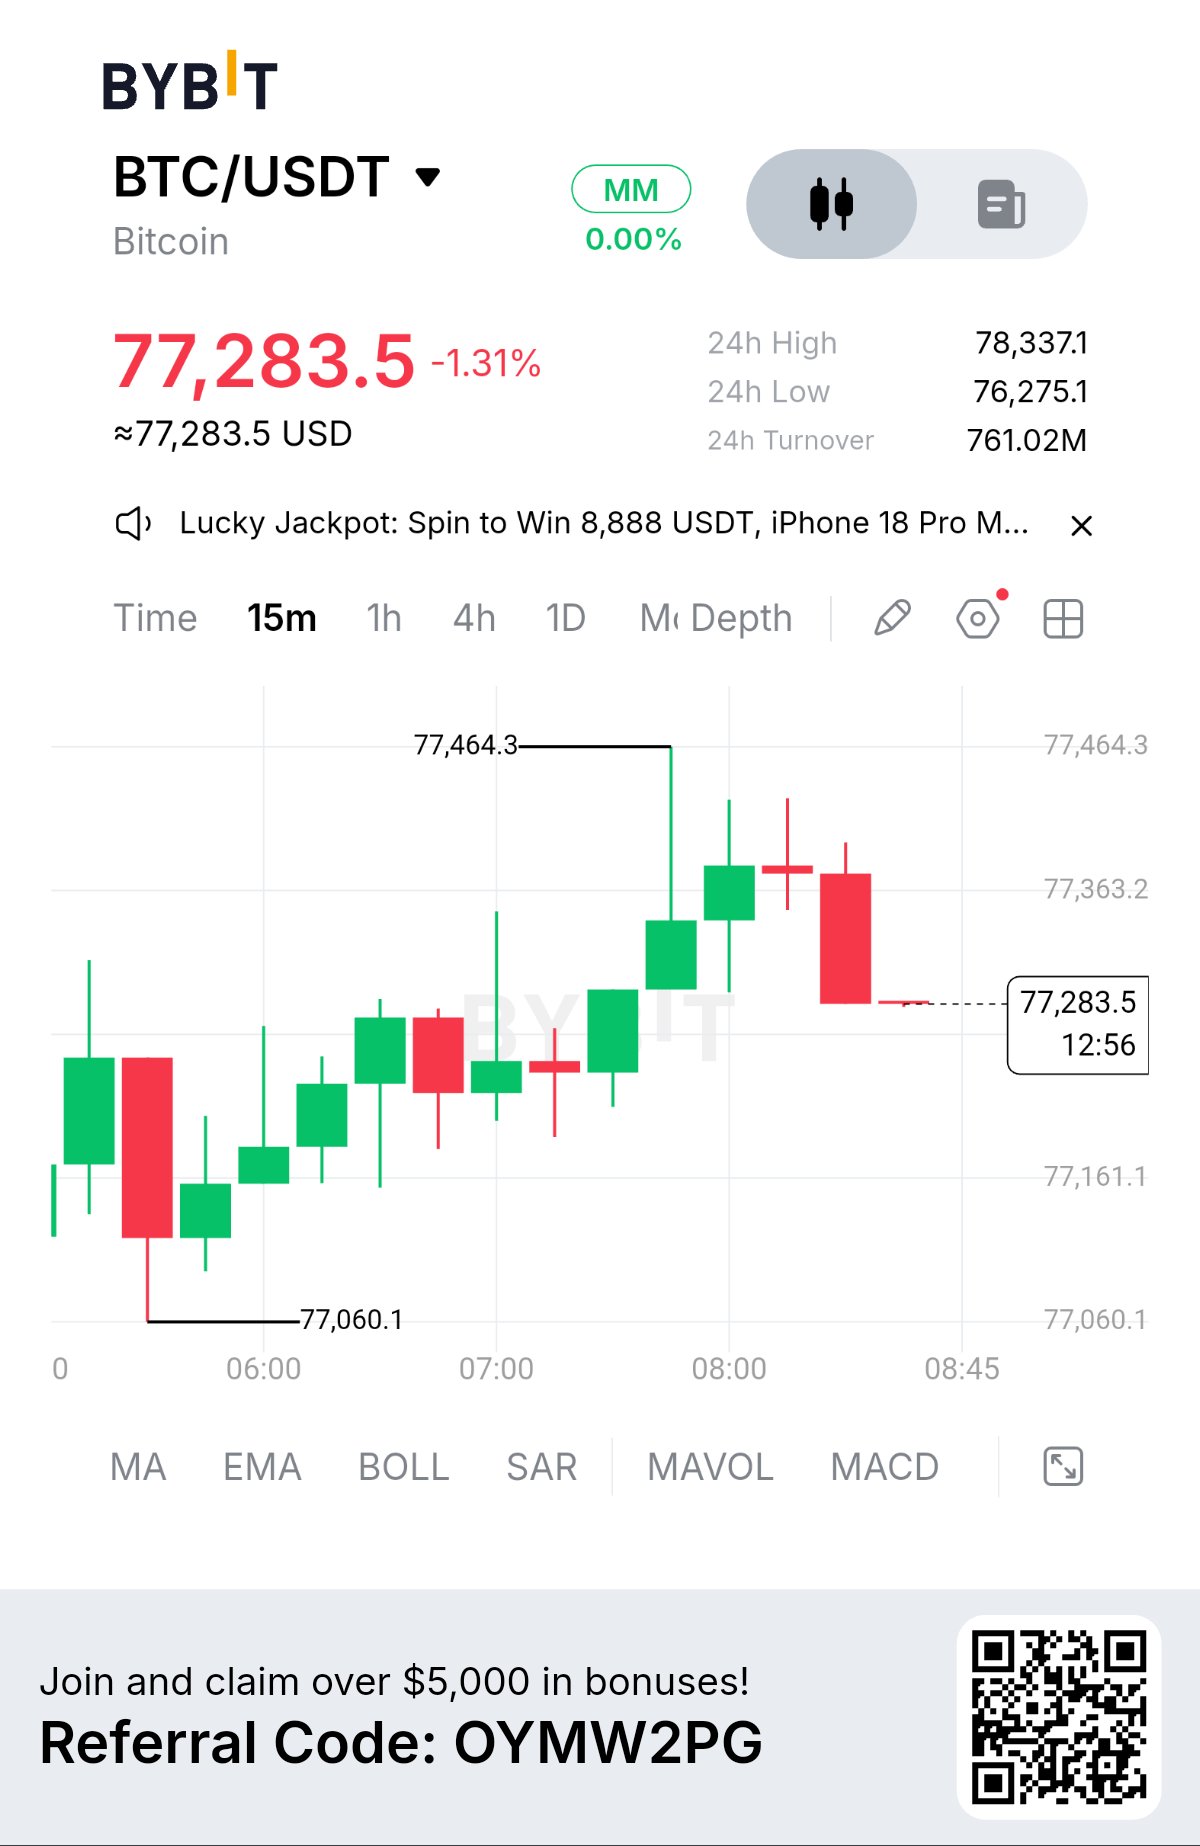
BTC at 77.28K: Rejection Puts Bulls Under Pressure
Market Snapshot $BTCUSDT is trading at 77,283.5, down 1.31% over the last 24 hours. The session high stands at 78,337.1, while the low is 76,275.1. Trading turnover has reached 761.02M. A Recovery Faces Its First Major Test On the 15-minute timeframe, BTC attempted to recover from the 77,060.1 low, forming higher highs and higher lows before reaching 77,464.3. However, that recovery encountered strong rejection. A large bearish candle erased much of the latest upward move, bringing price back toward 77,283.5. This signals weakening short-term bullish momentum, although the broader direction will depend on how price reacts around the nearby support levels. Critical Levels - Immediate resistance: 77,363.2 - First support: 77,161.1 - Structural support: 77,060.1 - Rejection high: 77,464.3 What Could Happen Next? Bullish Scenario: If BTC holds above 77,161.1 and produces a strong 15-minute close above 77,363.2, buyers could regain short-term momentum and attempt another test of 77,464.3. Bearish Scenario: A decisive close below 77,161.1 would weaken the recovery structure and bring the 77,060.1 low back into focus. Market Perspective The rejection at 77,464.3 is an important warning for buyers. The latest bearish candle shows that sellers responded aggressively near the local high, but one candle alone does not confirm a complete trend reversal. The next confirmation must come from price action around 77,363.2 and 77,161.1. EMA, MACD, and volume readings are not visible, so this assessment relies on the displayed price structure. The Question That Matters Can BTC reclaim 77,363.2 and restart its recovery, or will sellers push price below 77,161.1 and challenge the session low again? #IMPACTbyTrade #BybitStocks $BTCUSDC

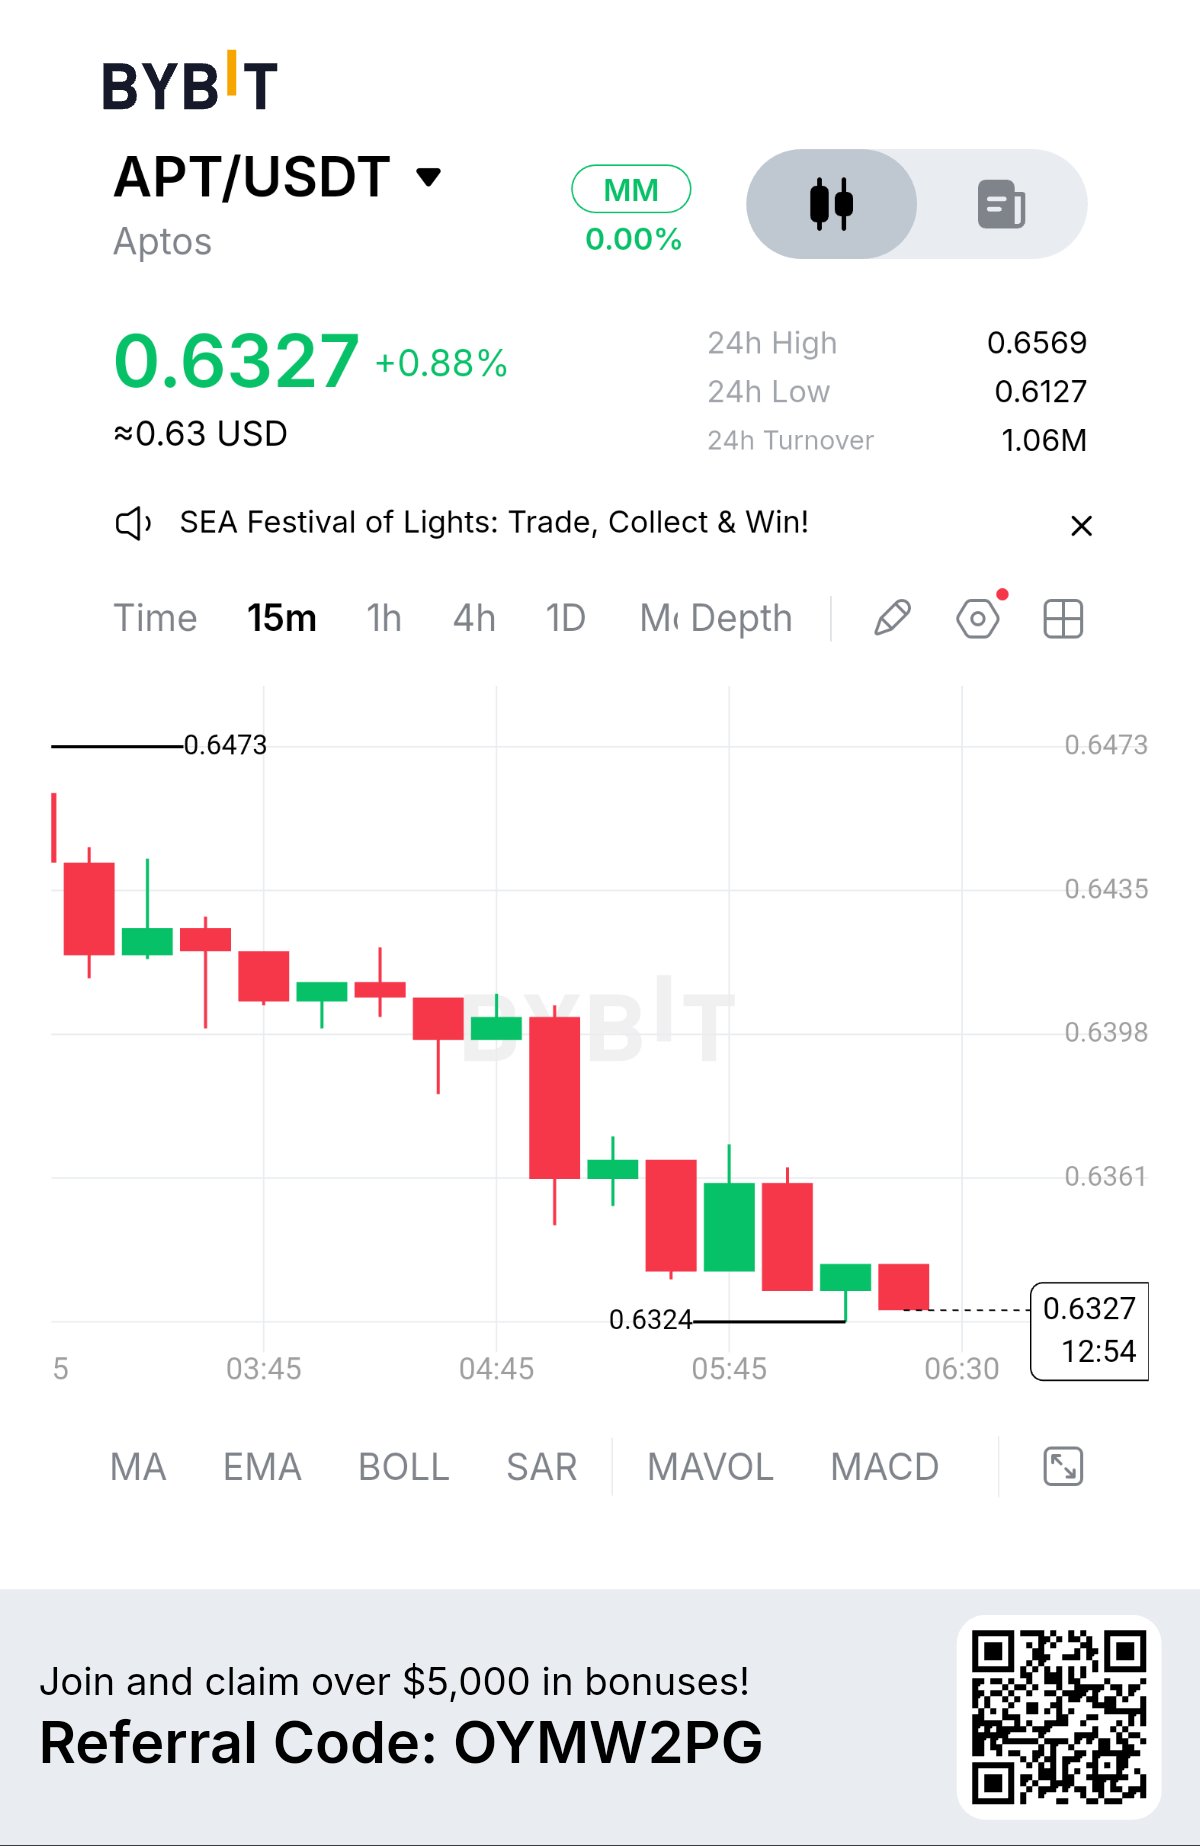
APT at 0.6327: Bears Pressure a Critical Support
$APTUSDT is trading at 0.6327, up 0.88% over the last 24 hours. The session high stands at 0.6569, while the low is 0.6127. Trading turnover has reached 1.06M. Short-Term Momentum Remains Weak Despite its positive daily performance, APT is showing a bearish structure on the 15-minute chart. After reaching 0.6473, price began forming lower highs and lower lows, gradually surrendering its recent gains. It is now trading close to the local support at 0.6324. The latest candles have become smaller, suggesting hesitation as price tests this level. However, this pause alone does not confirm that buyers are taking control. Key Levels to Monitor - Immediate resistance: 0.6361 - Critical support: 0.6324 - Deeper support: 0.6127 Two Possible Market Outcomes Bullish Scenario: If buyers defend 0.6324 and push APT above 0.6361 with a convincing 15-minute close, a short-term recovery could develop. This would be the first meaningful sign of improving momentum. Bearish Scenario: A decisive close below 0.6324 would weaken the current support and increase the possibility of further downside, with 0.6127 as the next major reference level. What Makes This Setup Important? Small candles near support can signal reduced selling momentum, but they can also represent a temporary pause before another decline. The next confirmed move matters more than guessing the direction. EMA, MACD, and volume readings are not displayed, so the analysis is based on visible price action and market structure. The Key Question Will APT defend 0.6324 and reclaim 0.6361, or are sellers preparing another breakdown? Which level are you watching most closely? #IMPACTbyTrade #BybitStocks #PiecesOf8
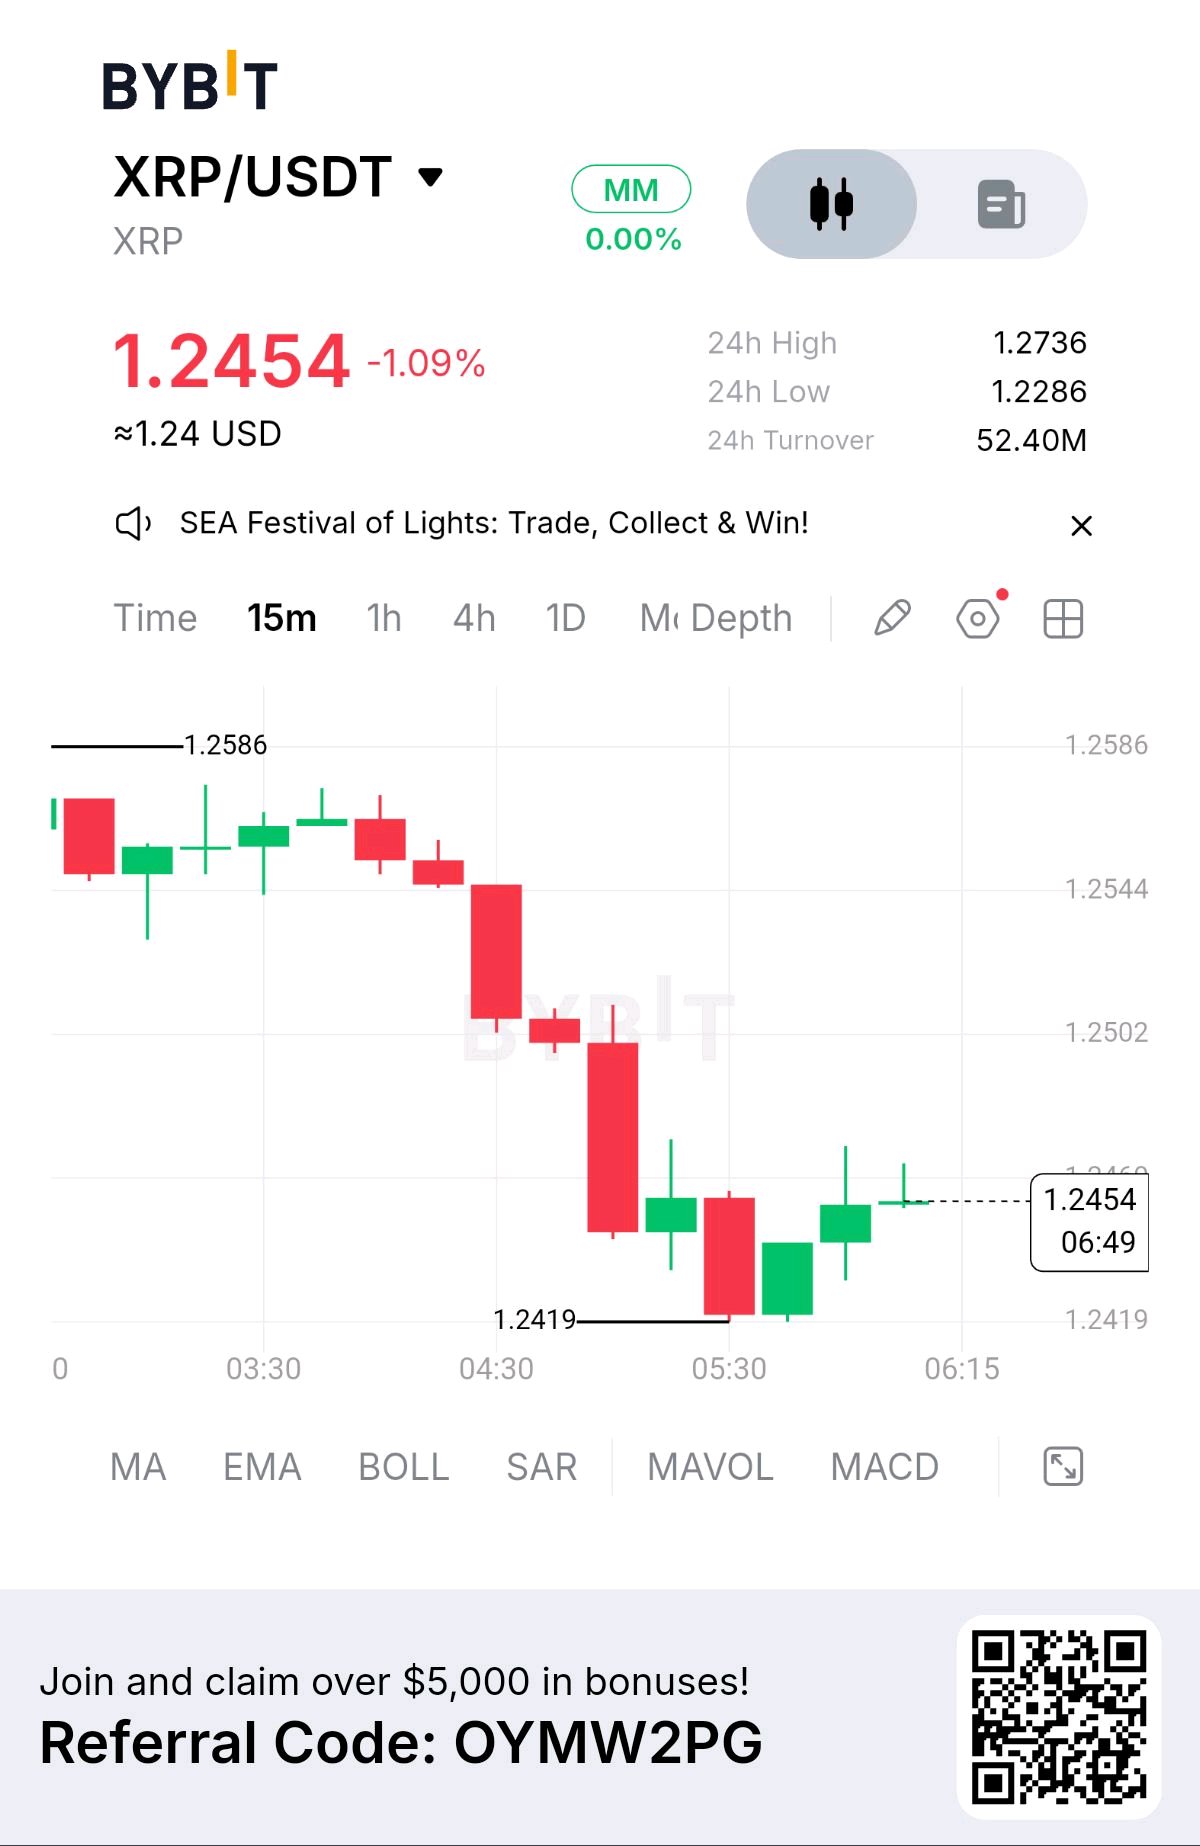
XRP HOLDS 1.2419: IS A RECOVERY TAKING SHAPE?
Market Snapshot XRP/USDT is trading at 1.2454, down 1.09% over the last 24 hours. The session high is 1.2736, while the low stands at 1.2286. Trading turnover has reached 52.40M. A Pause After Heavy Selling On the 15-minute timeframe, XRP is attempting to stabilize after a sharp decline from the 1.2586 area. The sell-off created a sequence of lower highs and lower lows before reaching a local floor at 1.2419. Since then, price has moved into a tighter range around 1.2450. Smaller candles and repeated lower wicks suggest buyers are responding near support, but the market has yet to establish a confirmed bullish reversal. Three Levels That Matter - Immediate resistance: 1.2502 - Critical local support: 1.2419 - Deeper support: 1.2286 - Potential recovery reference: 1.2544 The Battle for Direction Bullish Outlook: A strong 15-minute close above 1.2502 would be an important sign that buyers are regaining control. If momentum continues, 1.2544 becomes the next level to watch. Bearish Outlook: If XRP loses 1.2419 with a decisive candle close, the current stabilization may fail. That could expose the 1.2286 level as the next major downside reference. What the Price Action Reveals The transition from aggressive selling to smaller candles suggests that downward momentum may be slowing. However, a pause in selling is not the same as a confirmed change of trend. The next decisive move around 1.2502 or 1.2419 could provide a clearer picture of market direction. EMA, MACD, and volume readings are not visible, so this assessment is based on price action alone. Your Market View Is XRP building a foundation for recovery above 1.2502, or should traders remain cautious until buyers prove they can defend 1.2419? #IMPACTbyTrade #BybitStocks
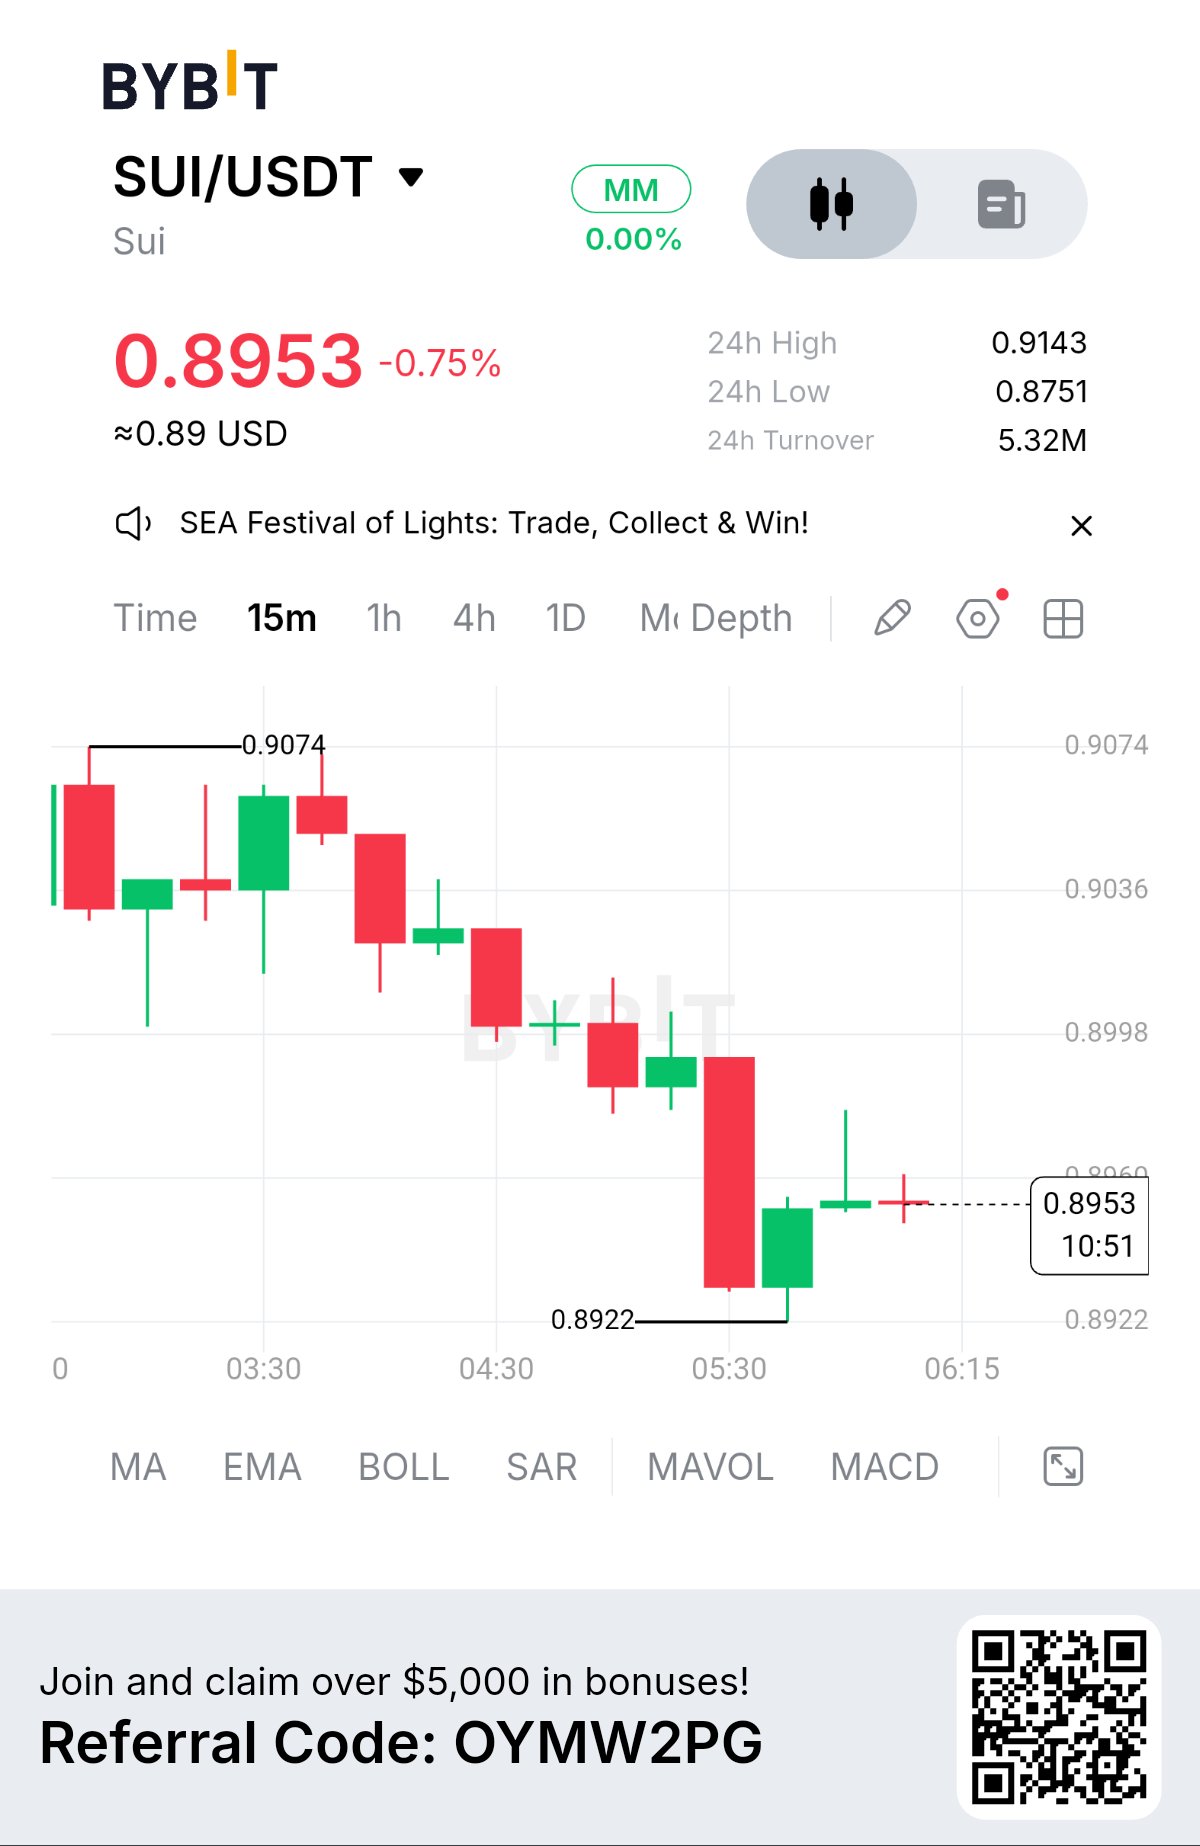
SUI AT 0.8953: BUYERS FACE A CRITICAL SUPPORT Test
Market Snapshot $SUIUSDT is trading at 0.8953, down 0.75% over the last 24 hours. The session high stands at 0.9143, while the low is 0.8751. Trading turnover has reached 5.32M. Sellers Still Have the Advantage On the 15-minute timeframe, SUI has maintained a bearish structure since reaching 0.9074. A sequence of lower highs and lower lows has pushed price toward 0.8922, where buyers have started showing some resistance. A strong green candle with a long lower wick appeared around this level, followed by a small red candle. This suggests a pause in selling pressure, but the broader structure has not yet turned bullish. Key Levels in Focus - Immediate resistance: 0.8998 - Critical support: 0.8922 - Potential recovery zone: 0.9036 - Deeper support: 0.8751 Two Paths for SUI Bullish Recovery: Buyers need to defend 0.8922 and secure a convincing 15-minute close above 0.8998. If successful, this could create room for a move toward 0.9036. Bearish Continuation: A decisive close below 0.8922 would weaken the current support and expose SUI to further downside, with 0.8751 becoming an important reference level. The Market Signal The rejection wick at 0.8922 deserves attention, but one candle cannot confirm a trend reversal. The real test is whether buyers can reclaim 0.8998 and establish a higher short-term structure. Until that happens, caution remains important because the prevailing 15-minute trend is still bearish. What is your next move on SUI: are you watching for a confirmed recovery above 0.8998, or do you expect sellers to break 0.8922 first? #IMPACTbyTrade #BybitStocks #MidtermsMarketWatch #WSOTPicktoEarn10U $SUIUSDC
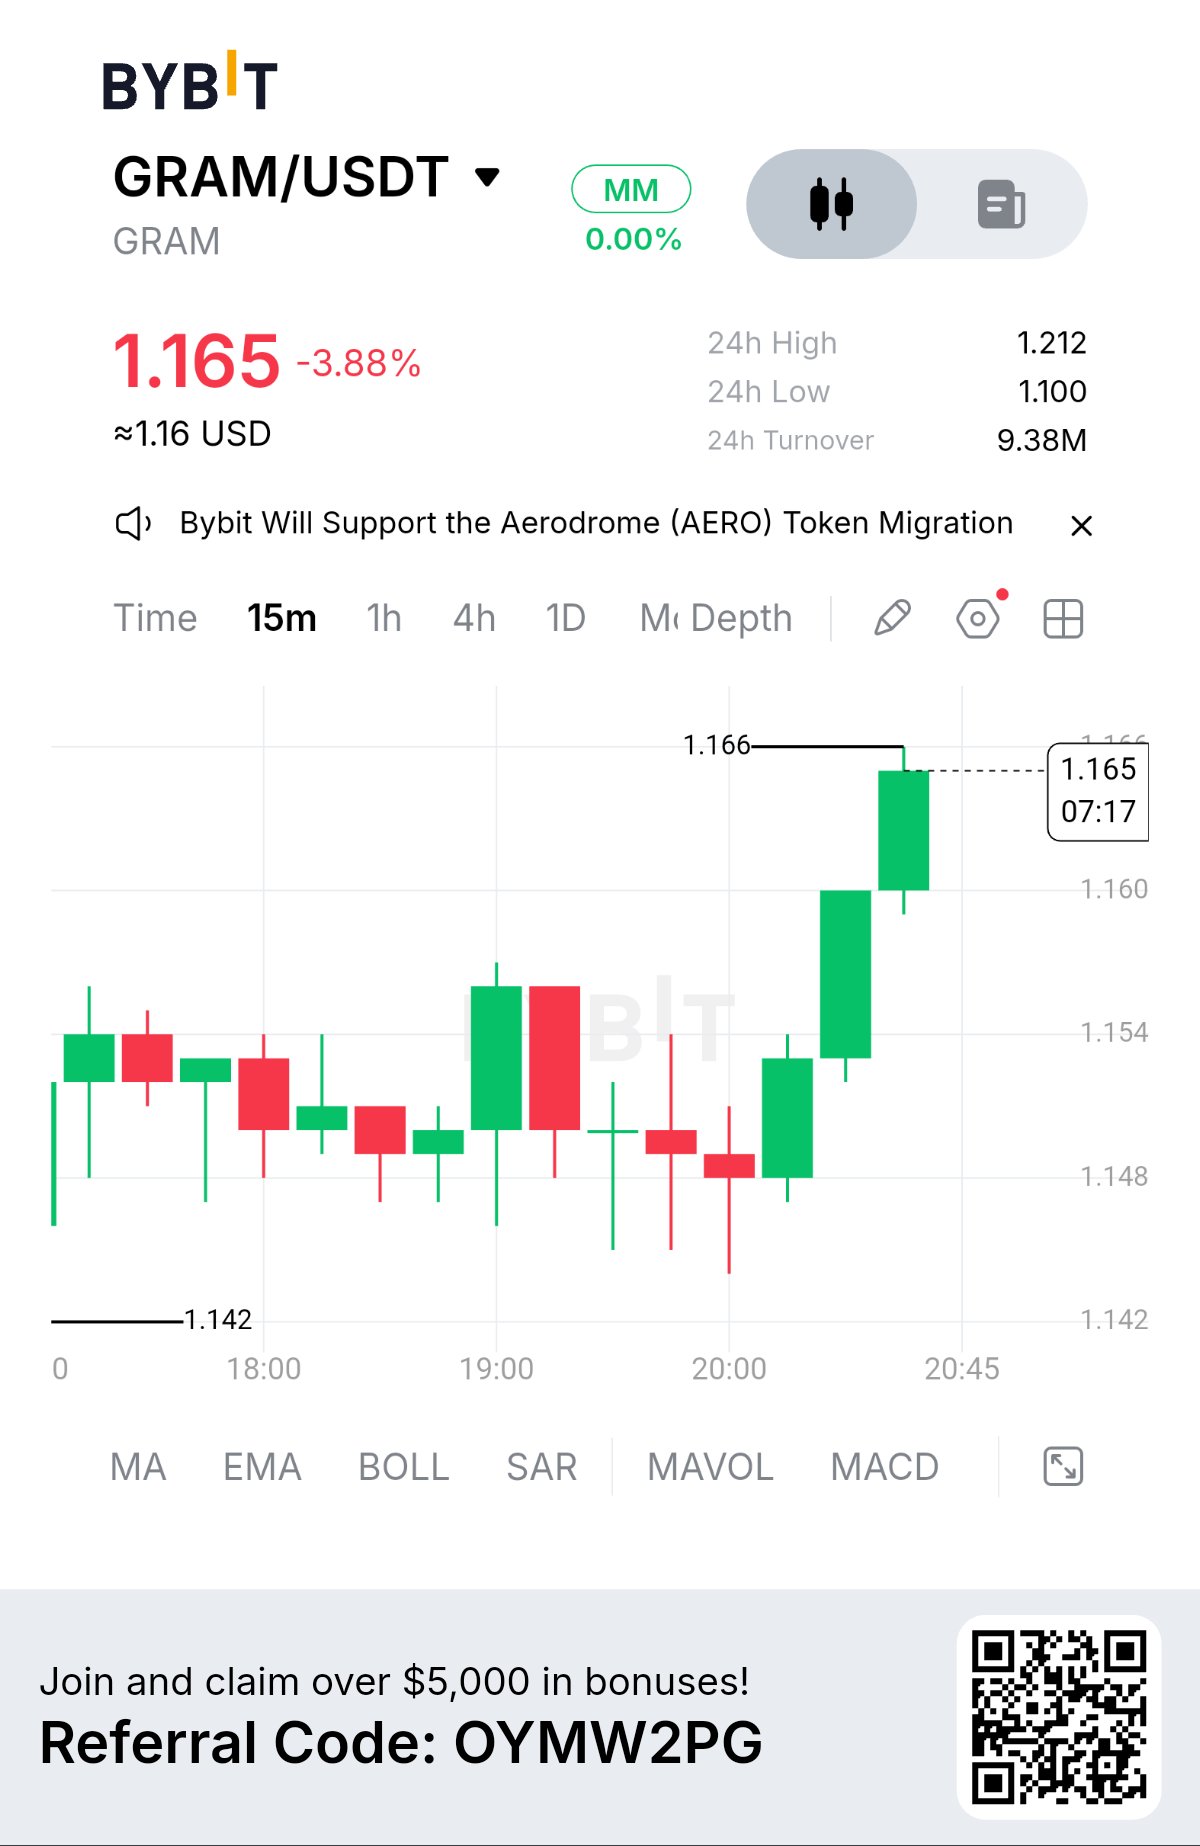
GRAM Breaks Higher: Can Bulls Clear 1.166?
Market Snapshot $GRAMUSDT is trading at 1.165, down 3.88% over the last 24 hours. The session high stands at 1.212, while the low is 1.100. Trading turnover has reached 9.38M. Momentum Shifts After Consolidation GRAM has made a sharp upward move after spending time consolidating around the lower price region. Three consecutive bullish candles have lifted the price from around 1.148 toward 1.166, showing a clear increase in short-term buying momentum. However, the market is now approaching a local resistance level where the next move needs confirmation. Critical Levels - Immediate resistance: 1.166 - First support: 1.160 - Consolidation support: 1.148 - Additional downside reference: 1.154 - 24-hour high: 1.212 The Next Move: Breakout or Pullback? Bullish Scenario: If GRAM holds above 1.160 and secures a convincing 15-minute close above 1.166, the breakout attempt could gain further strength. The 24-hour high at 1.212 would become a potential upside reference. Bearish Scenario: A rejection around 1.166 could trigger short-term profit-taking. If price loses 1.160, attention may shift toward 1.154 and the broader 1.148 consolidation base. What Traders Should Watch The strength of the recent candles is encouraging for buyers, but momentum alone does not confirm a sustained breakout. A successful retest of 1.160 or a confirmed close above 1.166 would provide stronger evidence of continuation. With EMA, MACD, and volume readings unavailable, the analysis remains focused on visible price action. The Key Question Will GRAM break above 1.166 and extend its recovery toward 1.212, or will buyers need a pullback to 1.160 before the next attempt? #BybitStocks #MidtermsMarketWatch #IMPACTbyTrade