ZIV OREN
$ZROUSDT — One day after FameEX opened spot trading for LayerZero, the token is still struggling to translate expanding exchange access into stronger price action. The October 28 listing added another venue for ZRO/USDT trading, with deposits, spot trading, and withdrawals scheduled to become available. That is a measurable improvement in accessibility. But access and demand are different things. A new trading venue does not automatically produce deeper liquidity, sustained buying pressure, or a stronger market structure. The broader narrative is becoming more substantial. LayerZero is preparing to launch its Zero blockchain and ATLAS exchange infrastructure, while its October research updates have highlighted progress in post-quantum cryptography. These developments strengthen the project's infrastructure story, but their implications for ZRO's actual market demand remain a separate question. Technical progress across an ecosystem does not necessarily translate into immediate value for its token. The price action makes that distinction difficult to ignore. ZRO is trading around $1.62–$1.69, depending on the market and data snapshot, after closing near $1.79 on October 22. That represents a decline of roughly 9% over seven days. Against its September 29 close near $1.56, however, it remains approximately 4% higher over 30 days. The short-term structure has weakened even though the broader monthly comparison is still positive. There are several possible explanations for this disconnect: profit-taking after earlier gains, selling pressure following token unlocks, short-term positioning, thin order books, or accumulation that is not yet visible in the price. These remain possibilities, not established causes. The available price data alone cannot distinguish between them. The important levels are straightforward. ZRO closed around $1.79 one week ago and $1.56 one month ago. Recent trading has tested the $1.60 area, making it an immediate reference point. A sustained breakdown below $1.60 would weaken the argument that buyers are absorbing supply; a move toward the September low near $1.48 would put the current monthly recovery under considerably more pressure. The question is whether expanding infrastructure, new exchange access, and ecosystem development can translate into durable demand for ZRO itself. The next real test is not another announcement. It is whether price can hold support while trading activity demonstrates that demand is actually improving. #ByXIMPACT

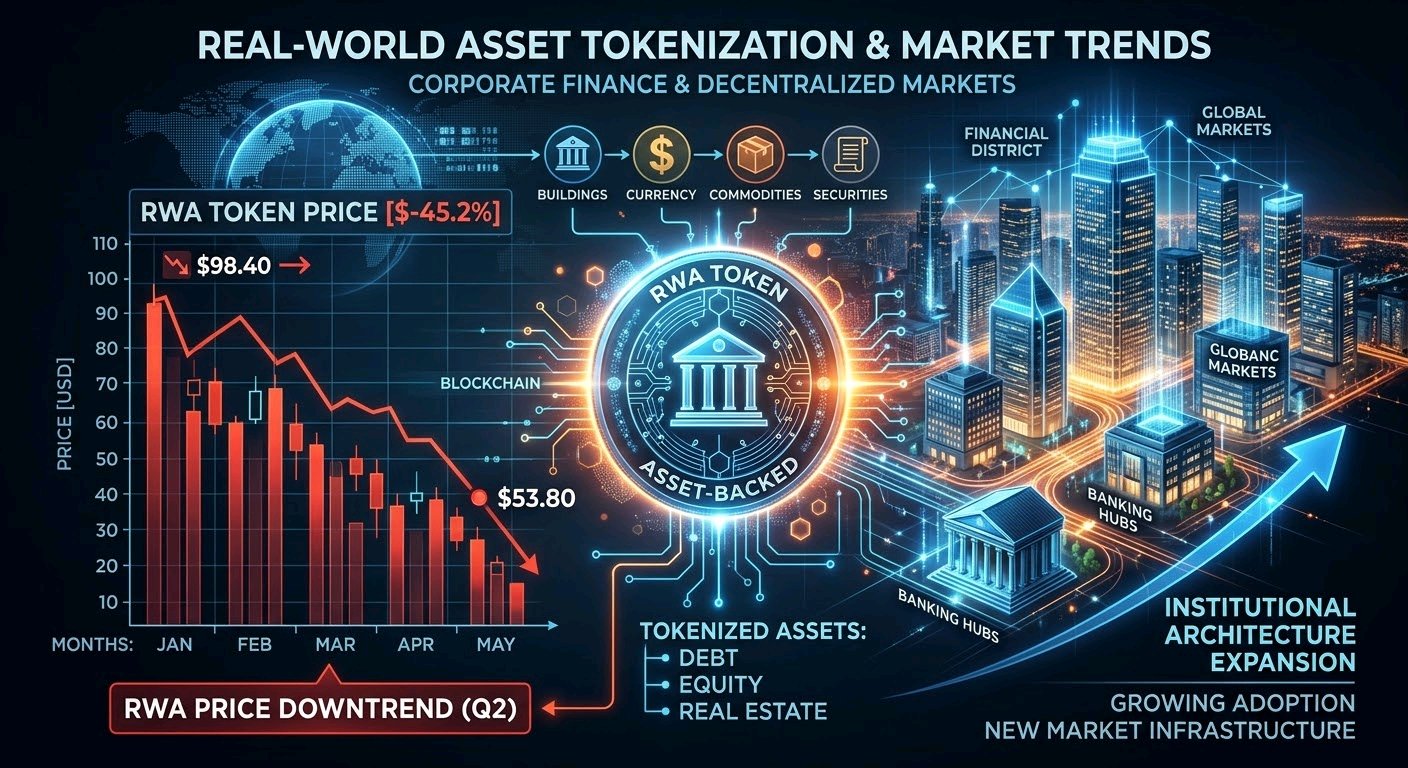
$ONDOUSDT : Weeks of Institutional Expansion, Yet the Token Tells a Different Story Nearly four weeks after Ondo Finance introduced its private-market investment initiative on October 5, the practical outcome is becoming clearer: the ecosystem continues expanding its tokenized investment offerings, but ONDO itself has not translated that progress into sustained price strength. The distinction matters. Ondo's recent developments include tokenized stocks on Robinhood Chain, new investment portfolios, and infrastructure connected to traditional financial markets. These developments expand the ecosystem's reach. They do not automatically improve ONDO's exchange liquidity, create direct demand for the governance token, or establish a durable price floor. Product distribution and token demand remain separate questions. That is the gap worth watching. Institutional language, broader distribution, and access to traditional financial exposure create a compelling narrative around real-world asset tokenization. But ecosystem adoption is not the same as token adoption. The market still needs evidence that these developments translate into measurable demand for ONDO itself. Price action reinforces that distinction. ONDO trades near $0.42, down approximately 10% over seven days and 19% over 30 days. Around October 21, it traded near $0.465; around September 28, it was near $0.509. The decline has continued despite the steady flow of ecosystem announcements. That is not necessarily a contradiction, but it does suggest that positive headlines alone have not been sufficient to reverse the broader price trend. Several explanations remain possible: broader market weakness, profit-taking, token-supply expectations, short positioning, or limited incremental demand at current valuations. None can be established from price action alone. What is observable is the distance between expanding product coverage and weakening token performance. The immediate level to monitor is approximately $0.397, the recent seven-day low. A sustained break below that area would weaken the argument that the current decline is stabilizing. Holding above it would preserve the existing range, but would not, by itself, confirm a structural recovery. The real question is whether Ondo's expanding financial infrastructure can create measurable, lasting demand for ONDO, rather than simply strengthening the ecosystem's reputation. The next test is straightforward: price stability, actual token demand, and evidence that adoption is reaching the asset itself. #ByXIMPACT
$BTCUSDT — Two Years After ETF Access, Liquidity Still Has to Prove Itself More than two years after US spot Bitcoin ETFs began trading in January 2024, Bitcoin has a more established route into traditional investment portfolios. For holders, the practical change is broader investment access through regulated products, alongside its existing global exchange markets. But wider access has not removed the market’s dependence on liquidity, positioning, and actual buying demand. That is the gap worth watching. Institutional access creates a stronger market structure in some respects, but it does not guarantee consistent inflows or protect price during periods of selling pressure. ETF availability is a structural improvement, not proof that fresh capital is entering at every decline. There is also no confirmed recent Bitcoin-specific exchange listing or delisting change establishing a new access catalyst here. Routine exchange compliance and trading policies should not be mistaken for a fundamental development specific to BTC. The recent price action makes the distinction relevant. BTC is trading around $81,300, after falling from the $84,000 area earlier in October. The latest rebound has brought price back above $80,000, but the broader monthly picture remains weaker. That is not necessarily a contradiction in market structure; it simply means improved access and short-term price direction are measuring different things. The available historical data puts BTC approximately 2.4% lower over seven days and 2% lower over 30 days, although exact figures vary by data provider and closing time. Around October 21, BTC traded near $84,300. Near September 28–29, it was in the $83,500–$83,700 region. The current price remains below both reference areas, leaving the recovery without a clear return to its earlier trading range. Several explanations remain possible. Short covering could be contributing to the rebound. Buyers may be accumulating quietly, or thin liquidity at particular levels could be exaggerating relatively ordinary orders. None of these explanations is established by price alone. Distinguishing between them requires evidence from spot volume, sustained ETF flows, and how price responds when it approaches previous support. The practical level to watch is $79,000–$79,500. A sustained break below that area would weaken the argument that BTC is building a stable recovery and put the recent lows back into focus. The question is whether broader investment access is translating into durable demand, rather than simply making Bitcoin easier to trade. The next real test is whether buyers can defend support and reclaim the $83,000–$84,000 area with convincing spot-market participation. #ByXIMPACT

$HYPEUSDT — Months after Hyperliquid established itself as a major force in on-chain perpetual trading, the central question is no longer whether the platform has a functioning product. It is whether the strength of the trading venue translates into durable demand and dependable market access for the token itself. For holders, platform adoption and token performance remain related, but they are not interchangeable. The distinction matters because sits at the intersection of several narratives: decentralized derivatives, trading-fee economics, ecosystem growth, and the broader argument that on-chain exchanges can compete with centralized venues. Yet a strong product narrative does not automatically guarantee deeper spot liquidity across every exchange, consistent demand from new buyers, or protection against market-wide risk reduction. The practical test is how the token trades when attention shifts away from the platform and liquidity conditions become less favorable. Exchange availability, token support, and market treatment also need to be interpreted carefully. Routine listing, custody, deposit, withdrawal, or compliance notices can change how users access an asset without expressing any project-specific judgment. Conversely, broad platform support does not establish that liquidity is deep enough to absorb significant selling without price dislocation. The difference between being accessible and being liquid is easy to overlook. The price response is more complicated than the access story. Binance announced spot trading for on September 24, including HYPE/USDT, HYPE/USDC, and HYPE/TRY, while applying its Seed Tag. Roughly one month later, the token is trading near $81, still below the late-September area around $87.50 and well beneath its early-October high near $95.25. Broader exchange access has not prevented a substantial monthly retracement. Binance Support +2 The latest price action offers a useful contrast. has recovered from its October 24 low near $74.50, with the market moving back toward $81. The seven-day picture is modestly positive on some price feeds, while the 30-day change remains negative at roughly 11–15%, depending on the source and measurement window. The rebound is observable; its cause is not established. Short covering, thin order books, quiet accumulation, derivatives positioning, or a broader recovery in risk appetite are possible explanations, but none should be treated as confirmed without supporting evidence. Swolecharts +2 Key price context: approximately $81 current; around $80.70 one week ago; around $87.50 one month ago. The recent local low near $74.50 is the more important test than a temporary move above the weekly reference level. These are approximate market observations, not universal prices across every exchange. A sustained break below $74.50 would weaken the argument that the recent rebound represents meaningful stabilization. It would suggest that the improvement in short-term price action has failed to overcome the broader monthly decline. Holding above that area would preserve the possibility of a base forming, but would not, by itself, establish renewed demand. The unresolved issue is straightforward: how much does a high-profile exchange listing actually improve the durability of market access and liquidity when the token remains exposed to wider selling pressure? The next real test is whether $HYPE can maintain its recovery through sustained trading activity, rather than merely bounce from a local low. #ByXIMPACT

$MNTUSDT : One Month After Mantle’s Push Into Tokenized Finance, the Market Is Pricing Something Different. One month after Mantle announced record growth in tokenized assets and real-world asset value, the practical outcome for MNT holders remains difficult to quantify. On September 25, Mantle reported 1,473 tokenized assets and approximately $476 million in distributed RWA value, citing Blockworks Research and RWA.xyz. The ecosystem metrics were expanding, but the token’s market price was moving in the opposite direction. The gap is worth examining. Mantle has been building around tokenized equities, institutional-grade financial products and on-chain liquidity. In September, it also joined the Global Dollar Network, extending its stablecoin infrastructure narrative. These developments may improve the network’s utility and accessibility, but they do not automatically translate into stronger spot demand for MNT. Network adoption, asset value and token liquidity measure different things. Treating them as interchangeable obscures the central question: how much of the ecosystem’s growth actually reaches the token? The price action offers a useful counterpoint. As of October 27, MNT was trading around $0.506. That represents an approximate 5% decline over seven days and a roughly 25% decline over 30 days, using historical daily closes as the reference. Around October 20, the token traded near $0.535; around September 27, it was near $0.675. The decline continued despite the institutional and tokenization narrative gaining visibility. This divergence is observable, although it does not establish why sellers remain in control. Several explanations remain possible: broader market weakness, profit-taking, reduced speculative demand, short positioning, thin order books or quiet accumulation being absorbed by persistent selling. None can be confirmed from price alone. Nor is there sufficient evidence here to attribute the decline to an exchange-specific access restriction. The distinction matters because routine exchange policies and project-specific decisions have very different implications for holders. The immediate level to watch is $0.50. MNT has recently traded close to that threshold, making it a practical reference point for the current narrative. A sustained break below it would weaken the argument that buyers are defending the recent range; holding it, by itself, would not prove that underlying demand has improved. The question is whether Mantle’s expanding financial ecosystem is translating into better market conditions for MNT, or whether the network’s progress and the token’s performance are becoming increasingly disconnected. The next real test is sustained demand, supported by price stability and observable trading activity—not another headline. #WSOT2026

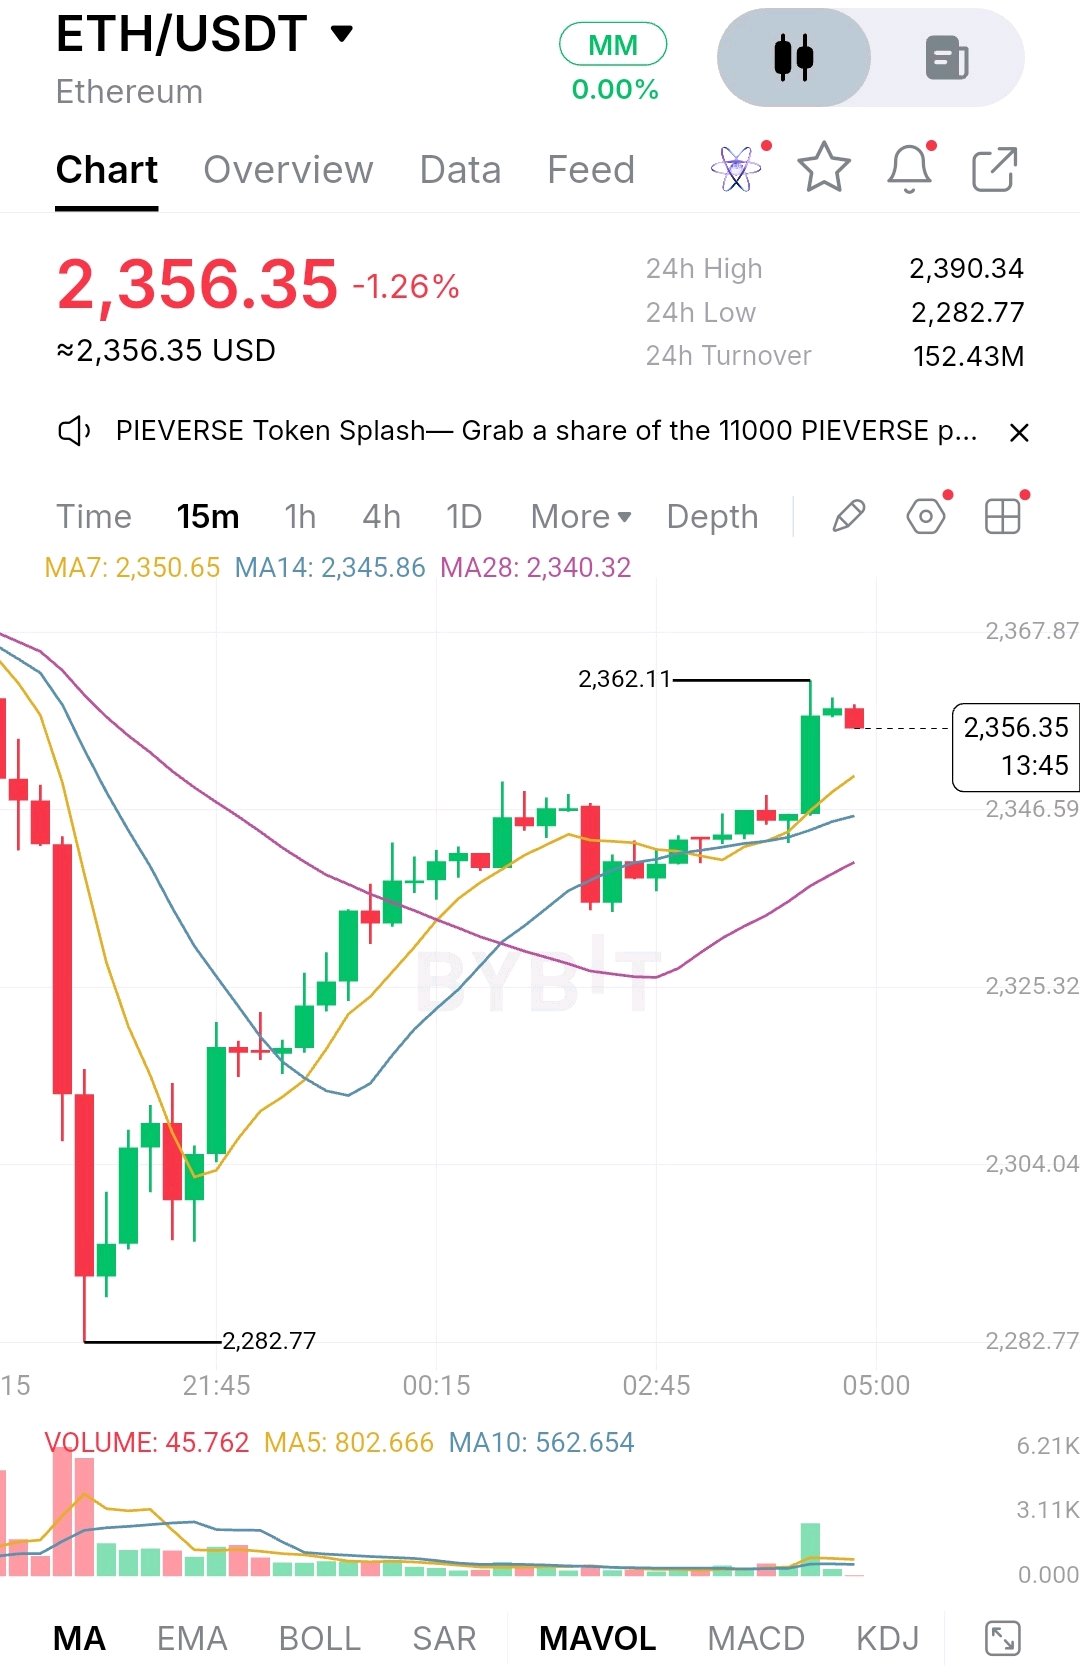
$ETHUSDT Is Testing Resistance After a Strong Recovery ETH/USDT is trading around $2,356.35, recovering strongly from the $2,282.77 low on the 15M chart. Buyers have pushed the price above the short-term moving averages, but ETH is now facing resistance after reaching $2,362.11. The lower timeframe shows bullish momentum, supported by a recent volume spike. However, we only have the 15M chart here, so the higher-timeframe trend still needs confirmation. The key resistance zone is $2,362–$2,368. A clean breakout above $2,362.11 with strong volume could open the door toward: * $2,375 * $2,390.34 — 24H high However, if ETH fails to break resistance and loses the $2,345–$2,340 support zone, price could pull back toward $2,325 and potentially $2,304. For me, chasing ETH after this sharp move isn't the best risk/reward. I'd rather wait for a confirmed breakout and successful retest, or a pullback toward support before considering an entry. #MyByXTake
$BNBUSDT is fighting to reclaim $750 after a sharp correction from the $810 high. The next move matters: a breakout could restart bullish momentum, while another rejection may send BNB back toward $710. The key factor is broader crypto market sentiment and liquidity. BNB has rebounded from its October lows, but buyers still need to clear nearby resistance to confirm a stronger recovery. Key Figures - Current price: ~$747 - Resistance: $750–$756 - Major resistance: $778–$810 - Support: $725 - Key downside levels: $710, then $696 - Recent October high/low: ~$810 / ~$705 Bullish Scenario: A sustained daily close above $756 would strengthen the recovery, opening the path toward $778. A breakout above $778 could bring $800–$810 back into focus. Bearish Scenario: Rejection below $750–$756 followed by a daily close under $725 would signal renewed weakness. That could expose $710, with $696 as the next downside target. Bottom line: BNB is at a decision zone. A clean reclaim of $756 favors buyers; losing $725 shifts the advantage back to sellers. Watch the breakout or breakdown confirmation rather than anticipating it. #MyByXTake

$XRPUSDT fell 1.03% to $1.3152, extending its short-term decline as selling pressure persisted on the 15-minute chart. According to the provided market data, XRP recorded a 24-hour high of $1.3308, a low of $1.2954, and turnover of 22.83 million. The price has retreated from its intraday peak and is trading below the MA7, MA14, and MA28 moving averages, indicating continued near-term weakness. Trading volume reached 352.02K on the displayed candle, while the chart marked a recent local low of $1.3133. Whether XRP stabilizes or extends its decline will depend on subsequent price action and trading volume. These figures reflect the supplied chart snapshot, not independently verified live market data. #MyByXTake

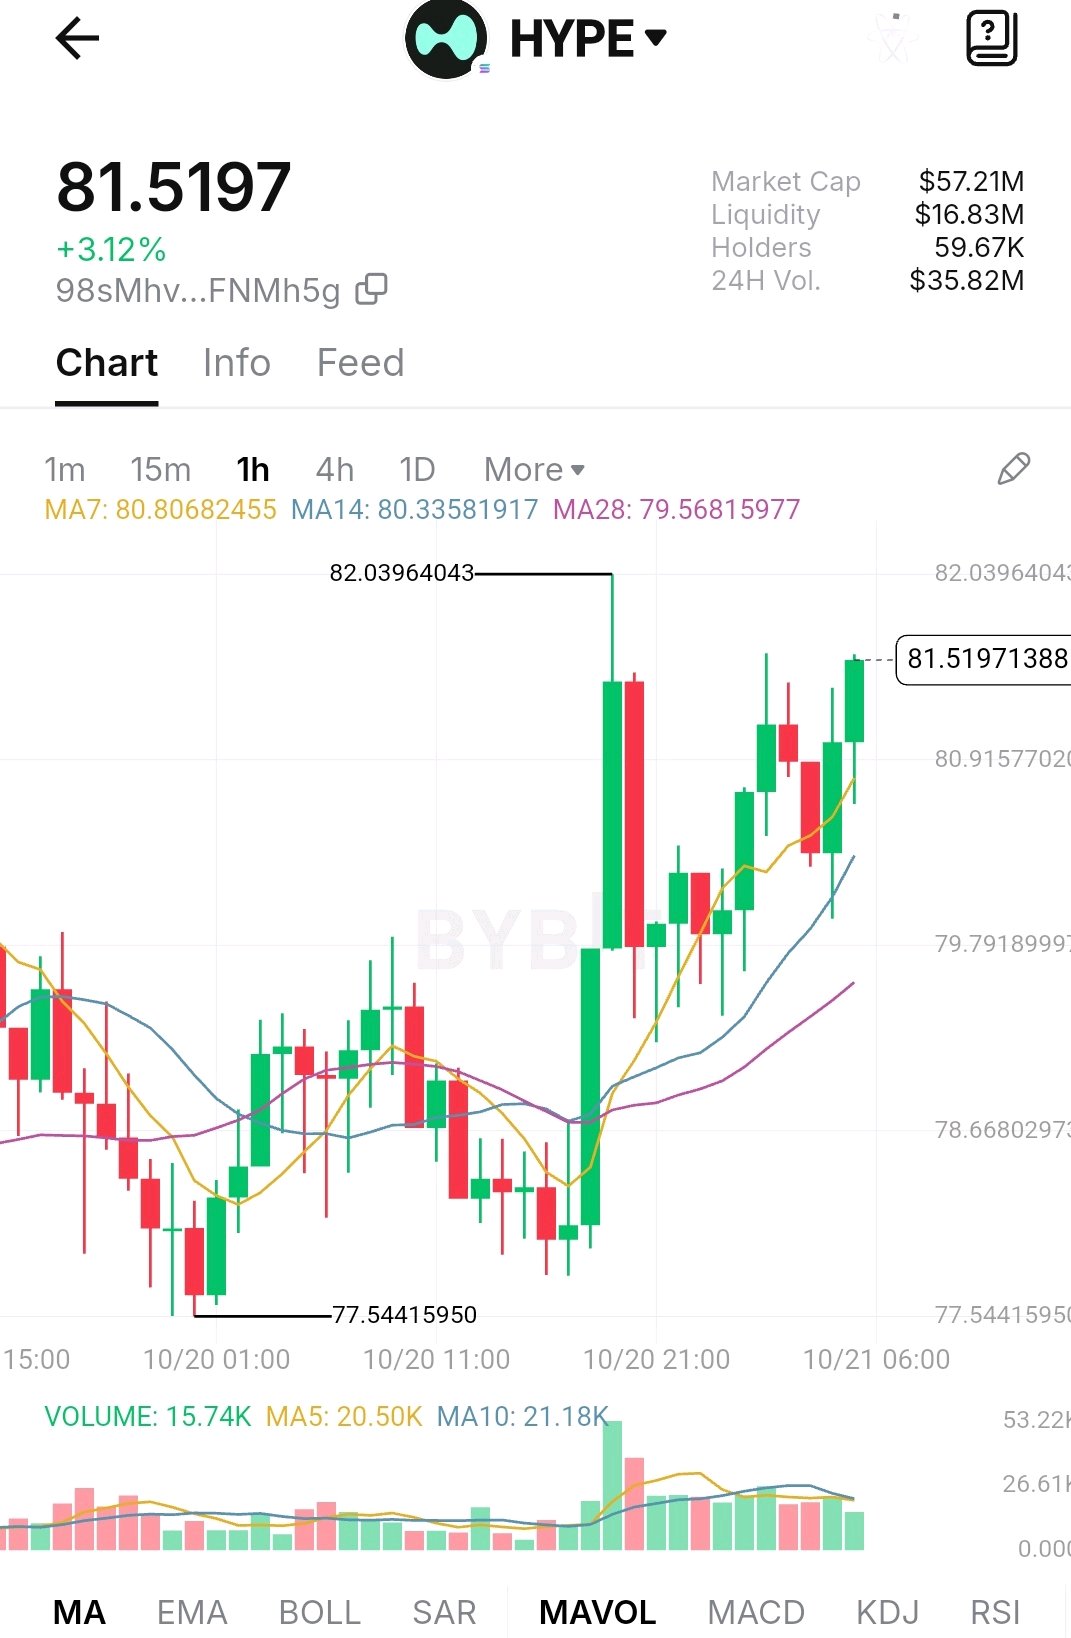
$HYPEUSDT is trading at $81.52, up 3.12%, according to the provided chart. The token’s market capitalization stands at $57.21 million, with $16.83 million in liquidity and $35.82 million in 24-hour trading volume. The asset has approximately 59,670 holders. On the 1-hour chart, HYPE has rebounded from a recent low near $77.54 and is trading above its 7-, 14-, and 28-period moving averages, indicating short-term upward momentum. The price recently approached $82.04, a key resistance area to monitor. Whether buyers can sustain the recovery remains uncertain, and further price action is needed to confirm the trend. #MyByXTake
Polkadot ($DOTUSDT ) rose 0.61% to $1.1152, approaching its 24-hour high of $1.1216, according to the provided Bybit Spot chart. On the 15-minute timeframe, DOT rebounded sharply from a low of $1.0458, with the price moving above its 7-period, 14-period, and 28-period moving averages, signaling short-term bullish momentum. However, the token has pulled back from its recent high, making the $1.12 area a key resistance zone to watch. A sustained move above this level could support further upside, while renewed selling pressure may trigger another consolidation phase. The chart alone does not confirm a breakout, and broader market conditions remain unverified. #TSLATookOffLiterally

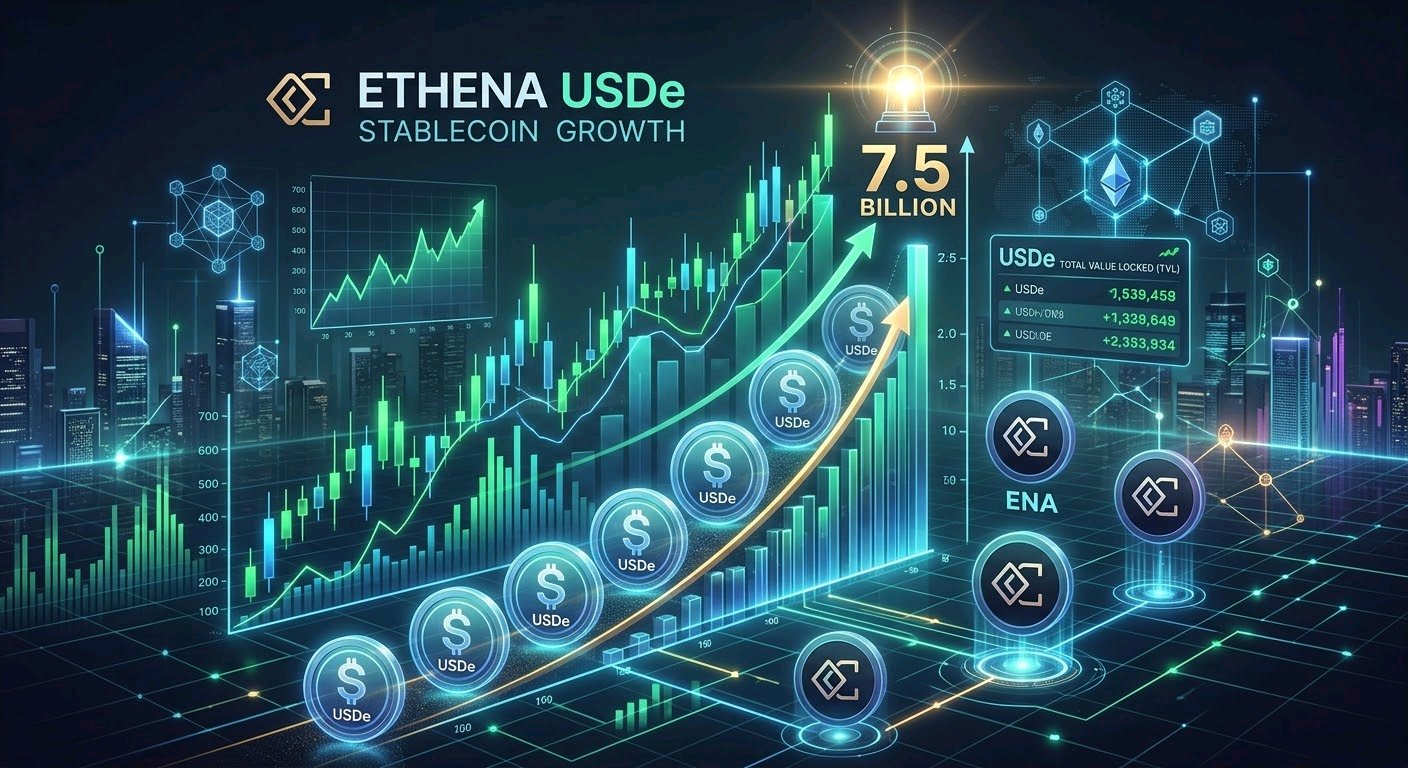
$ENAUSDT is facing a critical test: Ethena has approved a fee switch, but the buyback mechanism depends on growth that hasn’t arrived yet. USDe supply closed Q3 at $4.94B, up 9.5% from July 1, while ENA’s buyback trigger starts at $7.5B in 14-day average USDe supply. The plan directs up to 95% of eligible net revenue toward buybacks, but ENA still needs stronger stablecoin demand before that catalyst can kick in. The real story isn’t just tokenomics—it’s whether Ethena can turn USDe adoption into sustained value for ENA holders. Can USDe reach $7.5B and unlock the buyback narrative before market patience runs out? #TSLATookOffLiterally
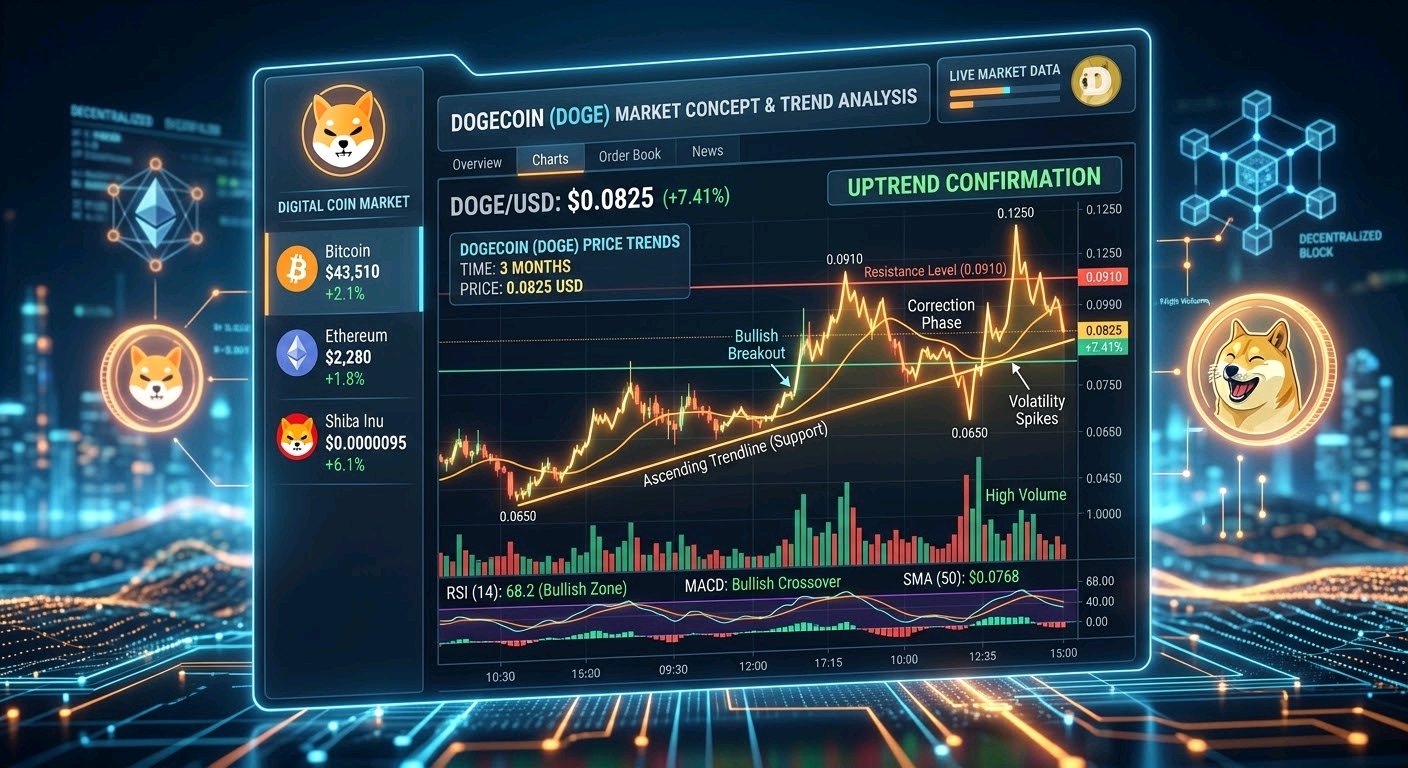
$DOGEUSDT is facing a reality check: the price is falling while institutional demand remains surprisingly small. DOGE trades near $0.079, down 8.31% over seven days, with a $12.35B market cap and roughly $488M in 24-hour volume. Meanwhile, U.S. Dogecoin ETFs held around $14M in assets as of October 14, despite recording $3M in net inflows over the previous month. The tension is clear: trading activity remains substantial, but ETF demand is tiny relative to DOGE’s valuation. A sustained recovery needs more than social-media excitement—it needs stronger buying pressure and improving capital flows. Is building a base for recovery, or does it need a deeper reset before buyers return? #TSLATookOffLiterally
$PUMPUSDT is showing an interesting contradiction: the token is bouncing, but the broader trend still looks fragile. PUMP is trading around $0.0045, with a market cap near $2.1B and roughly $293M in 24-hour trading volume. Yet the price remains about 63% below CoinMarketCap’s reported all-time high of $0.01214. The key tension is whether Pump.fun’s revenue-driven buybacks and burns can create lasting demand while speculative trading activity cools. Buybacks can reduce circulating supply, but they cannot guarantee sustained price appreciation. At a $2B-plus valuation, the real question is whether PUMP can evolve beyond memecoin speculation into a token with durable economic demand. Will genuine platform growth be strong enough to absorb selling pressure and justify this valuation? #TSLATookOffLiterally

$BTCUSDT Bitcoin is facing a reality check: even a strong recovery can struggle when institutional demand weakens. BTC traded near $80,743 on October 15, while U.S. spot Bitcoin ETFs recorded $866.6 million in net outflows over seven sessions. Yet those funds still held roughly 1.25 million BTC, representing 6.23% of circulating supply. The tension is clear: institutional exposure remains significant, but rising U.S. interest-rate expectations are pressuring risk assets. If ETF outflows persist, Bitcoin’s recovery could face another test; renewed inflows would strengthen the case for a rebound. The real signal isn’t one green candle — it’s whether buyers can sustain demand against macro pressure. Will BTC reclaim bullish momentum, or will tightening financial conditions trigger another leg down? #ByXIMPACT

$ETHUSDT is holding up better than its institutional flows suggest — and that divergence deserves attention. U.S. spot Ethereum ETFs recorded $85.4M in net outflows on October 12, bringing five-day outflows to $576.8M. Yet ETH gained 2.43% over the past month, while tracked ETFs still hold 5.9M ETH, worth approximately $23.37B. That creates an interesting tension: institutional capital is pulling back, but price hasn't fully reflected that pressure. Either buyers are absorbing the selling, or the market hasn't finished pricing in weaker demand. The real signal isn't one green candle — it's whether ETH can sustain its strength while ETF flows remain negative. Will spot demand absorb the institutional selling, or is ETH's resilience about to be tested? #ByXIMPACT

$SUIUSDT is facing a reality check: ecosystem growth means little if the token can’t hold investor demand. SUI trades near $1.06, with a $4.38B market cap and roughly $501M in 24-hour volume. Its fully diluted valuation sits near $10.63B. The tension? Real network adoption must compete with future token supply and a market that’s still testing conviction. The real question isn’t whether Sui can grow — it’s whether that growth can translate into sustained demand for SUI. Will reclaim momentum, or does valuation remain its biggest obstacle? #BybitStocks

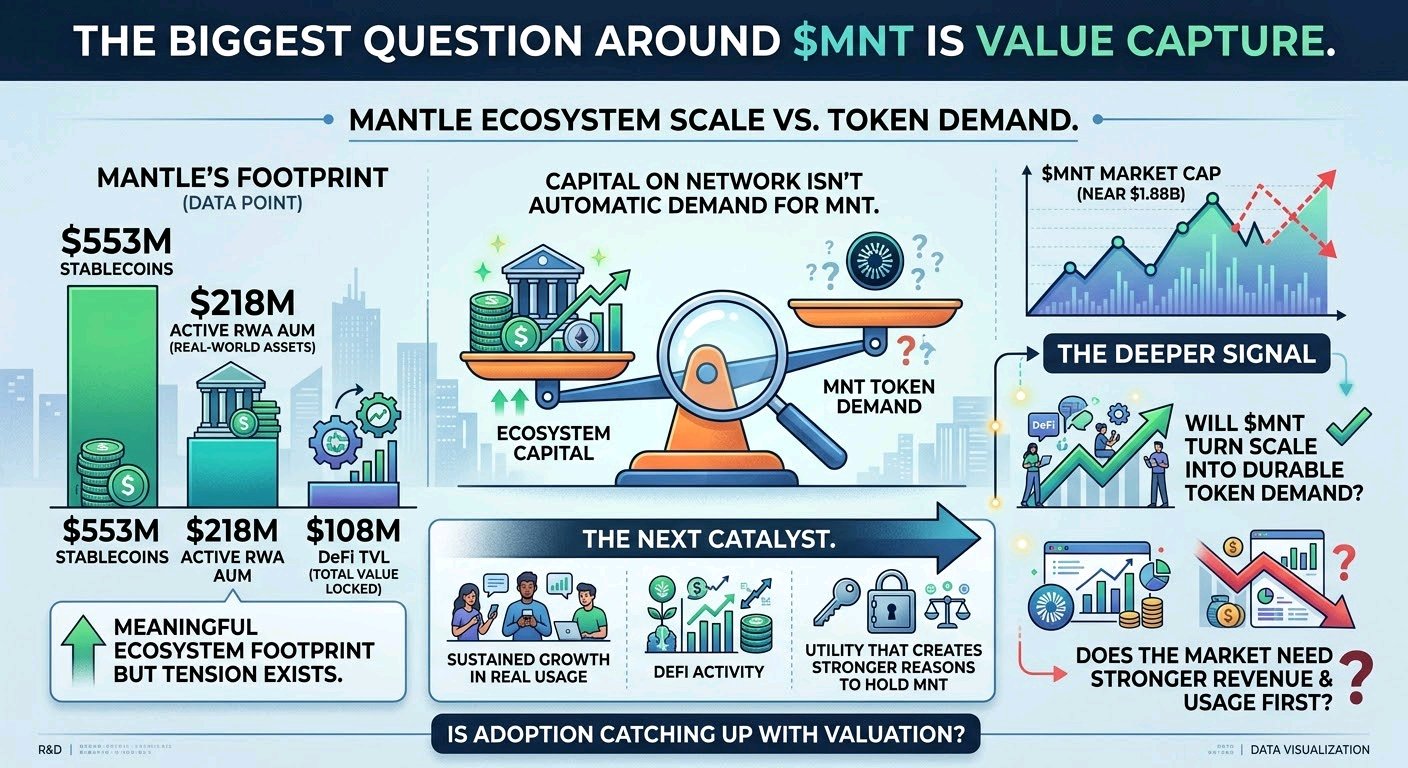
The biggest question around $MNTUSDT isn’t liquidity — it’s value capture. Mantle has approximately $553M in stablecoins, $218M in active real-world asset AUM, and $108M in DeFi TVL, while MNT’s market cap sits near $1.88B. <Cite refs={["turn627187search0","turn627187search1"]}/> That’s a meaningful ecosystem footprint, but the tension is clear: capital on the network doesn’t automatically translate into demand for the token. The next catalyst is sustained growth in real usage, DeFi activity, and utility that creates stronger reasons to hold MNT. The deeper signal is whether adoption can catch up with valuation. Will turn its ecosystem scale into durable token demand, or does the market need stronger revenue and usage first? #FOMCMinutes:Hawkish
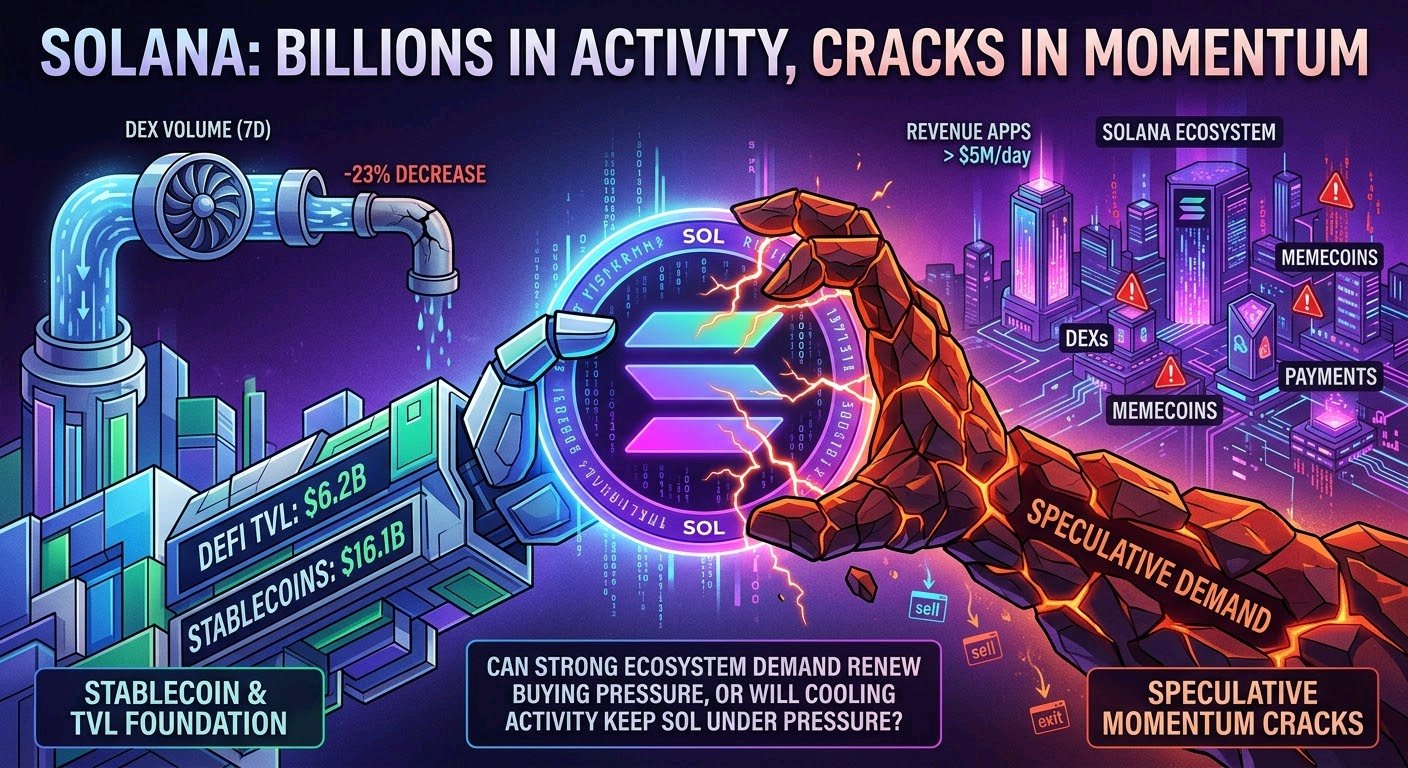
The surprising part about $SOLUSDT is that its ecosystem is still generating billions in trading activity, yet momentum is showing cracks. Solana currently holds around $6.2B in DeFi TVL and $16.1B in stablecoins, while its DEX volume reached roughly $12B over seven days, down about 23% week over week. Meanwhile, daily app revenue remains above $5M. That’s the tension: capital and applications are still active, but declining trading volume suggests speculative demand may be cooling. The next catalyst is whether liquidity rotates into sustainable DeFi activity or continues to fade with market sentiment. For SOL, network usage matters—but sustained demand for the token matters even more. Can Solana turn its strong ecosystem into renewed buying pressure, or will cooling activity keep SOL under pressure? #ByXIMPACT
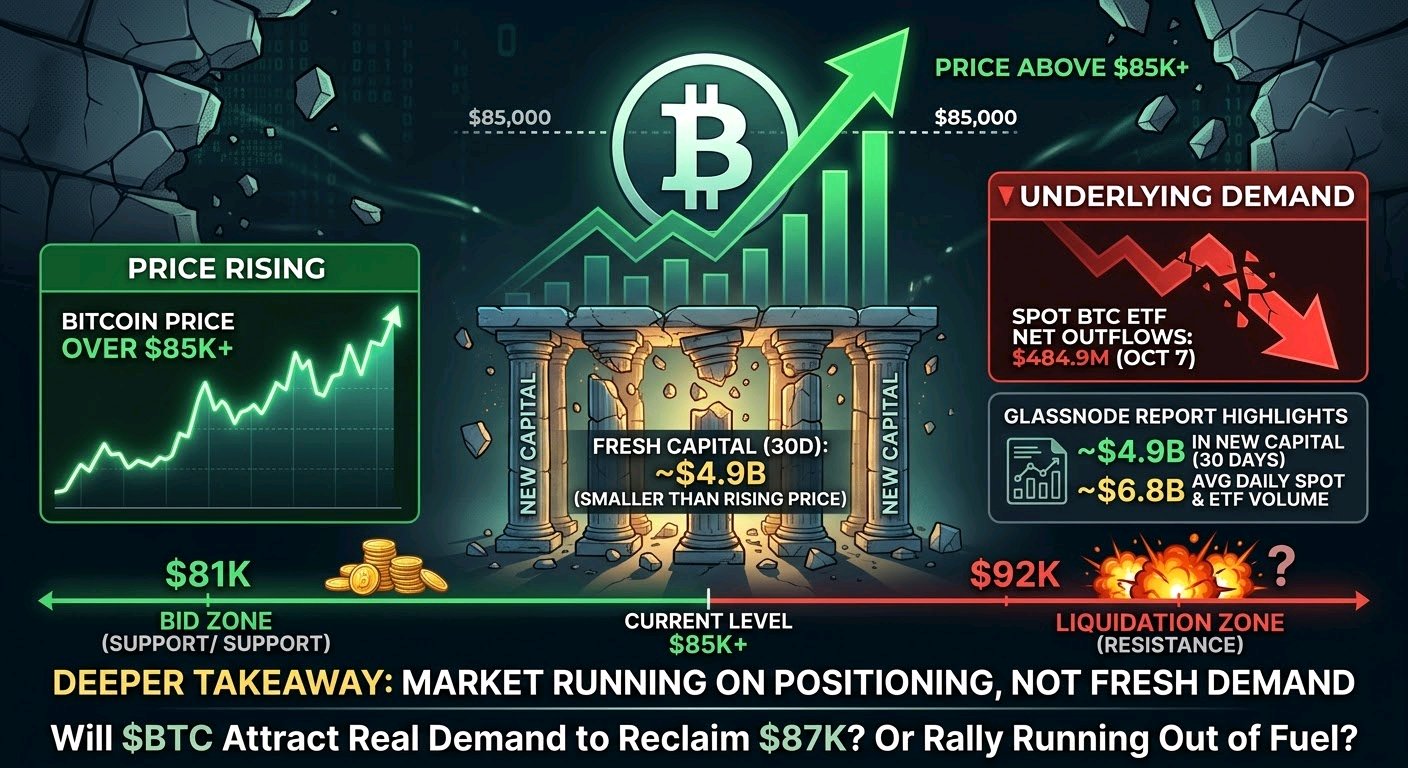
$BTCUSDT pushed above $85K, but the real surprise is how little fresh capital backed the move. Glassnode’s October 7 report highlighted roughly $6.8B in average daily spot and ETF volume, about $4.9B in new capital over 30 days, and a $12.8B rise in Realized Cap. Meanwhile, U.S. spot Bitcoin ETFs saw $484.9M in net outflows on October 7. That’s the tension: price can rise while underlying demand remains fragile. If buyers don’t return in size, the rally could struggle to sustain momentum. Glassnode flagged $81K as a key bid zone, with a liquidation cluster near $92K above. The deeper takeaway? This market may be running more on positioning than fresh money. Will attract enough real demand to reclaim $87K, or is this rally running out of fuel? #ByXIMPACT
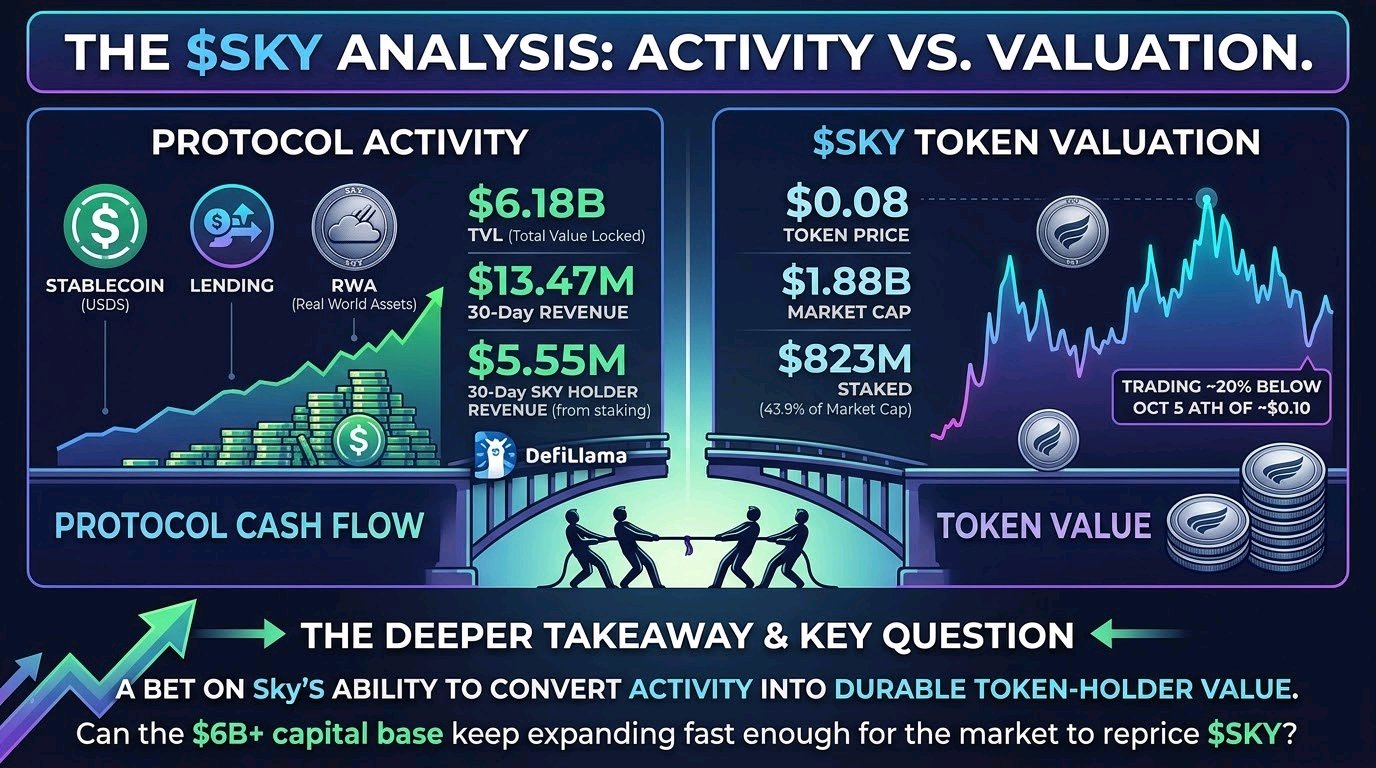
$SKYUSDT right now isn’t the price — it’s the gap between protocol activity and token valuation. Sky is sitting at roughly $6.18B TVL, generating $13.47M in 30-day revenue, while the token trades around $0.08 with a $1.88B market cap. Even more notable: about $823M of SKY is staked, roughly 43.9% of market cap. That creates an interesting tension. The protocol is producing meaningful cash flow, but the token still trades about 20% below its October 5 ATH near $0.10. The deeper takeaway is that is increasingly looking like a bet on whether Sky can convert its stablecoin, lending and RWA activity into durable token-holder value. Current holders’ revenue is about $5.55M over 30 days, according to DefiLlama. So the key question isn’t simply whether Sky can grow TVL. Can that $6B+ capital base keep expanding fast enough for the market to reprice closer to the economics the protocol is already generating? #BybitAIBestReplies