Ramisha Afrose
5758Like251Shares186Fans59Follow
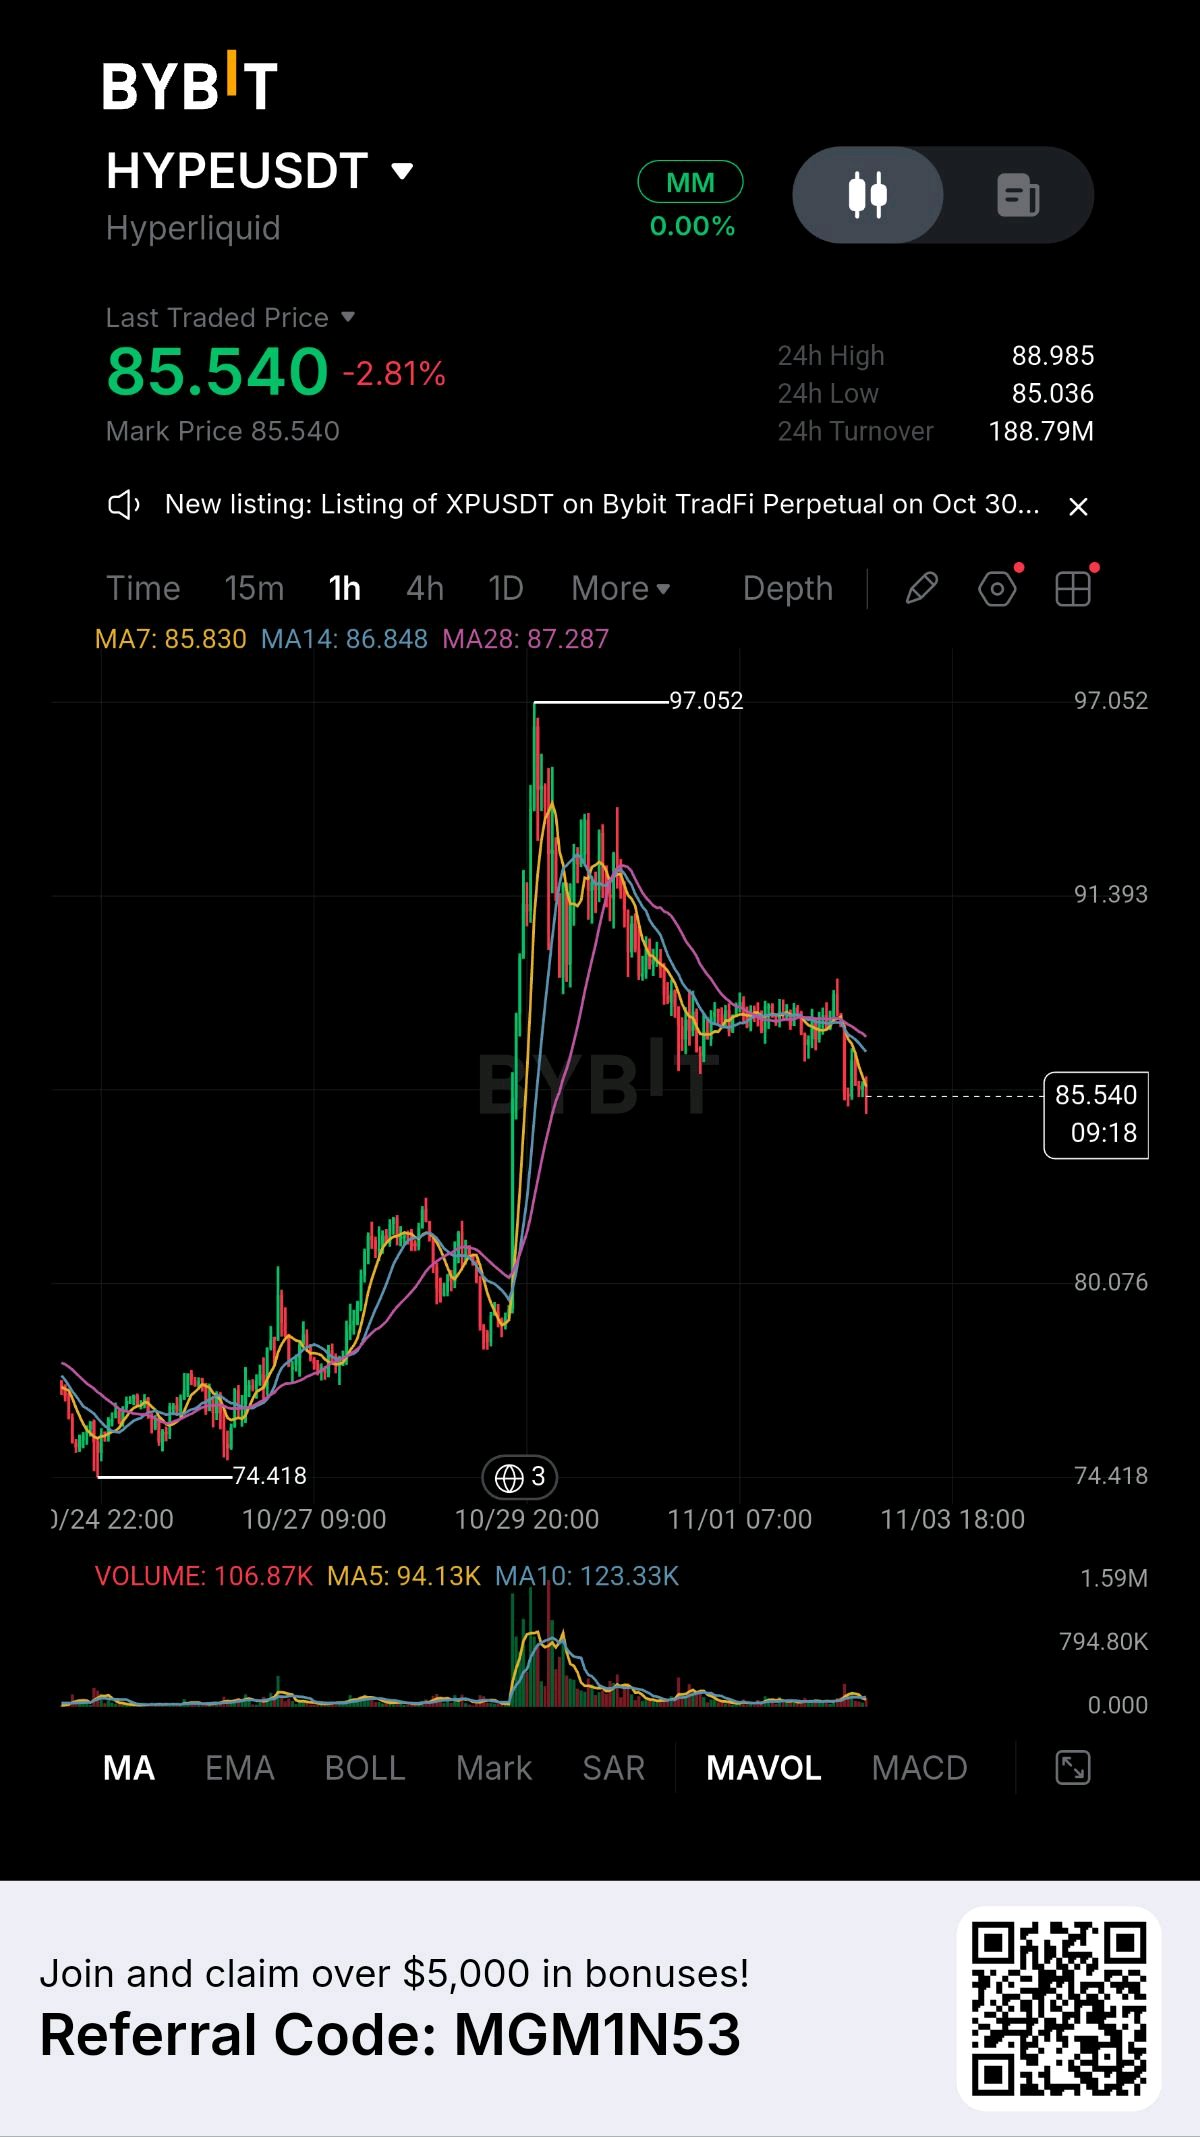
HYPERLIQUID (HYPE): it bought about $64 million of its own token last month, more than any other protocol. One holder just unstaked $224 million. Most tokens in this series are waiting for a buyer. HYPE has one, and it runs every day. The test is how much selling that buyer can take. What’s new? The buyer. According to DefiLlama data from October 28, Hyperliquid generated $63.94 million in 30-day holder revenue through its HYPE buyback, the highest of any crypto protocol. The Assistance Fund sends the vast majority of eligible fees into open-market HYPE purchases, with no vote needed. The second engine. Since October, about 90% of the yield from Hyperliquid’s USDC reserves also goes to the fund. A $14.58 million payment arrived in October. More than $15 million is expected in November, and a 2.52 USDC test transfer reached the fund on November 2. The protocol also collected over $87 million in October. The seller. Over two days, Paradigm unstaked 2.55 million HYPE, worth about $224 million, from 15 wallets. That is 17.85% of its staked position of 14.26 million HYPE. My view: this is the strongest token-demand mechanism of any project I’ve covered in these posts. Usage turns directly into token buying. But there is a catch for HYPE holders. Unstaking is not selling, and nothing says Paradigm has sold. But it is the step that comes before selling, and the size matters. The buyback spent about $64 million in a month. One holder just freed up $224 million, which is about three and a half months of the buyback’s entire output. The second catch is that the buyback follows trading volume. Monthly revenue has swung between $38 million and $74 million this year, and October came in above $87 million. In a quiet market the buyer shrinks. Also, the fund buys HYPE for the protocol. A holder cannot redeem against it or claim a share, so the buyer supports the price but doesn’t pay holders. What does the market show? HYPE traded in the mid-$80s to near $90 this week, about 10% under its record of $97.98. Traders are watching $75 as the support level. A buyback this size is probably part of why it has held up while much of the market fell. The number I keep coming back to is $224 million. It is what one holder moved out of staking in two days, set against $64 million that the whole buyback spent in a month. Where I land: Hyperliquid has what most chains lack: a buyer that doesn’t need to be persuaded. But a buyer with a fixed budget can still be outsold. I would watch whether the unstaked HYPE moves to an exchange, since that is the signal that it is being sold. I would also watch whether weekly buybacks hold up if trading volume cools. And here is the question: when a buyback is already the largest in crypto, how much selling can it absorb before the price shows it? #ByXIMPACT #WSOT2026 #MidtermsMarketWatch #USPayrollsAndRateDecisionsDriveMacroWeek #AnthropicIPOTestsTheAIBoom $BTCUSDT $HYPEUSDT
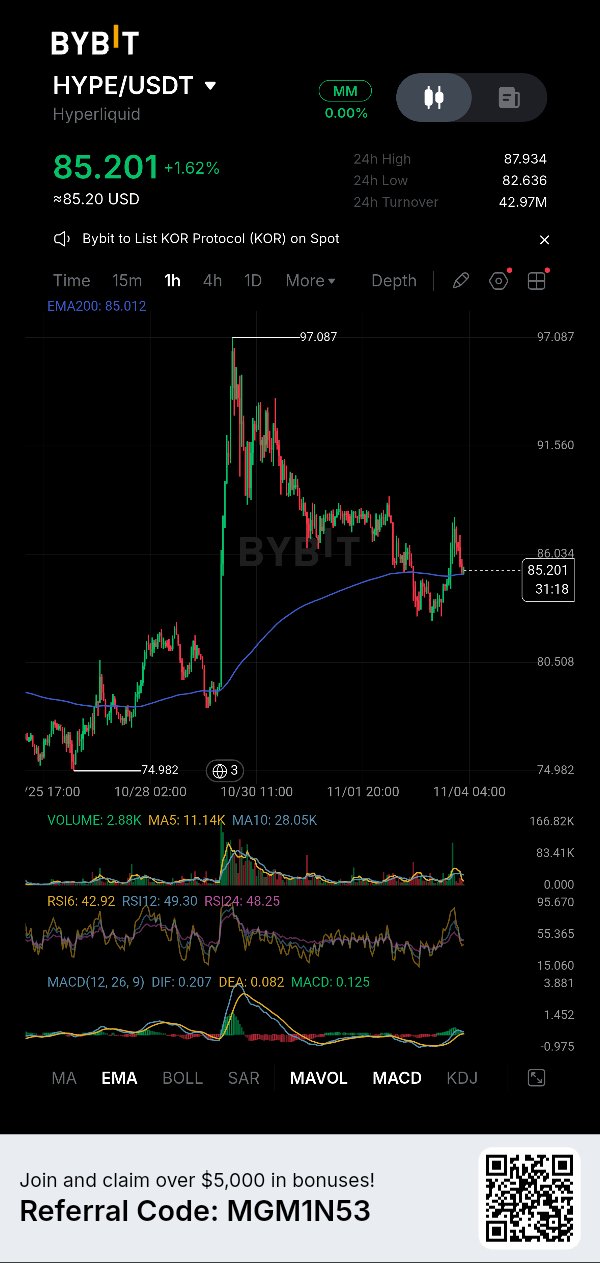
$XRPUSDT just broke out of the tightest squeeze it has had in months. Price is 1.2773, up 2.75% today, about 6% above the 1.2001 flush low and still about 5% below the 1.3443 high. It has just pushed back above its 200 EMA. Here’s the setup it came from. XRP traded inside a 2.4% range between $1.2355 and $1.2646 from Saturday through Tuesday, the second-tightest four-day stretch since early 2024. Its Bollinger Bands narrowed to their tightest since before the August rally toward $1.70. One analyst called the 1.23 to 1.27 zone a no-trade area until a 4-hour candle closes outside it. Price has now moved outside it, and the question is whether it holds. Turnover The 24-hour turnover is 37.57M, with a range of 1.2416 to 1.2914 (about 4%). That’s a big step up from the tiny weekend range, so the squeeze has finally released some energy. Volume The breakout hour printed a larger volume bar than the quiet hours before it, then volume cooled. The latest reading is 828.68K, below both the MA5 (1.23M) and the MA10 (1.79M). The current 1h candle is still open, so its own reading is incomplete. The move out of the range had interest, but follow-through is still unproven. EMA200 EMA200: 1.2711 This is the line that matters. Price (1.2773) is about 0.5% above it after being stuck under it for days. That’s a thin margin, so the 200 EMA now needs to act as support. MACD and RSI MACD (12, 26, 9): DIF 0.0081 | DEA 0.0063 | histogram 0.0017. RSI: 57.83 / 62.68 / 60.23. MACD just turned positive, with DIF above DEA and a small green histogram. That’s a fresh bullish cross, and it’s still shallow. RSI sits in the high 50s to low 60s, so momentum is improving without being overbought. The tone is mildly bullish. Levels to watch · 1.3443 — The high before the sell-off. · 1.30 — The first meaningful recovery level, with XRP still well below the roughly $1.50 area from late September. · 1.2914 — The 24h high. · 1.2773 — Where we are right now. · 1.2711 — The EMA200, the line to hold. · 1.2646 — The top of the old squeeze range. · 1.2416 — The 24h low. · 1.2001 — The low of the flush. Consideration The breakout has support and risk on both sides. On the supportive side, XRP Ledger added 7,934 new wallets on November 1, well above the recent daily average of about 3,500 and the sixth-highest daily total of 2026. On the cautious side, spot XRP ETFs recorded net outflows on November 2, and XRP is down 16.5% over the past month. One analyst also warns that failing to hold the 1.26 level could set up a drop toward 1.10. Network activity is rising, but fund flows and the larger downtrend haven’t turned. Trade plan · The Bullish Path: We need price to hold above the EMA200 (1.2711) and close an hour above 1.2914. If that holds, the next area to watch is 1.30, which is where the bigger test sits. · The Bearish Path: If price falls back below 1.2711 and into the old range, the breakout was a fake-out, and it likely retests 1.2416 and then 1.2001. · My take: I’m staying patient. The squeeze breaking up is a good sign, but volume has cooled and the cushion above the EMA200 is thin. I want to see 1.27 hold on a pullback, or a confirmed close above 1.29, before looking for a long. Support and resistance Support: 1.2711 (EMA200) → 1.2646 (old range top) → 1.2416 (24h low) Resistance: 1.2914 (24h high) → 1.30 → 1.3443 (high) Invalidation and risk note This setup is invalidated if we close a 1-hour candle back below 1.2646, inside the old range. The biggest risk is a failed breakout: squeezes often pop one way, then reverse back through the range. Don’t guess the direction, wait for the break. #ByXIMPACT #WSOT2026 #MidtermsMarketWatch #USPayrollsAndRateDecisionsDriveMacroWeek #AnthropicIPOTestsTheAIBoom $BTCUSDT $XRPUSDT
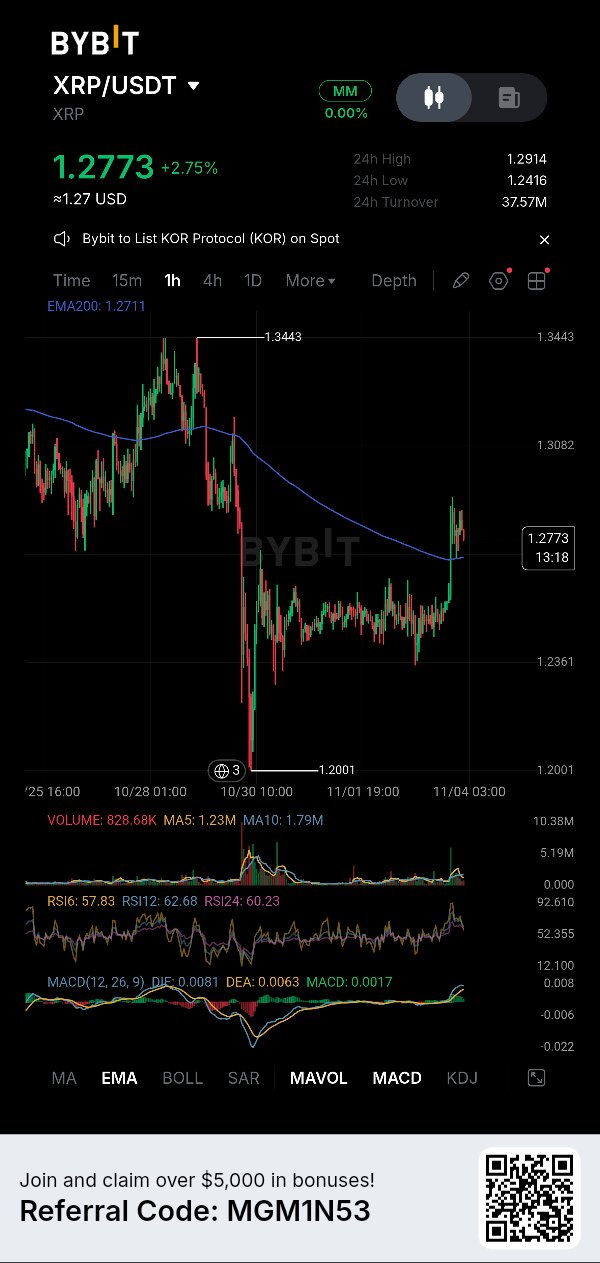
ADA: holders are voting on a $4.5M copper bet that needs a 49% gain just to break even, and so far almost nobody supports it. 👀 I’ve recently been watching how Cardano behaves. ADA sits near $0.20, about 26% under its early-October level, but the real story is a treasury vote that closes on Nov 15. A company called Toto Finance wants 22 million ADA from the treasury to buy physical copper. To me, that matters more than one red candle. 📊 What is keeping ADA on the radar? 🔹 The ask. 22M ADA, worth about $4.5M today, to buy tokenized copper stored near New Orleans for 18 to 24 months. 🔹 The hurdle. The plan assumes buying at $6.73 a pound and selling near $10.06. Copper has to rise about 49.4% for the treasury to break even, and the proposal says there’s no guarantee of getting the original ADA back. 🔹 The early vote. As of Oct 28, about 32.8% of DRep votes opposed it and only 0.32% supported it, with about 67% still undecided. The Constitutional Committee also flagged two compliance issues, and five members hadn’t voted. 🔹 The allowance. It would use about 22M of the remaining 42.6M ADA treasury withdrawal allowance through July 2027, so by my math, more than half. An earlier funding request that got 65.21% support still failed, because the bar is two-thirds. 🎯 What levels are important right now? $0.21 — nearest resistance, the recent 24-hour high zone. $0.23 — the next target if the bounce continues, where ADA traded in mid-October. $0.20 — important support, the round number. $0.18 — the next zone of interest for sellers in case of a breakdown. My trading logic: I will consider a LONG after a daily close above $0.21 and a successful retest. SHORT becomes more interesting if the price loses $0.18 and cannot return above it. But there is one nuance: $4.5M is tiny next to a multi-billion-dollar market cap, so the vote itself won’t move the price. What it tells you is how the community treats its treasury. My conclusion: ADA is worth attention right now not because of the copper, but because of what the vote says about governance. I’m waiting for the price to confirm before risking capital. Cardano wants to bet its treasury on copper, and the DReps are already saying no. Is that governance working, or proof the treasury has no better ideas? 👇 #ByXIMPACT #WSOT2026 #MidtermsMarketWatch #USPayrollsAndRateDecisionsDriveMacroWeek #AnthropicIPOTestsTheAIBoom $BTCUSDC $ADAUSDT
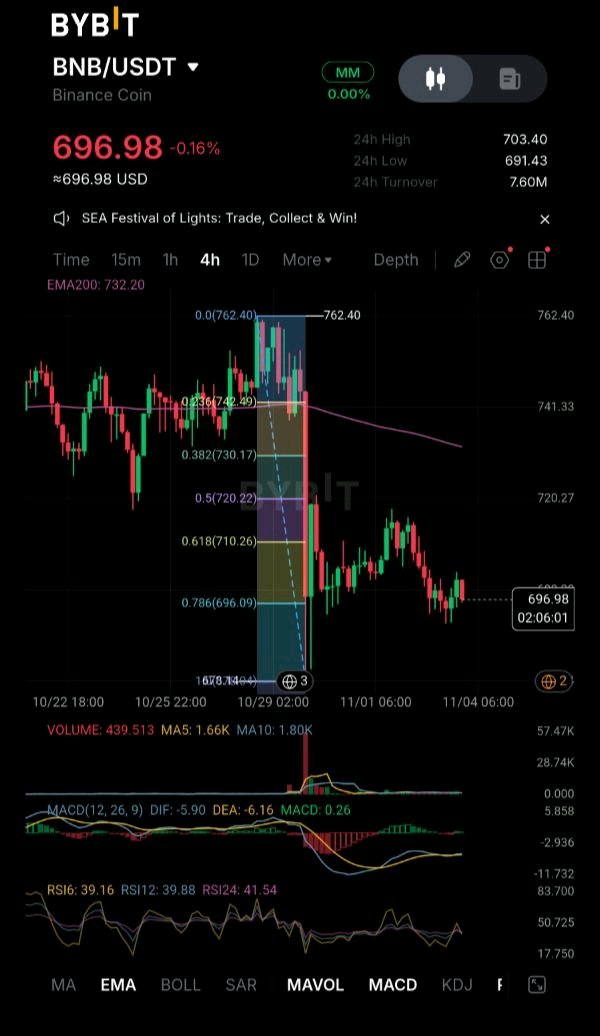
$BNBUSDT is testing the patience of the bulls, and this is where the market loves to trap impatient traders 👀 I don’t need to catch the falling knife. I just need clear confirmation that the sellers are exhausted Look at this 4-hour chart. We had a sharp rejection from the 762.40 local top, a violent flush that swept liquidity down to the 673 area, and a weak bounce that failed at the 0.618 Fibonacci level near 718. Now BNB is sitting at 696.98, right on the 0.786 Fib at 696.09 Here is my technical read on the reversal setup: Test: Price is fighting to hold the 0.786 level at 696.09. Buyers need to show strength here and push higher, otherwise this level turns into a trapdoor Momentum: MACD is flat below the zero line and RSI is sitting around 40, so there is still no real bullish crossover. The selling has slowed, but the buyers have not stepped in yet Hurdle: The EMA200 at 732.20 is the heavy ceiling above, and the 0.618 at 710.26 is the first resistance I need to see broken My Execution Plan: I am not chasing this bounce. Catching a falling knife on a 4-hour chart is a dangerous game, and I am waiting for the structure to prove itself My exact trigger: I need a strong 4H candle close above the 0.618 Fib level at 710.26, with volume expanding. Once that resistance flips into support, the path to the 0.5 at 720.22 and the 0.382 at 730.17 opens up Targets: 720.22, then 730.17, then the EMA200 at 732.20 Risk management is absolute. If we lose the recent swing low near 673, this entire recovery thesis is invalidated and I step aside immediately No emotions, just price action 💀 I am letting the chart prove itself I am locked in, patient, and ready to execute the moment the reversal confirms Are you buying this dip, or waiting for the 0.618 reclaim? #ByXIMPACT #WSOT2026 #MidtermsMarketWatch #USPayrollsAndRateDecisionsDriveMacroWeek #AnthropicIPOTestsTheAIBoom $BTCUSDT $BNBUSDT
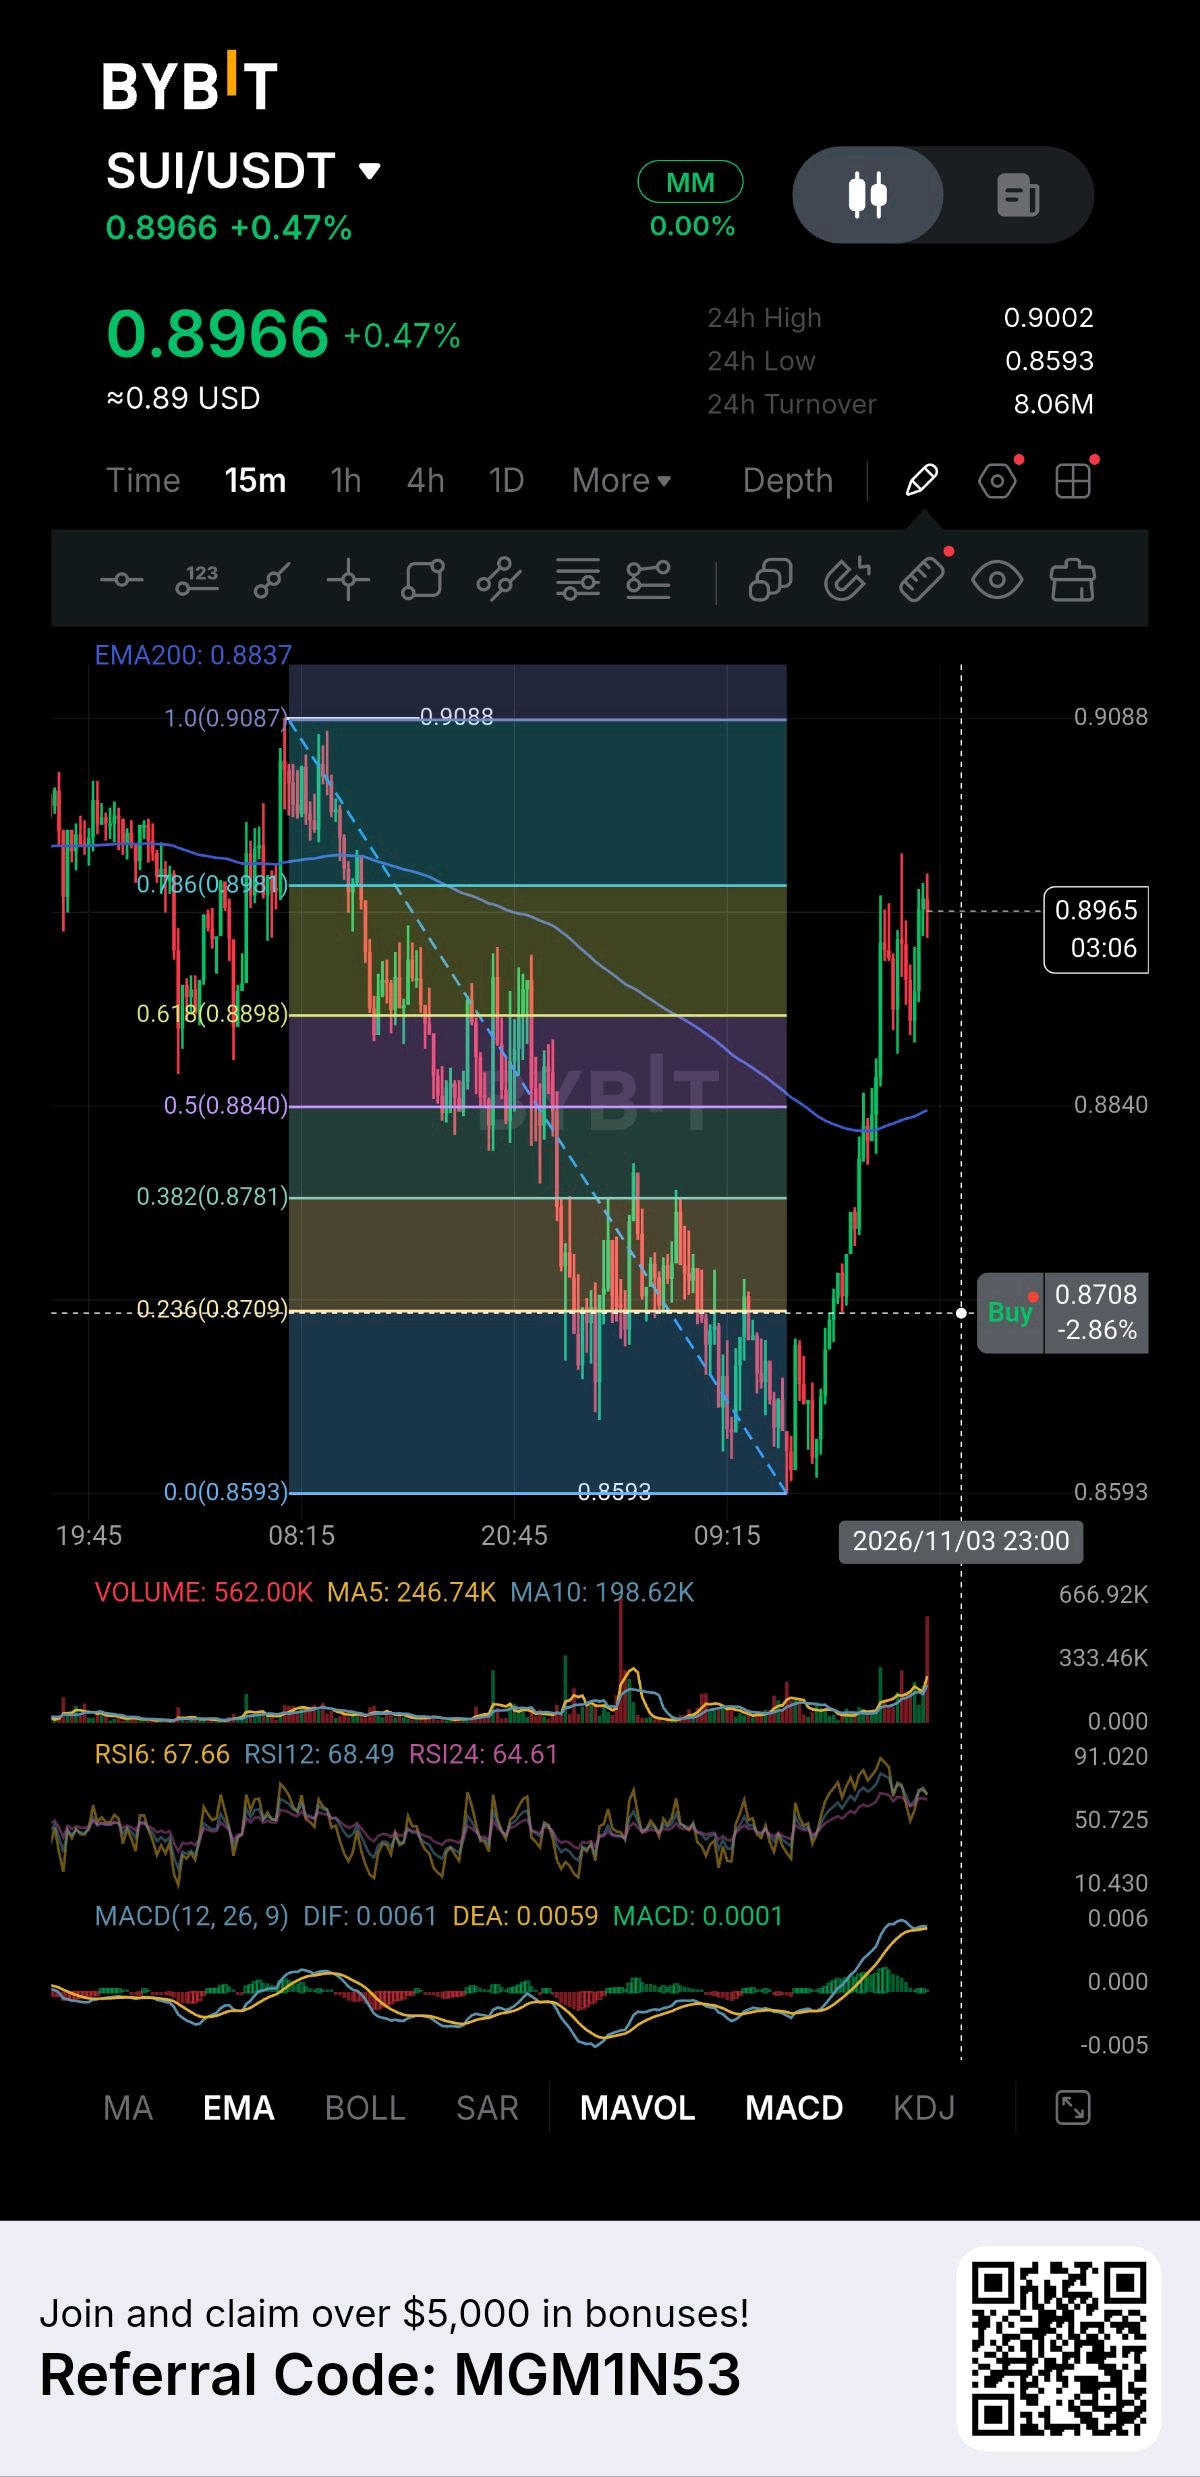
$SUIUSDT is trading around 0.8966, showing a +0.47% move, after a sharp flush from 0.9087 down to 0.8593 and a fast recovery that took back most of the drop Since that low, buyers have stepped in with real volume, pushed price through the EMA200, and now it is pressing right under the 0.786 Fibonacci level at 0.8981 👀 On the 15m chart: EMA200: 0.8837 That level lines up almost exactly with the 0.5 Fibonacci at 0.8840, which makes the 0.884-0.890 area the key support zone. Price has already reclaimed both the 0.5 and the 0.618 at 0.8898 Momentum is backing the move. RSI6 is 67.66, MACD is above zero with DIF at 0.0061 and DEA at 0.0059, and volume at 562K is far above its MA5 (246K) and MA10 (198K) But there is a contradiction here: Price is up hard, but the MACD histogram is nearly flat. The push into 0.8981-0.9002 is happening exactly where the 0.786 Fib and the 24h high stack together. That is where fast moves either break out or stall A clean 15m close above 0.9002 would give buyers their first real confirmation. From there, the swing high at 0.9087 comes back into focus But the downside remains just as important. If price pulls back, 0.884-0.890 is where I want to see buyers defend. A close below 0.8781 (0.382 Fib) would weaken the whole recovery and put 0.8593 back in play So the structure is basically: 0.8593 -> Swing low 0.8709 -> 0.236 Fib 0.8781 -> 0.382 Fib, invalidation 0.8837 -> EMA200 0.8840 -> 0.5 Fib 0.8898 -> 0.618 Fib 0.8966 -> Current price 0.8981 -> 0.786 Fib 0.9002 -> 24h high, breakout level 0.9087 -> Swing high So my setup is conditional: Pullback zone: 0.884 to 0.890 Breakout trigger: 15m close above 0.9002 with volume Invalidation: close below 0.8781 TP1: 0.9002 TP2: 0.9087 This is still a counter-trend move, because the 4h structure is down. Size it small and keep your risk tight What makes this setup interesting isn’t the +0.47% move. It’s the EMA200 and 0.5 Fib stacked right under price, after a recovery this fast I’m not chasing the candle into resistance. After a move like this, the best risk usually sits on the retest 📈 #ByXIMPACT $BTCUSDT $SUIUSDT

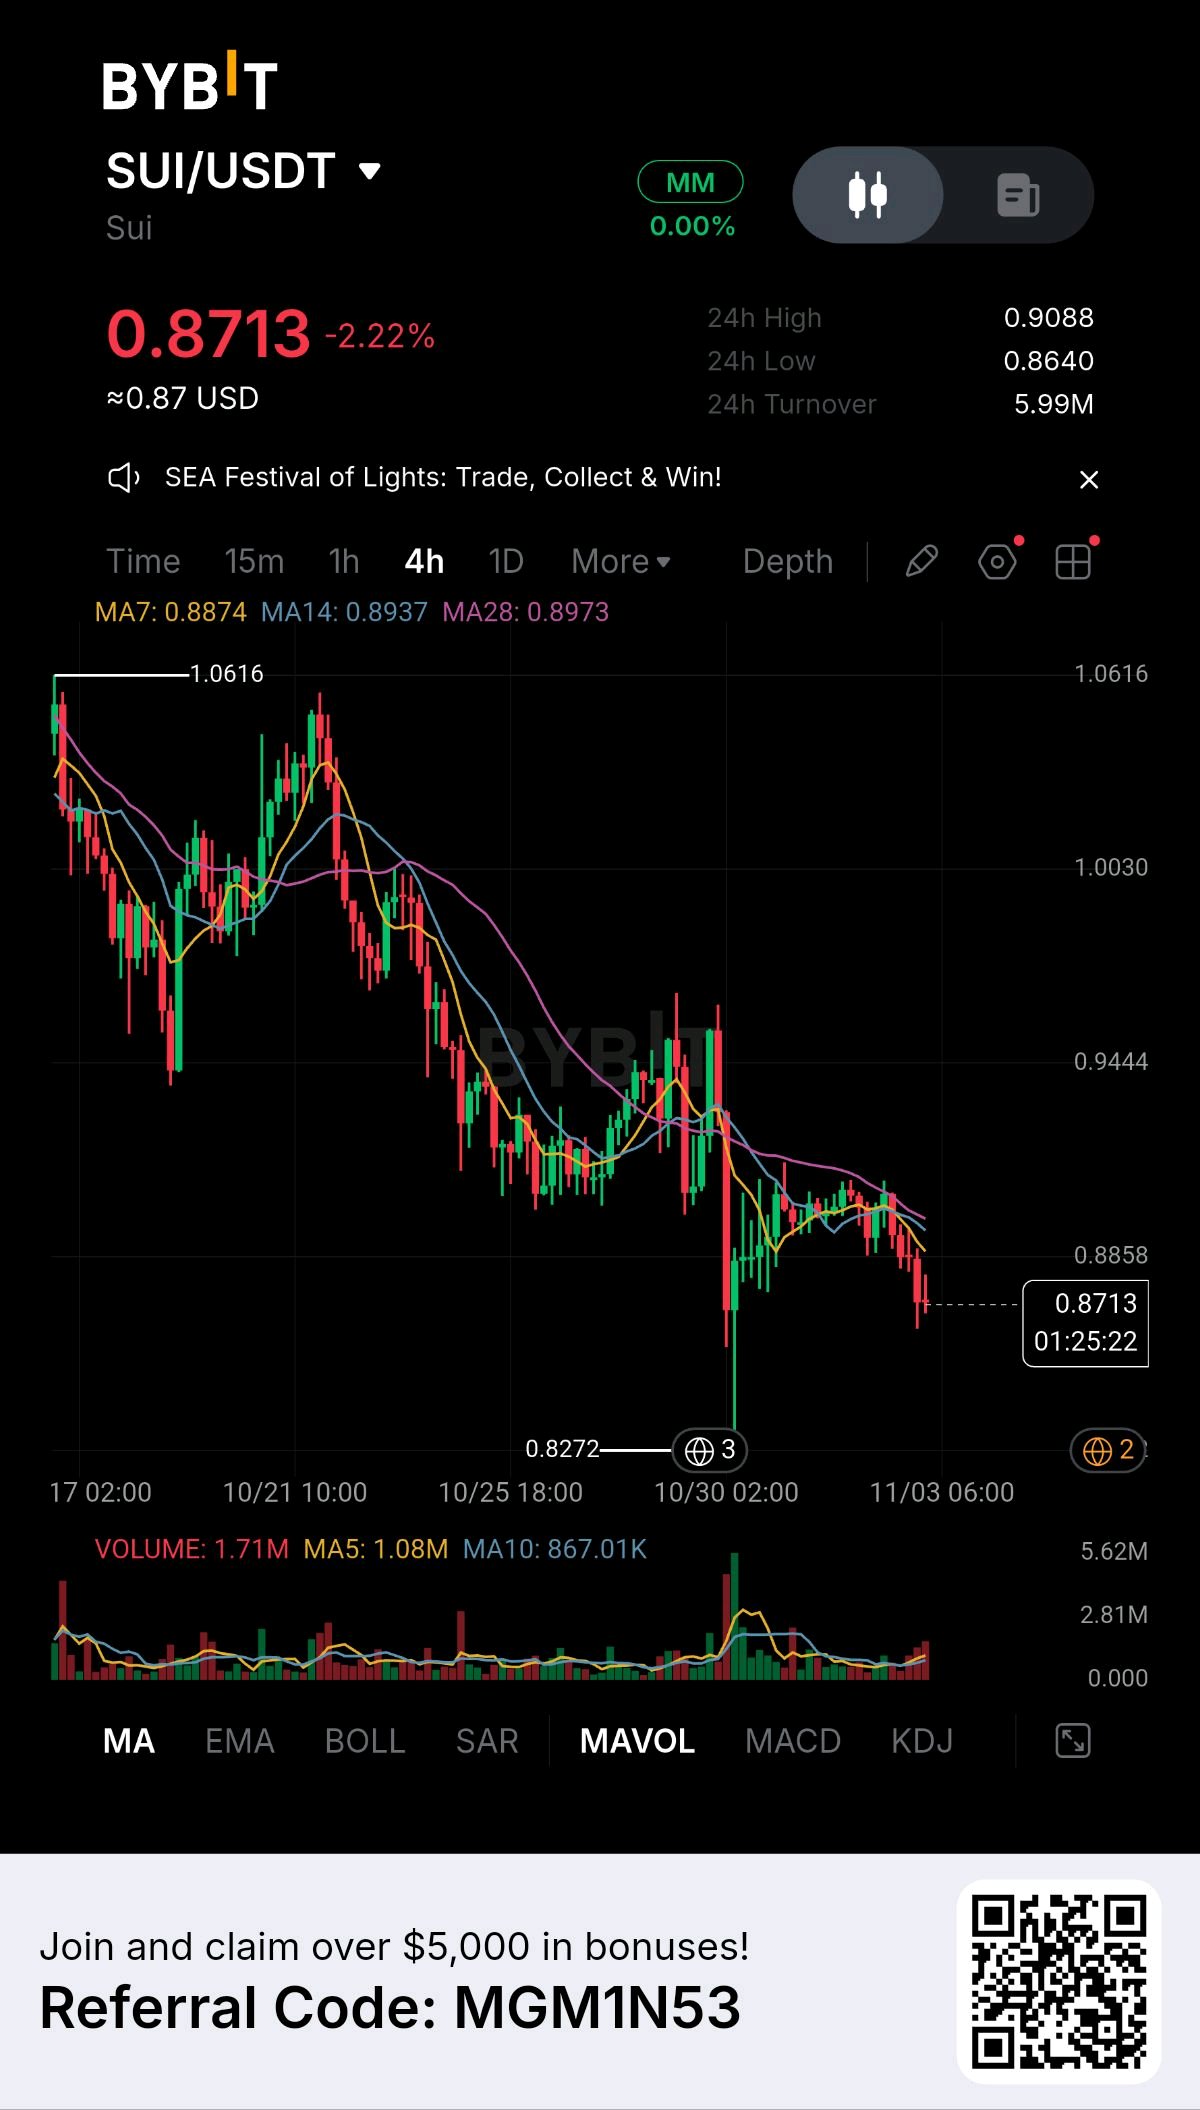
SUI: Samsung’s 82 million phones will move dollars on Sui. But the SUI token isn’t part of it. Some blockchains get adopted. Fewer manage to get their token adopted with them. Sui has had a busy October on the first part. What’s new? Samsung. Samsung Wallet is adding USDC transfers for eligible US Galaxy devices, about 82 million of them, with the rollout planned for the last week of October. Samsung named Sui and Solana as infrastructure partners. Bitcoin. Hashi, a Bitcoin lending protocol, lets native Bitcoin serve as collateral on Sui without leaving the Bitcoin network. It has more than $500 million in commitments from over 20 partners, including Anchorage Digital, BitGo, Bullish, Cumberland and FalconX, and began a phased mainnet rollout in late October. AI and speed. Sui demonstrated a peak of more than 40 million transactions per second with its Sui Tunnels technology. The Sui Foundation is also investing $30 million to bring the a16z-backed DATA Network onto Sui. My view: Sui is getting real distribution across payments, Bitcoin finance and AI data. That is not hype. But here is the catch. I read the fine print first. At launch, Samsung Wallet supports only USDC, and the Sui Foundation itself said the SUI token will not be supported. The transfers are gasless. Gas prices on Sui were also cut roughly fivefold in April, and transfers of supported stablecoins are free at the protocol level. In other words, millions of people could send dollars over Sui without ever paying a fee in SUI. The Foundation does use stablecoin yield to buy back SUI each day. But its own dashboard shows buybacks of only a few thousand dollars a day, against a market value of $3.65 billion. The number I keep coming back to is those few thousand dollars. What does the market show? SUI traded near $0.88 on November 3, down about 57% over the past year and roughly 84% below its January 2025 high of $5.37. It was down almost 30% from its late-September peak of $1.28 even as these announcements landed. Where I land: Sui is building something real. But a network that people use and a token that people need are two different things. I would watch whether Hashi’s Bitcoin lending creates demand for SUI through fees and staking, and whether the buyback grows beyond a token gesture. And here is the question: if 82 million phones can send dollars on Sui without touching SUI, what does the token actually need to do? #ByXIMPACT #WSOT2026 #BlockchainSecurity #PiecesOf8 #WSOTPicktoEarn10U $BTCUSDT $SUIUSDT
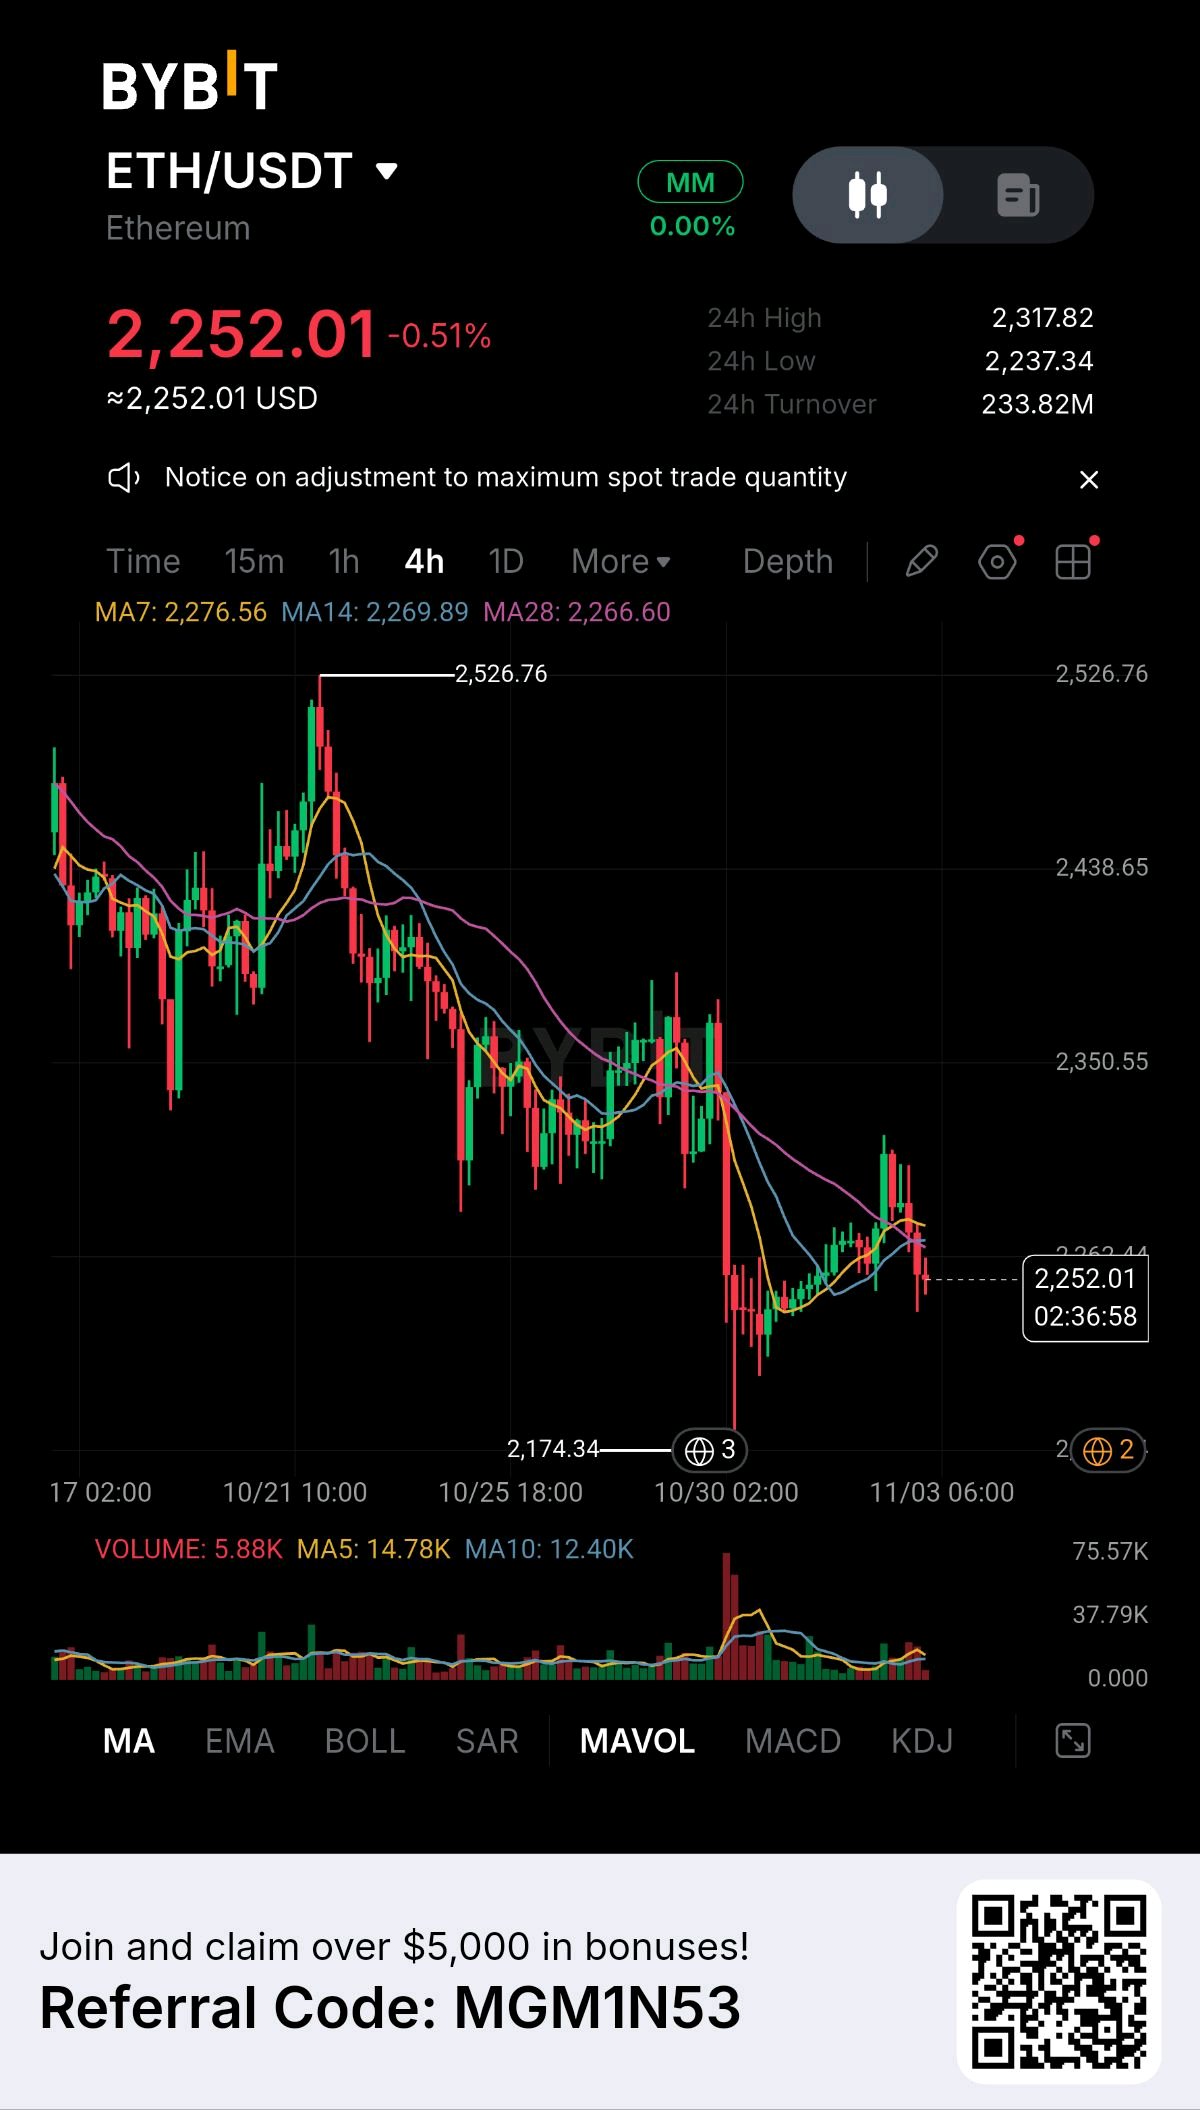
ETH: Devcon opens today and Ethereum’s own upgrade is delayed. Meanwhile ETFs pulled $431M in five days. Which one is the price listening to? 👀 I’ve been watching ETH for a few days. It’s near $2,270, down about 17% in a month and 54% below its $4,946 all-time high. Today Ethereum’s biggest conference opens in Mumbai, but the Glamsterdam upgrade that was supposed to headline it just got pushed back. The money flowing out of ETFs is saying more than the conference will. That gap is what I’m trading. 📊 Why ETH is on my screen 🔹 The delay. The Glamsterdam test on Hoodi, planned for Oct 26, was called off over how new gas rules affect existing smart contracts. There is no mainnet date. The next core dev call, on Nov 5, may give one. 🔹 The flows. US spot ETH ETFs lost $155.7M on Oct 30, the fifth straight day of outflows and $431.4M over Oct 26 to 30. BlackRock’s ETHA led with $76.6M out. 🔹 Devcon doesn’t move price. Across the last six Devcons, ETH moved less than 2% during the conference four times. It lagged Bitcoin over the next 30 days in five of six. A Devcon rally is a pattern that doesn’t exist. 🔹 The issuance fight. On Nov 4 a roundtable discusses EIP-8363, which could cut the staking yield from about 2.6% to about 1.2%. Less new supply helps the token, but lower yield hurts stakers. 🎯 Levels I’m watching $2,520: the 50-day average, the hurdle for any new uptrend $2,391: the high before the recent flush $2,300 to $2,310: nearest resistance $2,240 to $2,250: first support, the 24h low $2,160 to $2,174: important support, the flush low stacked on the 200-day average How I’d play it: LONG only after a daily close above $2,310 and a clean retest. Example: enter $2,310, stop below $2,265, first target $2,391 (about 1.8R), second target $2,520 (about 4.6R). SHORT only if $2,160 breaks and price fails to climb back over it. In the middle, I stay out. RSI near 34 means it’s oversold, not reversed, and a bounce on fading volume is not a trend. One nuance: it’s election day, there’s a jobs report on Nov 6, and the Binance hack is still weighing on the market. Any of these can move ETH more than a talk in Mumbai. Ethereum’s best developers are meeting this week, the upgrade has no date, and ETFs keep selling. Does the conference mark the bottom, or does the price keep following the flows? #ByXIMPACT #WSOT2026 #BlockchainSecurity #MidtermsMarketWatch #NewFinancialPlatform $ETHUSDT $BTCUSDT
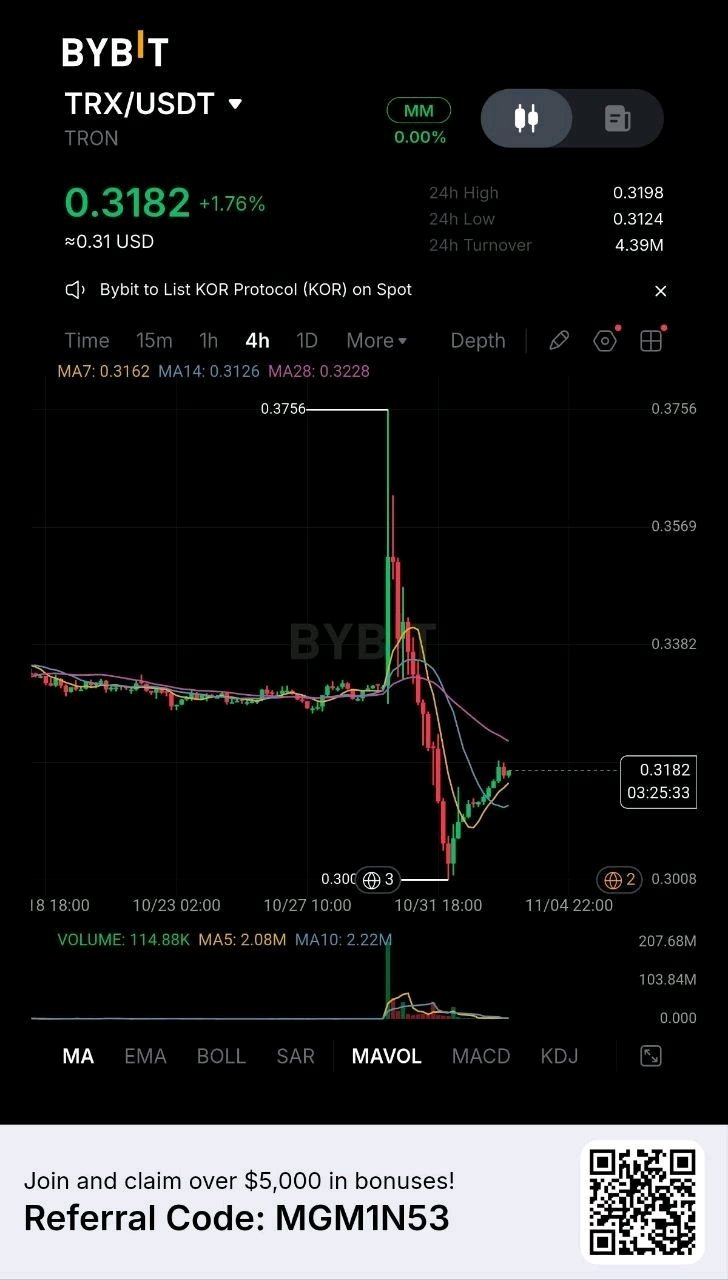
$TRXUSDT is bouncing, and the biggest known overhang on the chart has mostly cleared. Price is 0.3182, up 1.76% today and about 6% above the 0.3008 low. It’s still about 15% below the 0.3756 spike high, and about 4% below where it traded before the exchange hack. Here’s what changed. Elliptic’s latest report says the attacker’s main Tron wallet sent out TRX in 1,113 separate transfers between October 30 and November 1, until it was almost empty, and that almost all of the stolen TRX has now been laundered. The stash that was hanging over the chart has largely left the chain. But the supply didn’t disappear, it moved. The TRX was laundered through bridges to Ethereum and split across hundreds of fresh wallets, and the attacker now controls about $3.25 billion of assets that issuers can’t freeze, including roughly 584,000 ETH. Turnover The 24-hour turnover is 4.39M, with a tight range (0.3124 to 0.3198). That’s quiet, and quiet is what you want after a flush. It’s what a base looks like before it breaks. Volume The volume spike from the attacker’s buying and selling has rolled off the averages: the MA5 (2.08M) and the MA10 (2.22M) are now almost level. The current 4h candle has just opened, so its own reading is incomplete. The market is no longer reacting to the attacker’s flow, and what’s left is ordinary trading. The next move will come from real buyers and sellers. Moving Averages MA7: 0.3162 | MA14: 0.3126 | MA28: 0.3228 Price (0.3182) is above MA7 and MA14, and MA7 is above MA14, which is a short-term bullish cross. MA28 is the lid, about 1.4% overhead and still sloping down. MA14 (0.3126) lines up almost exactly with the 24h low (0.3124), so that zone is a double support. Levels to watch · 0.3756 — The spike high from the attacker’s buying. · 0.33 — The roughly 0.33 level where TRX traded before the attack. · 0.3228 — MA28, the line to reclaim. · 0.3198 — The 24h high. · 0.3182 — Where we are right now. · 0.3162 — MA7, the first support. · 0.3126 — MA14 and the 24h low, the base to protect. · 0.3008 — The low of the move. Consideration If the overhang is mostly gone, the discount to the pre-hack price should close. It hasn’t yet. One analysis argues the market treats the attacker’s stash as unresolved while price stays under about 0.331. Either the market doesn’t believe the stash is cleared, or demand is simply weak. Also, the attacker still holds assets that can’t be frozen, and Tether froze about $378.7 million of USDT, which does nothing for TRX itself. So the main seller is nearly done, but the chart hasn’t proven it yet. Trade plan · The Bullish Path: We need a strong 4h close above 0.3228 (MA28) to show buyers are in control. If that holds, the next area to watch is the 0.33 pre-hack level. · The Bearish Path: If we lose the 0.3124 to 0.3126 base, it likely retests the 0.3008 low. · My take: I’m staying patient. The overhang is smaller and the averages are turning up, but price is still under MA28 and below its pre-hack level. I want to see 0.3126 hold and a confirmed 4h close above 0.3228 before looking for a long. Support and resistance Support: 0.3162 (MA7) → 0.3126 (MA14 / 24h low) → 0.3008 (move low) Resistance: 0.3198 (24h high) → 0.3228 (MA28) → 0.33 (pre-hack level) Invalidation and risk note This setup is invalidated if we close a 4h candle below 0.3124. The biggest risk is that the market is still pricing in supply that sits in other wallets, so one more large move of stolen funds can drag price down even when the chart looks calm. Don’t guess the direction, wait for the break. #ByXIMPACT #WSOT2026 #BlockchainSecurity #NewFinancialPlatform #MidtermsMarketWatch $BTCUSDT $TRXUSDT
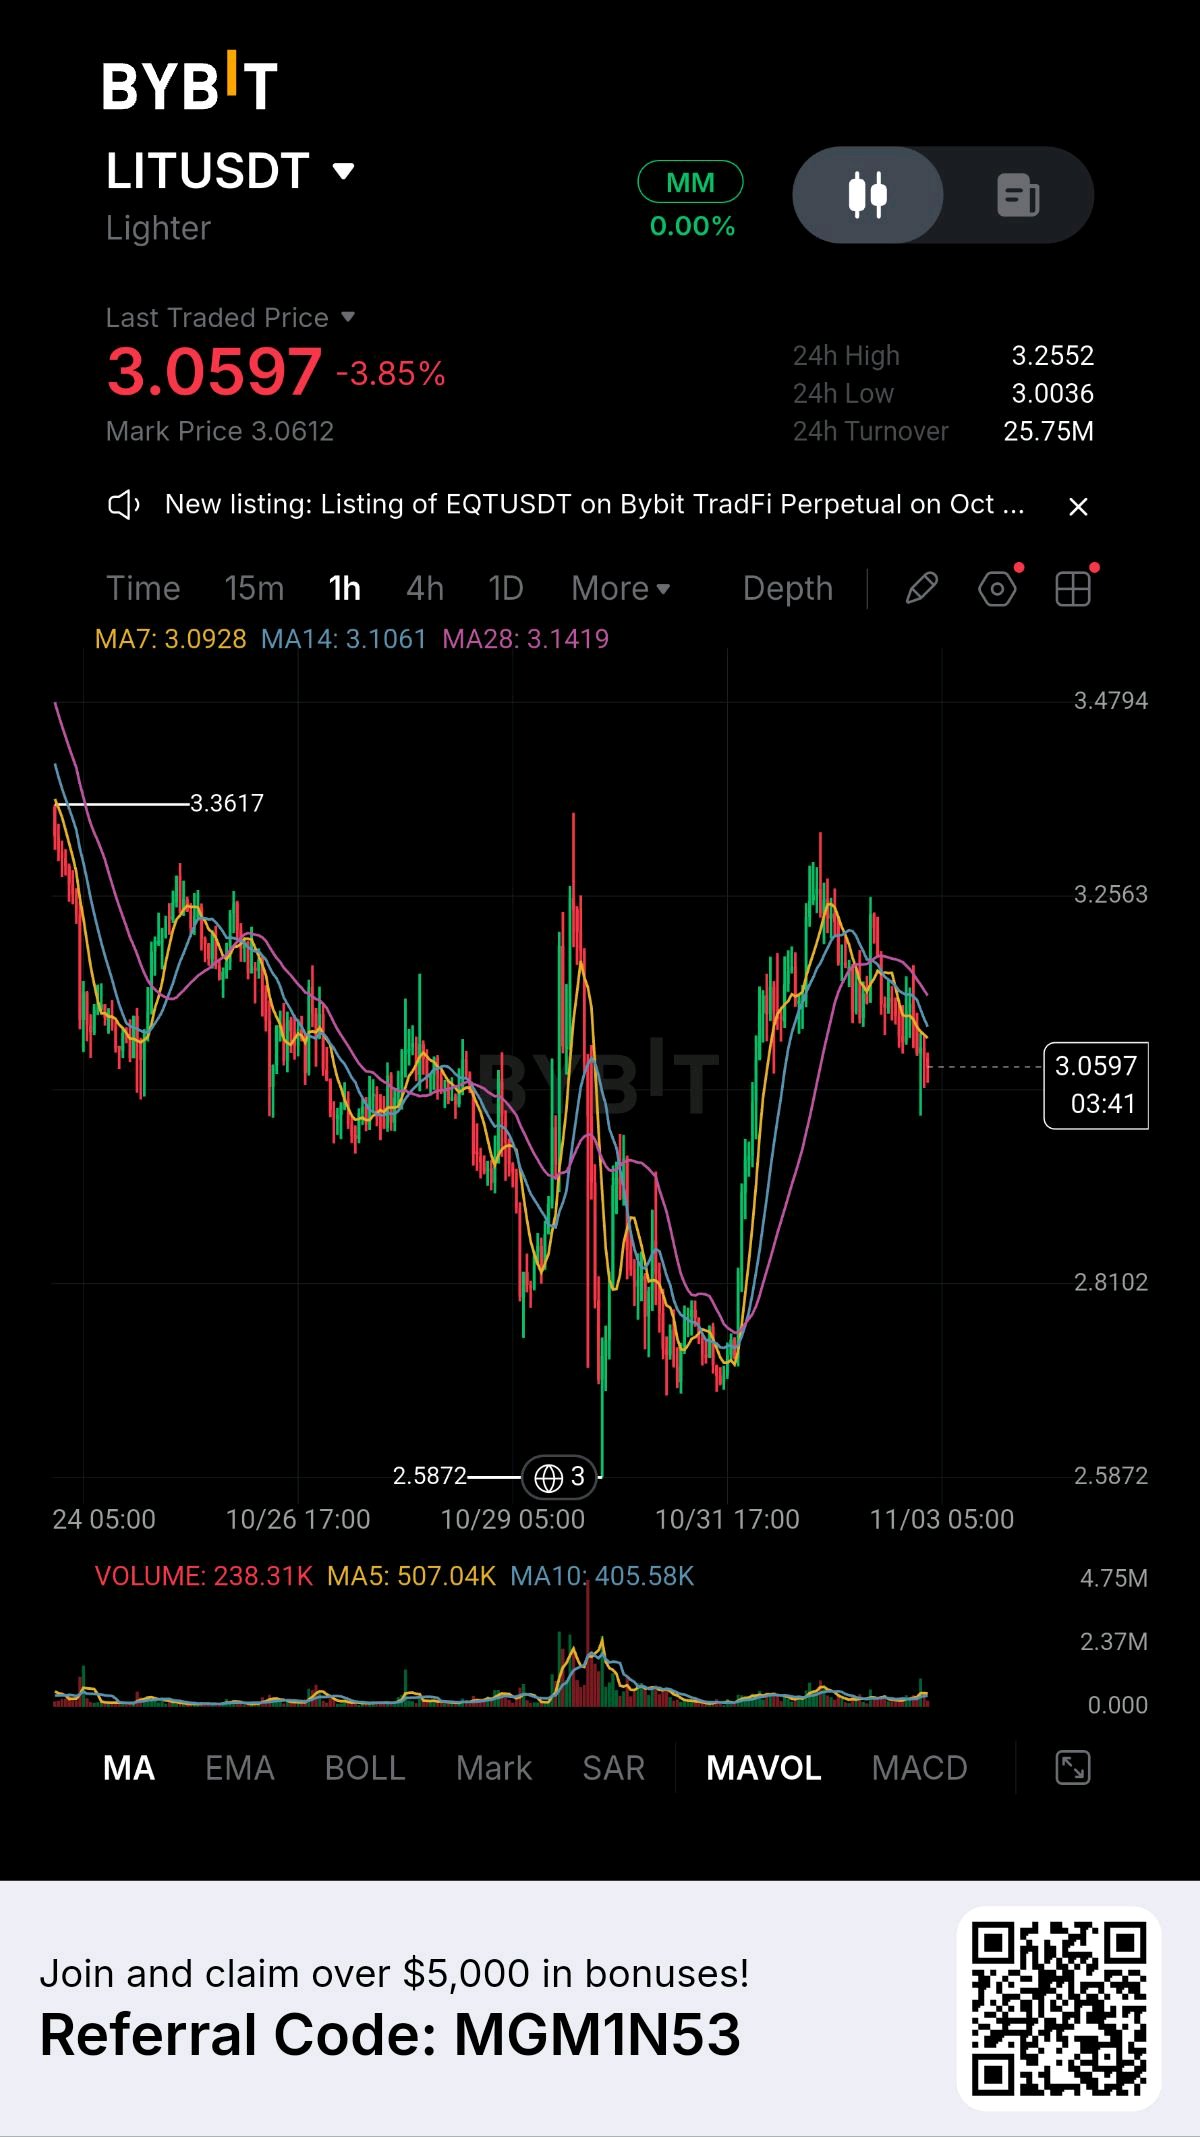
LIT: a licence filing the market already sold once, and buybacks that follow volume. I’m taking a small long to see which one it pays for. Two stories, one position. The risk is that if it stops out, I won’t be able to tell which one was wrong. My Play 📊 TRADE: LONG LIT/USDT Entry: $3.13 (market) Stop loss: $3.03 Take profit: $3.45 Leverage: 5x Size: 10 LIT (about 31.3 USDT notional, 6.26 USDT margin) Stop loss : −1.00 USDT (price move −3.2%, ROI about −16%) 🤔 Why I’m taking it On Oct 21, Lighter’s CEO said on the Q3 call that the company plans to file with the CFTC in November, for both a trading venue (DCM) and a clearing house (DCO). LIT jumped about 21% to $3.88, with an intraday high near $3.97. It didn’t hold. By Nov 2 it was $3.13, down about 10% over 30 days and well below the September high above $5. No application has been filed yet, and the review can take up to 180 days. The second story is the money going back to holders. DefiLlama shows $4.11M flowing to LIT holders in October, up 55% from $2.66M in September. But I checked how it was spread. About $1.4M, roughly a third of the month, came on Oct 28 and 29, when the Binance hack shook the market. On Nov 1 it was only $48.6K. So buybacks follow trading volume. They aren’t a steady bid. The rest of the picture is mixed. Open interest on Lighter fell from about $760M to $718M after the hack, and TVL from $828M to $795M, so some capital left but most stayed. Only about 250M of the 1B LIT supply circulates, and team and investor vesting starts Dec 27. I’m not saying either story is priced wrong. What interests me is a narrower question: after the market already sold the filing headline once, does $3.00 hold while buybacks are running, or does supply decide it anyway? 🔑 Key levels 🔹 Support: $3.00 to $3.10 🔹 Below that: $2.50 to $2.75 🔹 Broken October trend line: $3.40 to $3.50 🔹 My entry: $3.13 🔹 My stop: $3.03 ⚠️ Risk At 5x, a 3.2% move against me costs about 16% of margin, so even a tight stop is a real hit on the position. A filing is not an approval, and buybacks shrink fast when volume dries up. The whole market is also under pressure, with Bitcoin down about 4% on the day and Binance pausing withdrawals, so a good story can still get sold with everything else. 📝 My View I’m putting two ideas into one trade: the licence news and the buybacks. If the stop hits, I won’t be able to say which one failed, or whether either did. A stop-out only tells me the entry was wrong. It doesn’t grade the idea, and two ideas in one position can’t be graded at all. The dollar risk is small, 1.00 USDT on 10 LIT, but at 5x it’s still about 16% of the margin I put up. Small size keeps the loss cheap. It doesn’t make the idea testable. Next time it’s one trade and one question. If I want to know whether the market pays for the licence news, I trade that and nothing else. #ByXIMPACT #WSOT2026 #BlockchainSecurity #NewFinancialPlatform #MidtermsMarketWatch $BTCUSDT $LITUSDT
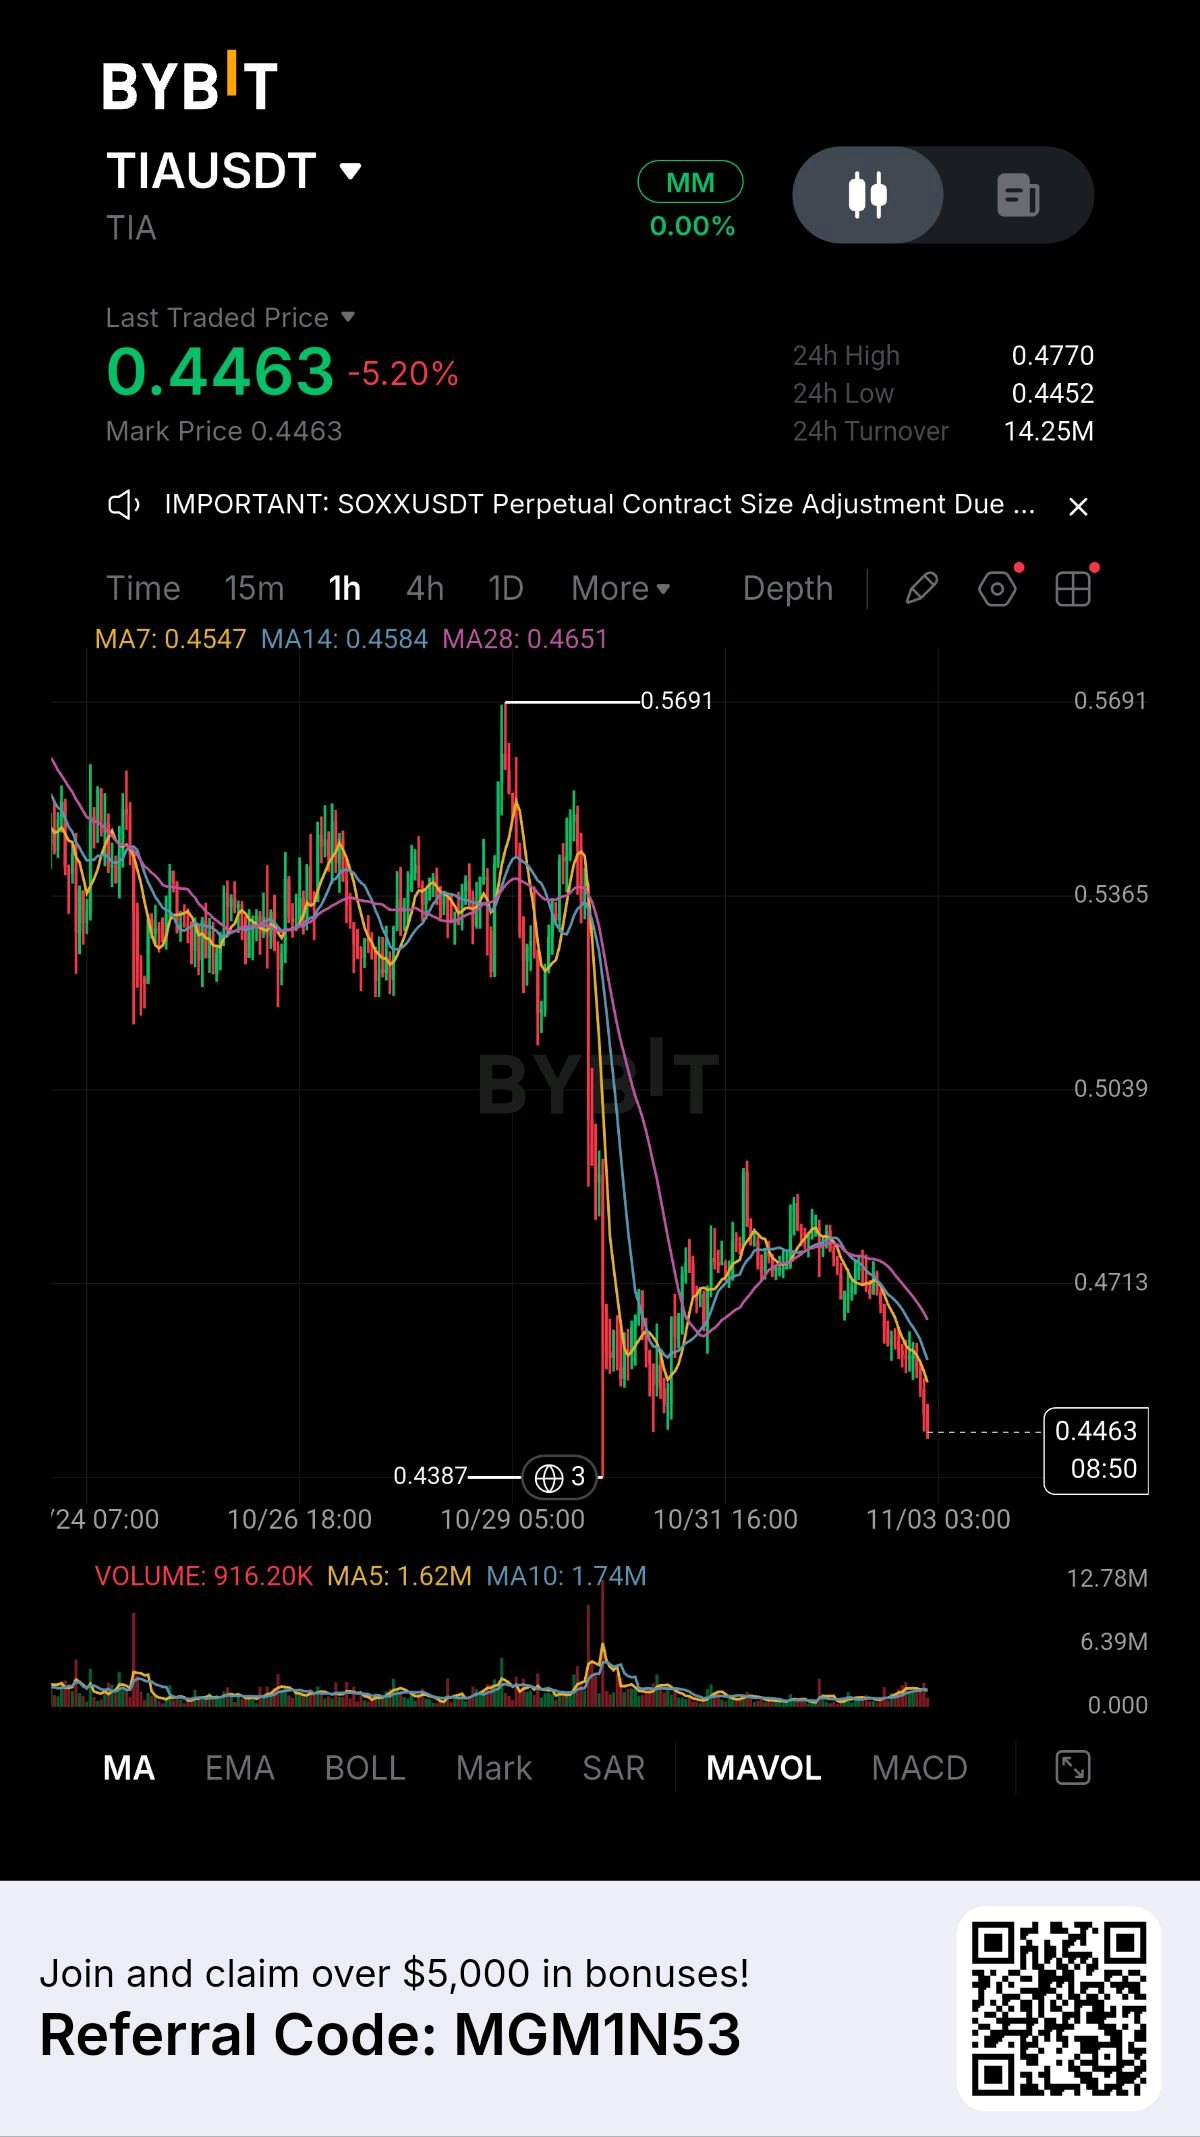
TIA: Celestia posted a 3 terabit per second number, and blob usage kept slipping. 👀 I’ve recently been watching how TIA behaves. Celestia reported 3.07 terabits per second for its Fibre network in early October, and TIA climbed about 59% in four weeks to mid-October. But one report noted that daily blob data fell during the rally, and the price is back near $0.46 after a 13% drop on Oct 30. To me, that matters more than one green candle. 📊 What is keeping TIA on the radar? 🔹 The benchmark is a lab test. Celestia itself called it an experimental benchmark on rented cloud infrastructure, not live mainnet throughput. The test used 2-gigabyte blobs, far larger than the planned 128-megabyte mainnet cap. 🔹 The rally looked like a squeeze. A one-day jump of about 25% in mid-October was tied by one summary to short covering, and shorts closing aren’t the same as new buyers. 🔹 Ignore the “$1.1B unlock” posts. Several articles describe a 175.75M TIA unlock on Oct 31, and that was the 2024 event. The 2026 schedule I found shows only a small release, around 0.6% of market cap. 🔹 Supply never stops. TIA’s supply is uncapped, with inflation of about 2.5% falling toward 1.5%, so new tokens keep arriving. TIA is also about 98% below its all-time high of roughly $20.85. 🎯 What levels are important right now? $0.481 to $0.514 — nearest resistance, the old support zone. $0.544 to $0.57 — the next target if the bounce continues, the 7-day average and the Oct 22 level. $0.457 — important support, the Oct 30 swing low. $0.42 to $0.44 — the next zone of interest for sellers in case of a breakdown. My trading logic: I will consider a LONG after a daily close above $0.514 and a successful retest, with blob usage stabilizing. SHORT becomes more interesting if the price loses $0.457 and cannot return above it. But there is one nuance: a strong technical headline is not demand. If usage doesn’t follow the benchmark, the rally can fade as quickly as it came. My conclusion: TIA is worth attention right now not because of hype, but because of the gap between the Fibre headline and what the network is actually used for. I’m waiting for the price to confirm before risking capital. Celestia posted 3 terabits per second in a lab, and daily blob data fell during the rally. Is TIA the best data layer in crypto, or a benchmark story priced as if the usage already exists? #ByXIMPACT #WSOT2026 #BlockchainSecurity #MidtermsMarketWatch #NewFinancialPlatform $BTCUSDT $TIAUSDT
HYPERLIQUID (HYPE): the owner of the NYSE wants to bring its markets to America. But ICE didn’t buy HYPE. For years, Wall Street treated Hyperliquid as something to watch from a distance. This week, one of its biggest names chose to build on it. What’s new? The deal. On October 29, Intercontinental Exchange (ICE), the parent of the NYSE, signed an agreement with Trade[XYZ] to build a US-regulated market for perpetual futures on Hyperliquid’s infrastructure. ICE will be the exclusive operator of Trade[XYZ]’s regulated markets and is taking an undisclosed minority stake in the company. The scale. Trade[XYZ] says its markets on Hyperliquid have processed more than $650 billion in trading volume in just over a year. The planned US venue would offer 24/7 perpetual futures on stocks, indexes, commodities and currencies. The backing. Investor Stanley Druckenmiller disclosed his own stake in Trade[XYZ] on the same day. The deal still needs CFTC approval and has no launch date. The CFTC opened a path for perpetual futures in the US in May. My view: this is the first time a major traditional exchange operator is building on Hyperliquid’s technology instead of competing with it. But there is one important detail. I looked first at what ICE actually bought. It took a stake in Trade[XYZ], not in HYPE. The announcement does not describe a direct investment in HYPE, and it does not say whether any US market revenue would go to HYPE holders. The regulated venue is also planned to have its own clearing, identity checks and compliance systems. So HYPE only benefits if this volume ends up using Hyperliquid’s infrastructure in a way that feeds the token. What does the market show? HYPE jumped as much as 15% on the news and moved toward its record near $98. Over the past 30 days it was the only major asset to rise, up about 5.7% while Bitcoin fell 6.2%. The number I keep coming back to is $650 billion. It proves that demand for these markets exists, but it does not tell us how much of it reaches HYPE. Where I land: Hyperliquid’s technology just got the strongest endorsement it has had from traditional finance. But an endorsement of the technology and a claim on the token are not the same thing. I would watch the CFTC approval, the details of how fees flow, and the next team unlock, which is expected around November 6. And here is the question: if America’s biggest exchange operator builds on Hyperliquid, will any of it reach HYPE holders? #ByXIMPACT #WSOT2026 #BlockchainSecurity #PiecesOf8 #MidtermsMarketWatch $BTCUSDT $HYPEUSDT
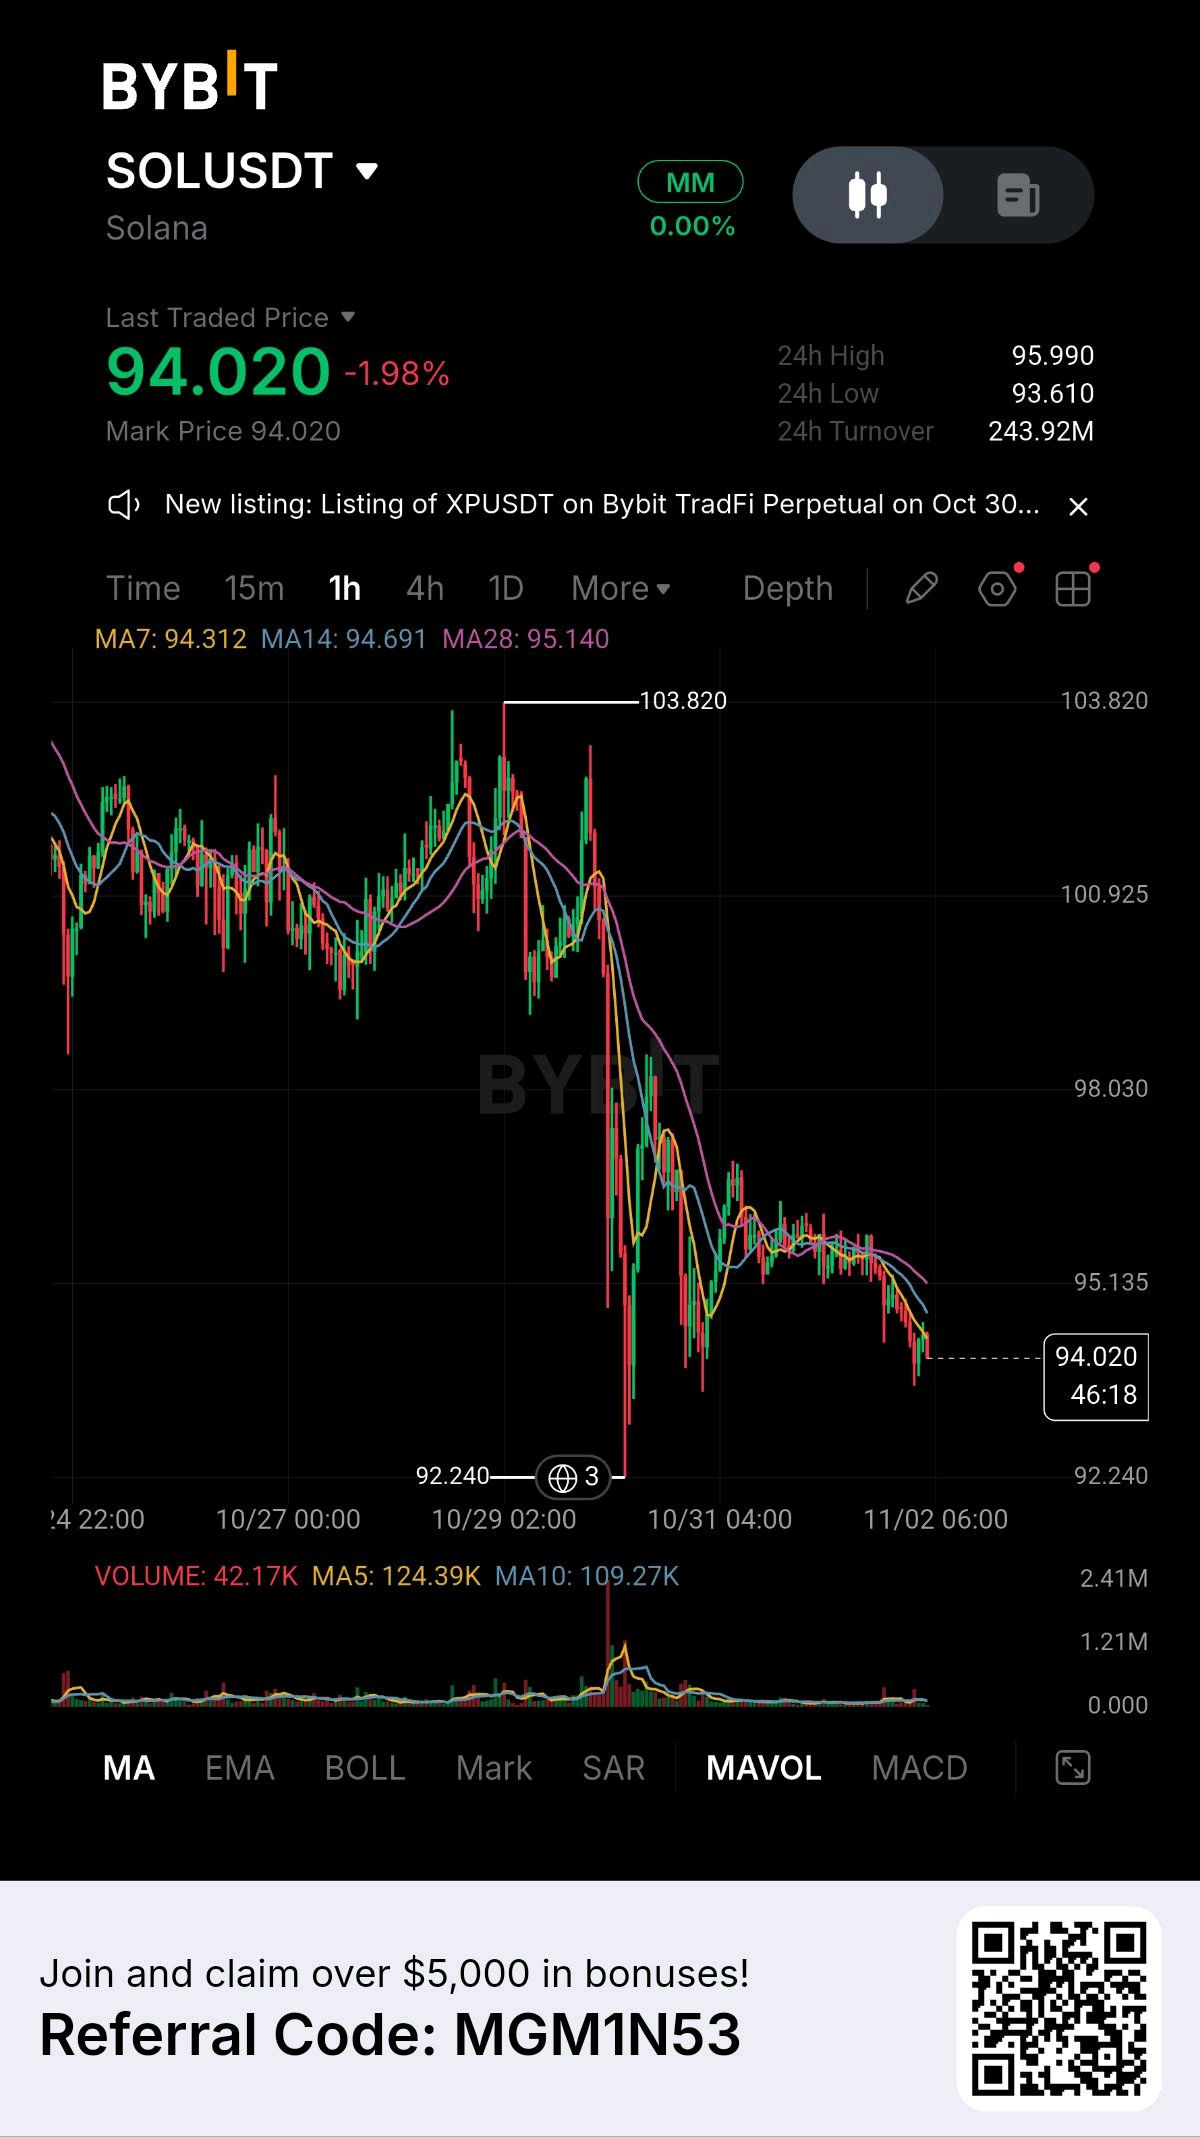
SOL is sitting on the one level that decides whether the Binance-hack dump was the low or just the first leg. I’m planning a long, not taking it yet. I’ve been watching SOL since the Oct 29 sell-off. Price is around $94-95, down about 6% on the week after the Alpenglow upgrade, and it printed a low of $92.14 on Oct 30. This is my plan for a trade I haven’t placed. Nothing here is a filled position. 📊 My Plan PLAN: LONG SOL/USDT (not executed) Entry: $95.00 Stop loss: $91.80 (below the Oct 30 low) Leverage: 3x Size: 0.15 SOL (about 14.25 USDT position, about 4.75 USDT margin) Target 1: $100 (about +0.75 USDT, +16% on margin) Target 2: $105 (about +1.50 USDT, +32% on margin) Max loss at stop: about 0.48 USDT (roughly 10% of margin) 🤔 Why I’d take it Three things line up at $93-95. It’s the zone that caught the Oct 30 low. Open interest dropped about 12% after the liquidation flush, so a lot of the leveraged longs are already gone. And Solana led all chains with over $900M in RWA net inflows over 30 days, so the activity story is still intact. ⚠️ Why I might not SOL ETFs saw $19M in outflows on Oct 27, their biggest daily outflow since December. The 20/50-day EMA cross is bearish, and price is under the 20-week EMA near $98.5. Every bounce since the September high of about $125 has stalled below $100-105. The bearish read isn’t wrong. It’s just not proven yet. 🔐 Key levels 🔹 Support: $92-95 🔹 Reclaim: $98.5 (20-week EMA), then $100 🔹 Wall: $105-106 (daily midline and 50-week EMA) 🔹 Invalidation: a daily close under $91.8, and then $82 is in play 📝 How I’d play it I’d use a limit entry near $95, not a market buy. If $92 breaks, I’m out with no second guessing, and I won’t average down. I’d take half off at $100 and move the stop to entry. The size is small on purpose: a stop-out costs about 0.48 USDT, so a wrong call stays cheap. At 3x the stop costs about 10% of margin. At 10x the same stop would cost over a third, and the idea would be the same. If SOL can’t hold a 6% week-on-week drop after record RWA inflows, is Solana’s activity story actually priced in, or is $100 just a ceiling that every long gets trapped under? #ByXIMPACT #WSOT2026 #BlockchainSecurity #PiecesOf8 #MidtermsMarketWatch $SOLUSDT $BTCUSDT
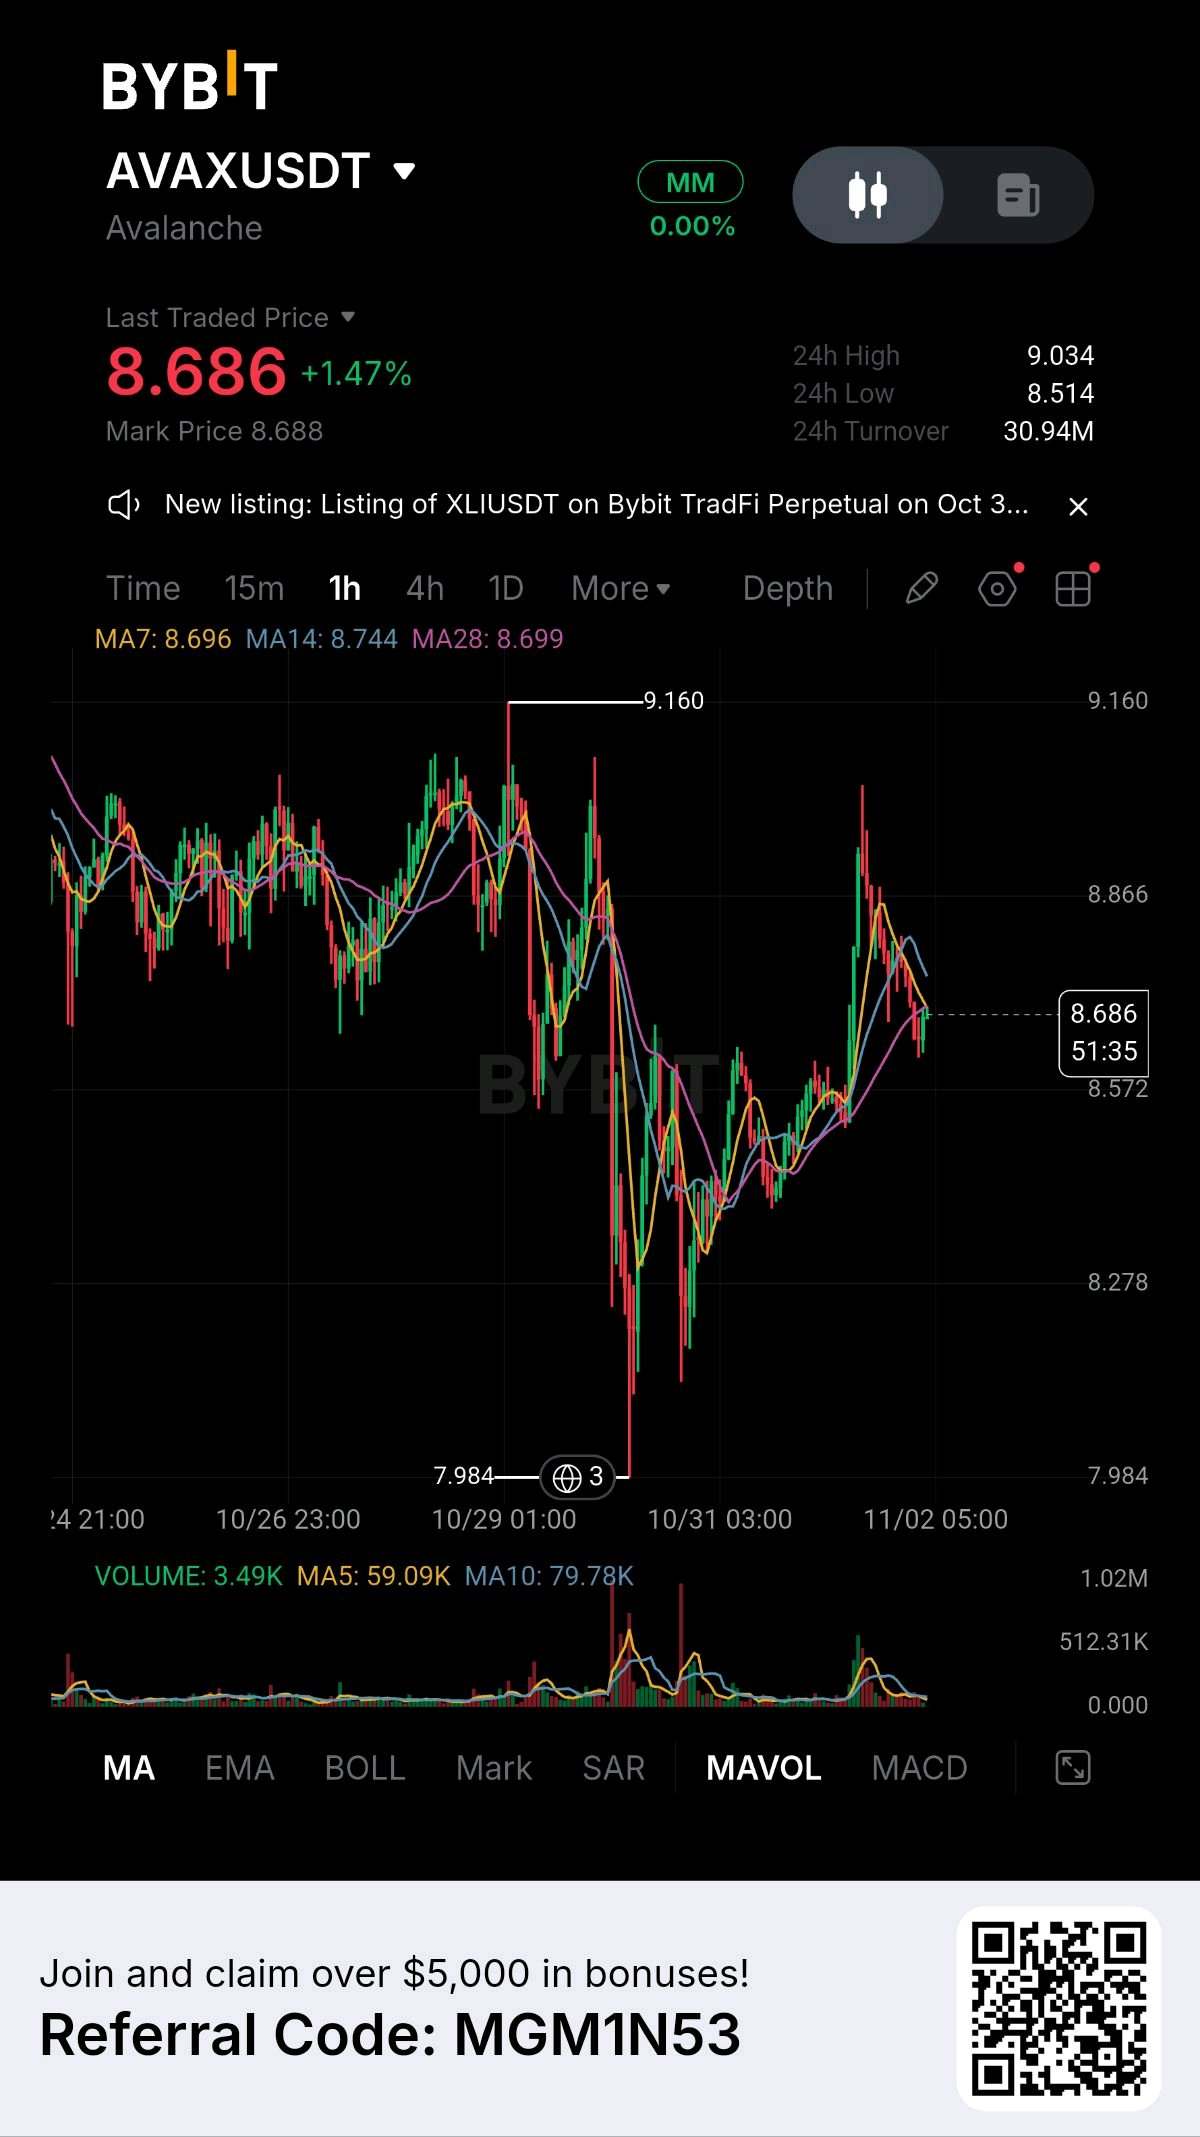
AVALANCHE (AVAX): banks and asset managers keep building on it. But who is actually buying the token? Hype is easy to see on a chart. Real adoption shows up in migrations and contracts. Avalanche has been collecting the second kind. What’s new? Progmat. Japan’s largest tokenized securities platform moved more than $2 billion of tokenized real estate and corporate bonds to Avalanche. The migration finished in July with no disruption for the financial institutions using it. BlackRock. About $484 million of BlackRock’s tokenized Treasury fund, BUIDL, now sits on Avalanche, which hosts 1,255 tokenized real-world assets in total. Schwab. On October 21, research from Charles Schwab named Avalanche a leader in real-world assets and custom blockchains. Schwab Crypto also plans to add AVAX trading by the end of 2026. My view: this is no longer a list of experiments. Existing financial products are choosing Avalanche as their home. But there is a catch for token holders. Schwab’s own analysis points out that strong activity on the network does not automatically create demand for AVAX. That is the part I looked at first. A fund can live on a blockchain without anyone buying much of its token. The question is not whether institutions use Avalanche. It is whether they need AVAX to do it. What about the market? AVAX traded near $8.80 on November 1 after a 4% daily gain, up from about $7.25 in late August. But it is still roughly 94% below its 2021 high of $146.22. The number I keep coming back to is $484 million. That is a large fund sitting on Avalanche, and it shows how far real usage can grow without telling us anything about demand for the coin. Where I land: Avalanche may well become one of the places where traditional assets settle. But a successful network and a rising token are two different outcomes. I would watch whether new institutional chains and products create repeated, real demand for AVAX, instead of reacting to every partnership headline. And here is the question: if banks and asset managers keep building on Avalanche, will they ever need to buy AVAX to do it? #ByXIMPACT #WSOT2026 #BlockchainSecurity #PiecesOf8 #IMPACTbyTrade $BTCUSDT $AVAXUSDT
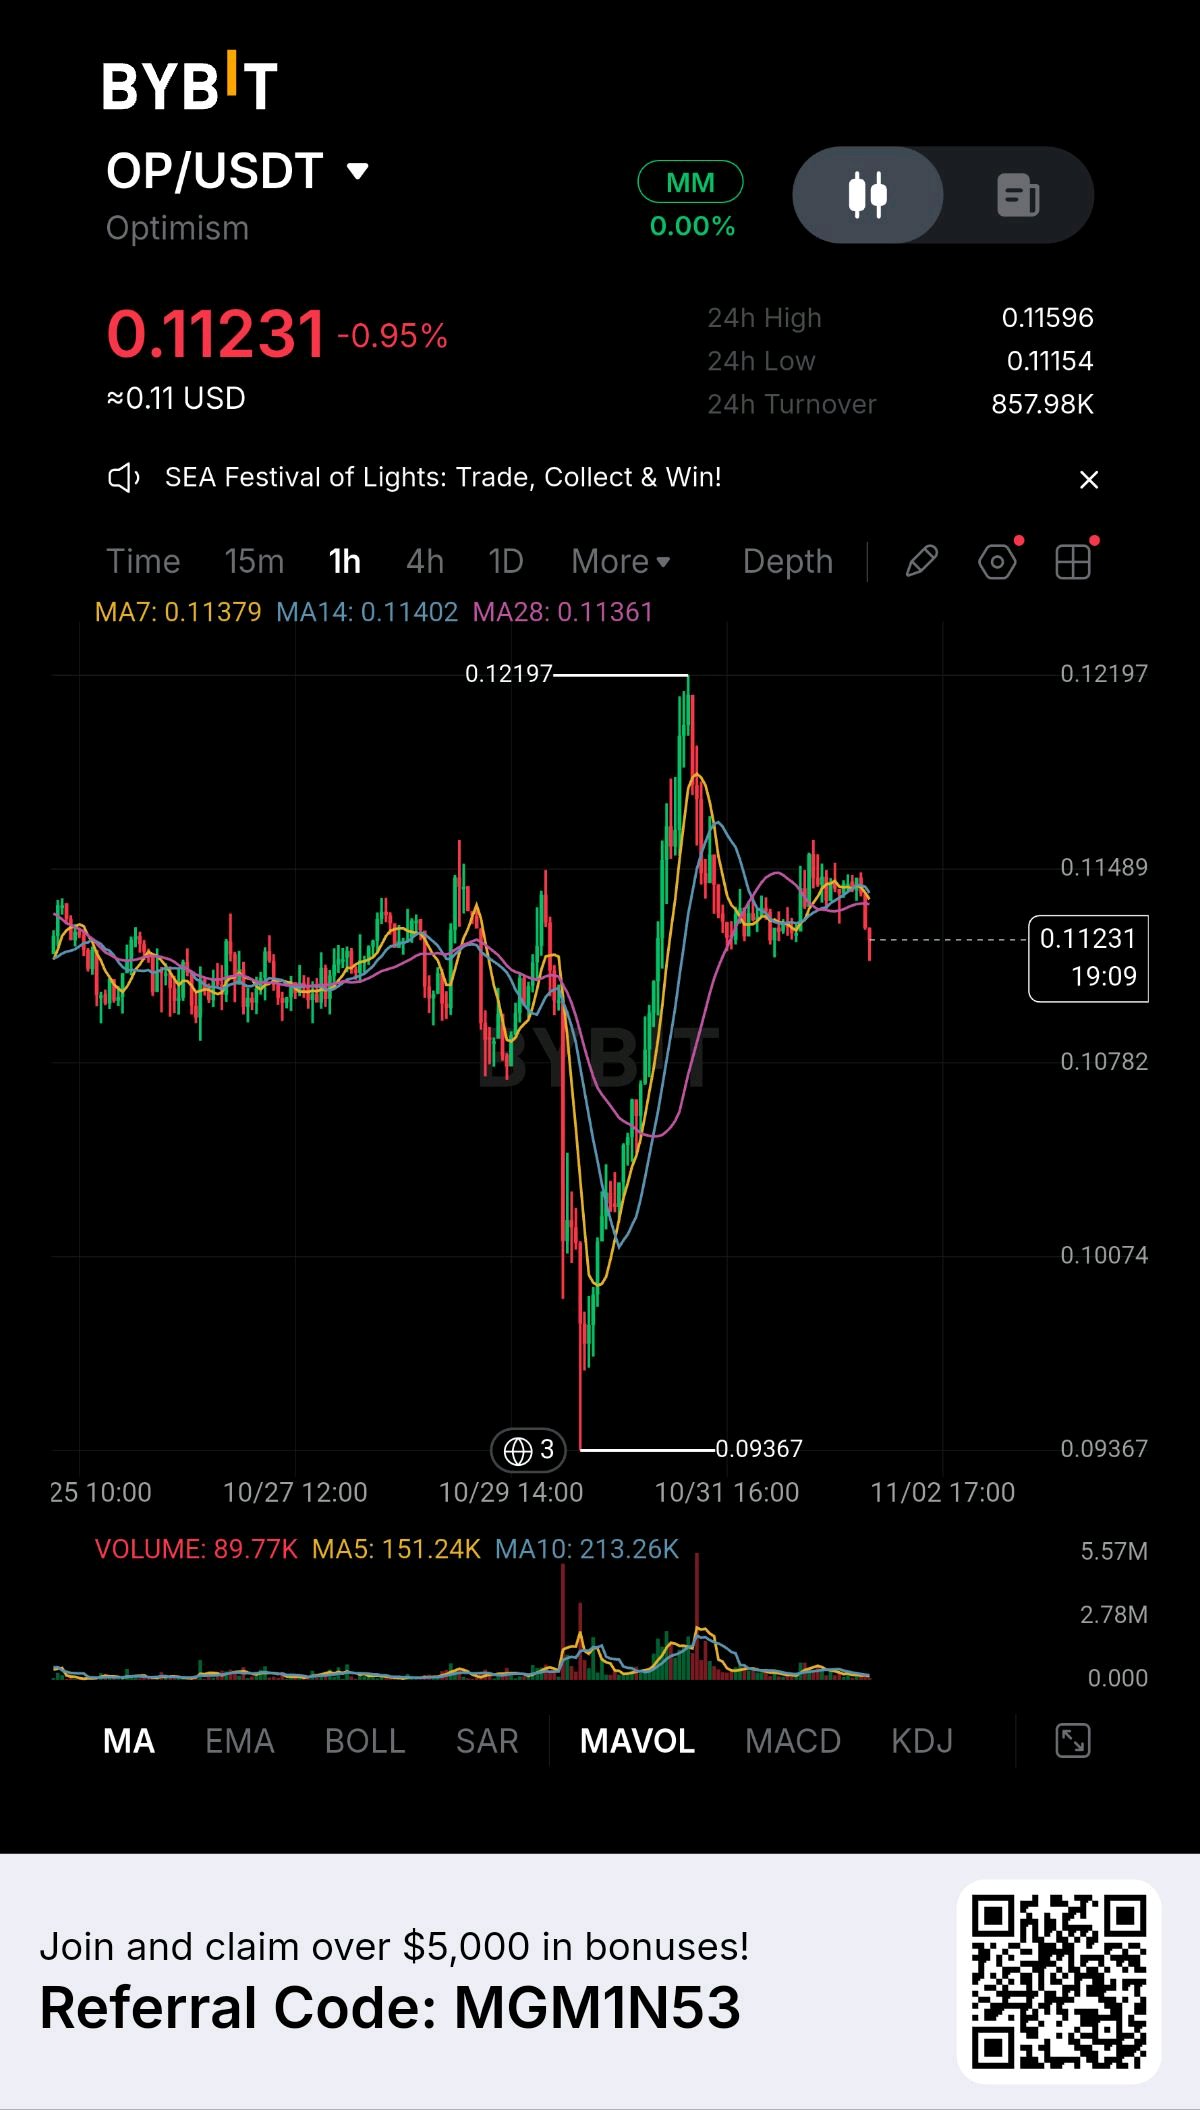
OP: up 23% in hours on a proposal that could shrink its own buyback. 👀 I’ve recently been watching how OP behaves after a rough week. It was down about 14% over seven days with open interest jumping, then spiked to $0.1211 on Oct 31 before fading toward $0.114. That’s a big move for a proposal that takes money away from its own buyback. 📊 What is behind the move? 🔹 The trigger. On Oct 29 the Optimism Foundation proposed refunding part of the sequencer and priority fees, paid in ETH, to partners that bring key activity to OP Mainnet. Payouts are capped at each partner’s fee contribution, and no OP tokens are used. 🔹 The catch. Those rebates come out of the same revenue pool that funds the Superchain buyback, so the buyback could shrink. The proposal doesn’t say by how much. 🔹 The buyback is small. About 9.4M OP had been bought as of Oct 20, roughly $1M at $0.11, against about 2B OP still locked out of a 4.29B total. 🔹 Squeeze setup. Funding was negative (shorts paying longs) while open interest jumped about 27% right before the bounce. 🎯 What levels are important right now? $0.13 — strong resistance. $0.12 — nearest resistance, the Oct 31 spike high. $0.10 — important support. $0.09 — the next zone of interest for sellers in case of a breakdown. My trading logic: I will consider a LONG after a daily close above $0.12 and a successful retest, ideally with funding turning positive. SHORT becomes more interesting if the price loses $0.10 and cannot return above it. But there is one nuance: a 23% candle that fades within hours is a warning, not a breakout. Squeezes end fast. My conclusion: OP is worth attention right now not because of the pump, but because of what the proposal does to the buyback. I’m waiting for the price to confirm before risking capital. OP ripped 23% on a proposal that could shrink its own buyback. Real revival, or a short squeeze before the next leg down? 👇 #ByXIMPACT #WSOT2026 #BlockchainSecurity #PiecesOf8 #WSOTPicktoEarn10U $BTCUSDT $OPUSDT
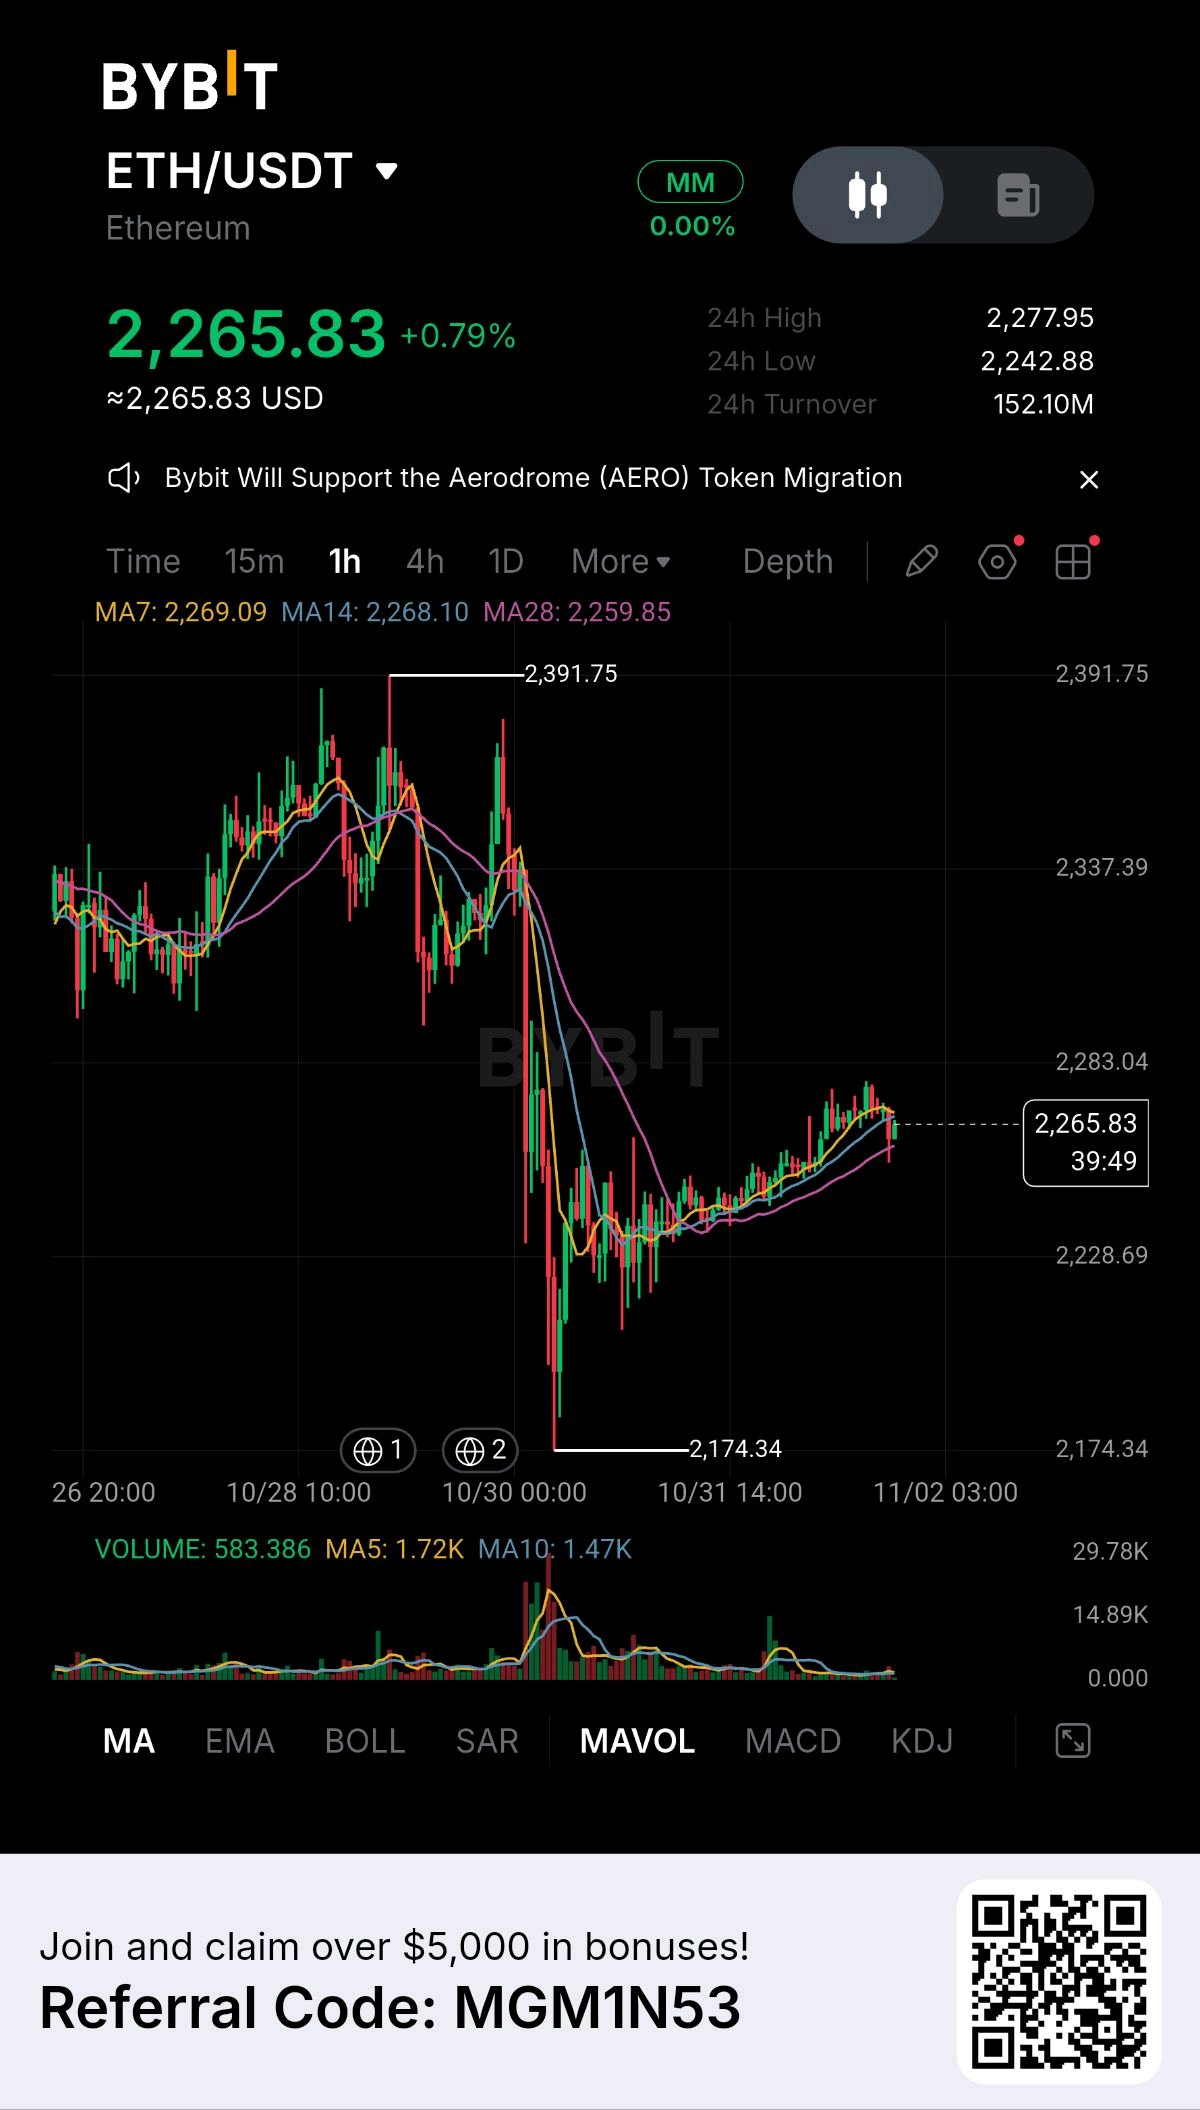
$ETHUSDT just printed one of the cleanest recoveries I’ve seen this week, and I still don’t trust it yet Let me be honest with you. When I see ETH nuke from 2,391.75 straight down to 2,174.34, I feel two things at once. One is excitement, because this is where the best entries come from. The other is fear, because this is exactly where people get wrecked. That was a 9% flush in a very short window. Stops got taken, leverage got cleared, and then the market did what it always does. It turned around and started climbing like nothing happened. Now ETH is sitting at 2,265.83. The 24h range is 2,242.88 to 2,277.95 on 152.10M turnover. We’ve already recovered about 42% of the entire drop. Most people look at that and think “V-shaped recovery, buy now.” I look at it and ask a different question: who is actually buying this? 📊 What the chart is telling me The MA7 is at 2,269.09, the MA14 at 2,268.10, and the MA28 at 2,259.85. They are packed within $9 of each other, and price is chopping right through them. That is not a trend. That is indecision. And the volume is the part nobody is talking about. The flush came with a massive volume spike. The bounce has come on a fraction of that. Price is recovering but conviction is fading. A recovery with no volume behind it is the kind that looks strong right until it isn’t. 📍 Levels I’m watching 2,283: the 50% retrace of the whole drop, sitting right above the 24h high at 2,277.95 2,308: the 61.8% retrace, the level that decides if this is a real reversal 2,259: MA28 and the 38.2% retrace, where bulls need to defend 2,242: the 24h low, my line in the sand 2,174: the flush low. If this comes back, everything above it was a trap 🎯 My plan I’m not chasing a green candle into resistance. That’s how you become exit liquidity. Entry: a pullback into the 2,257-2,260 zone, only if buyers defend it and it holds as support Stop: below 2,240, under the 24h low. If it breaks, I’m out with no arguing TP1: 2,283, about 1.3R TP2: 2,308, about 2.6R Risk: 1-2% of my capital, maximum That’s a trade where I risk about 19 points to make 24 to 49. I’ll take that all day. I won’t take a random entry at 2,265 where the stop is far and the reward is close. ⚠️ What would change my mind If ETH closes an hour candle below 2,242, the bounce is dead and the market is telling me the flush low gets retested. I will not hold a position hoping for a miracle. If ETH reclaims 2,283 with real volume behind it, then this stops being a relief bounce and starts looking like a shift in control. That is when I get interested in higher targets. Until one of those happens, I’m patient. The market doesn’t pay you for being early. It pays you for being right and staying alive. Everyone is chasing the bounce. I’m waiting for the setup. Which side are you on? 👀 #ByXIMPACT #WSOT2026 #BlockchainSecurity #IMPACTbyTrade #MidtermsMarketWatch $BTCUSDT $ETHUSDT
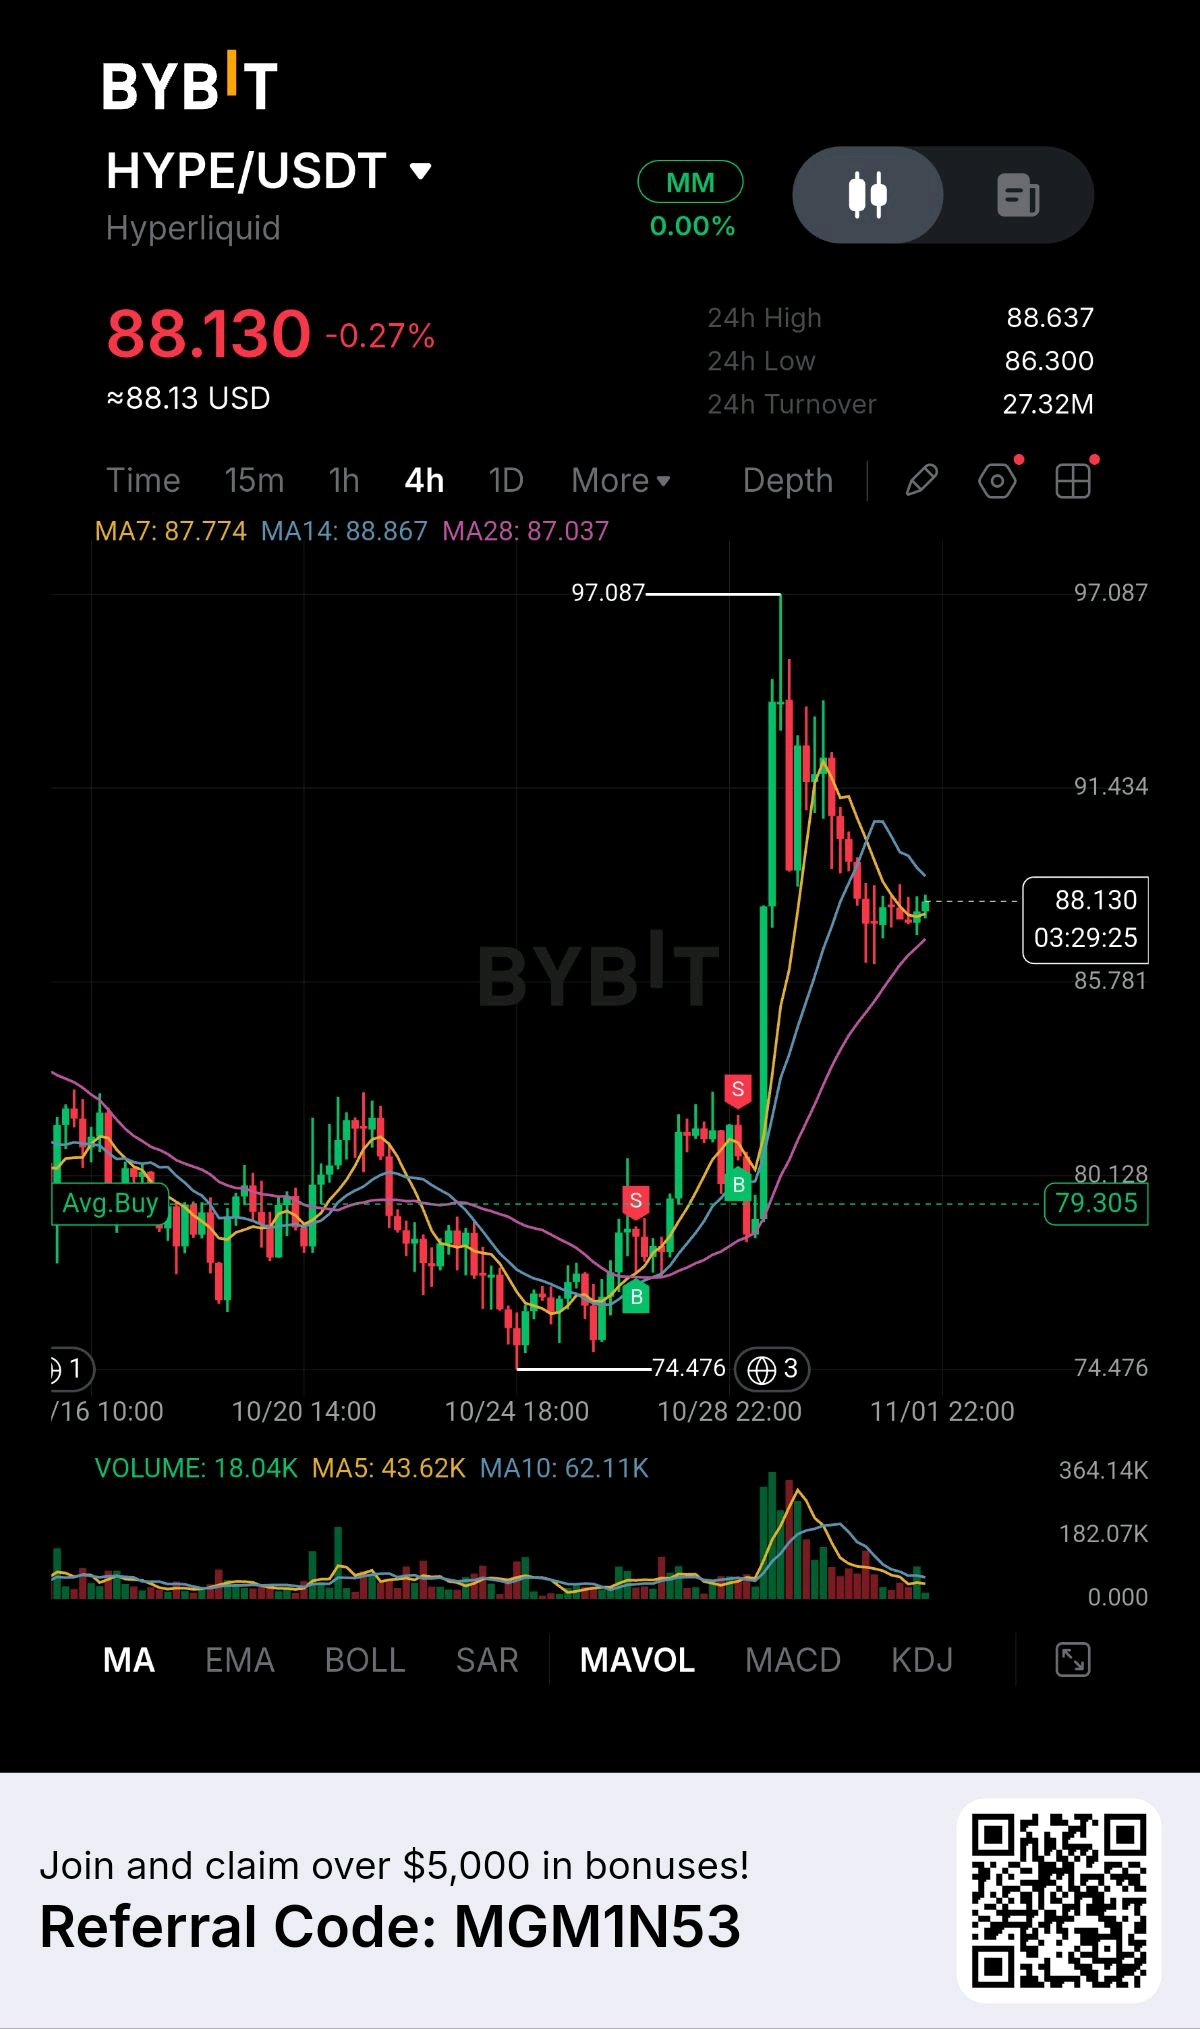
$HYPEUSDT is cooling off after one of the strongest breakouts on the board. Price is 88.130, down 0.27% today, after rocketing from the 74.476 low to a high of 97.087, about a 30% run. It has pulled back about 9% from that top and is now deciding whether the breakout holds. The reason behind the move is a regulated-access deal, not the market crash. On October 29, ICE (the NYSE’s owner) agreed to bring Trade[XYZ]’s Hyperliquid-based perpetual futures onshore in the U.S., subject to CFTC approval. Many people assumed money was fleeing the hacked exchange, but reports say most of the weekly gain came before the full scope of the hack was known, so the ICE news is the cause. The link back to the token is direct. Trading fees on Hyperliquid go into an assistance fund that buys HYPE on the open market, and any company running its own market must lock up 500,000 HYPE. More trading means more buying. Turnover The 24-hour turnover on this pair is 27.32M, in a tight range (86.300 to 88.637). That’s calm after the spike, so the market is digesting the move, not panicking out of it. Volume Volume peaked on the breakout candles (the chart’s volume scale reaches 364.14K) and has been fading since. The MA5 (43.62K) now sits below the MA10 (62.11K). That’s normal after a spike, but it means the buying has cooled. The current 4h candle is still open, so its own reading is incomplete. Moving Averages MA7: 87.774 | MA14: 88.867 | MA28: 87.037 Price (88.130) is above MA7 and MA28 but just under MA14, which is acting as a lid. MA28 is sloping up and sits right below price, which makes it the key line. MA7 has dropped under MA14, a short-term sign of a cooling trend, not a broken one. Levels to watch · 97.087 — The breakout high. · 88.867 — MA14, the first hurdle to reclaim. · 88.637 — The 24h high. · 88.130 — Where we are right now. · 87.774 — MA7. · 87.037 — MA28, the line that protects the breakout. · 86.300 — The 24h low. · 74.476 — The low before the run. Consideration The news is strong, but it isn’t finished. The ICE deal still needs CFTC approval, and there’s selling pressure too: two whale wallets sold about $108.81M in HYPE around October 31. For scale, that’s roughly four times this pair’s 24-hour turnover. So large holders are taking profit into a catalyst that hasn’t fully played out, and that’s why the chart is pulling back and not extending. Trade plan · The Bullish Path: We need a strong 4h close above 88.867 (MA14) and 88.637 to show buyers are back in control. If that holds, the next area to watch is 91 and then the 97.087 high. · The Bearish Path: If we lose MA28 (87.037) and the 86.300 low, it likely pulls back toward the low 80s where the breakout started. · My take: I’m staying patient. The catalyst is real, but whales are selling and volume is cooling. I want to see 87.0 hold and a confirmed 4h close above 88.9 before looking for a long. Support and resistance Support: 87.774 (MA7) → 87.037 (MA28) → 86.300 (24h low) Resistance: 88.867 (MA14) → 91 area → 97.087 (breakout high) Invalidation and risk note This setup is invalidated if we close a 4h candle below 86.300. The biggest risk is that the catalyst is already priced in: the news came before the pump, whales are selling into it, and regulatory approval can take time. Don’t guess the direction, wait for the break. #ByXIMPACT #WSOT2026 #BlockchainSecurity #IMPACTbyTrade #MidtermsMarketWatch $BTCUSDT $HYPEUSDT
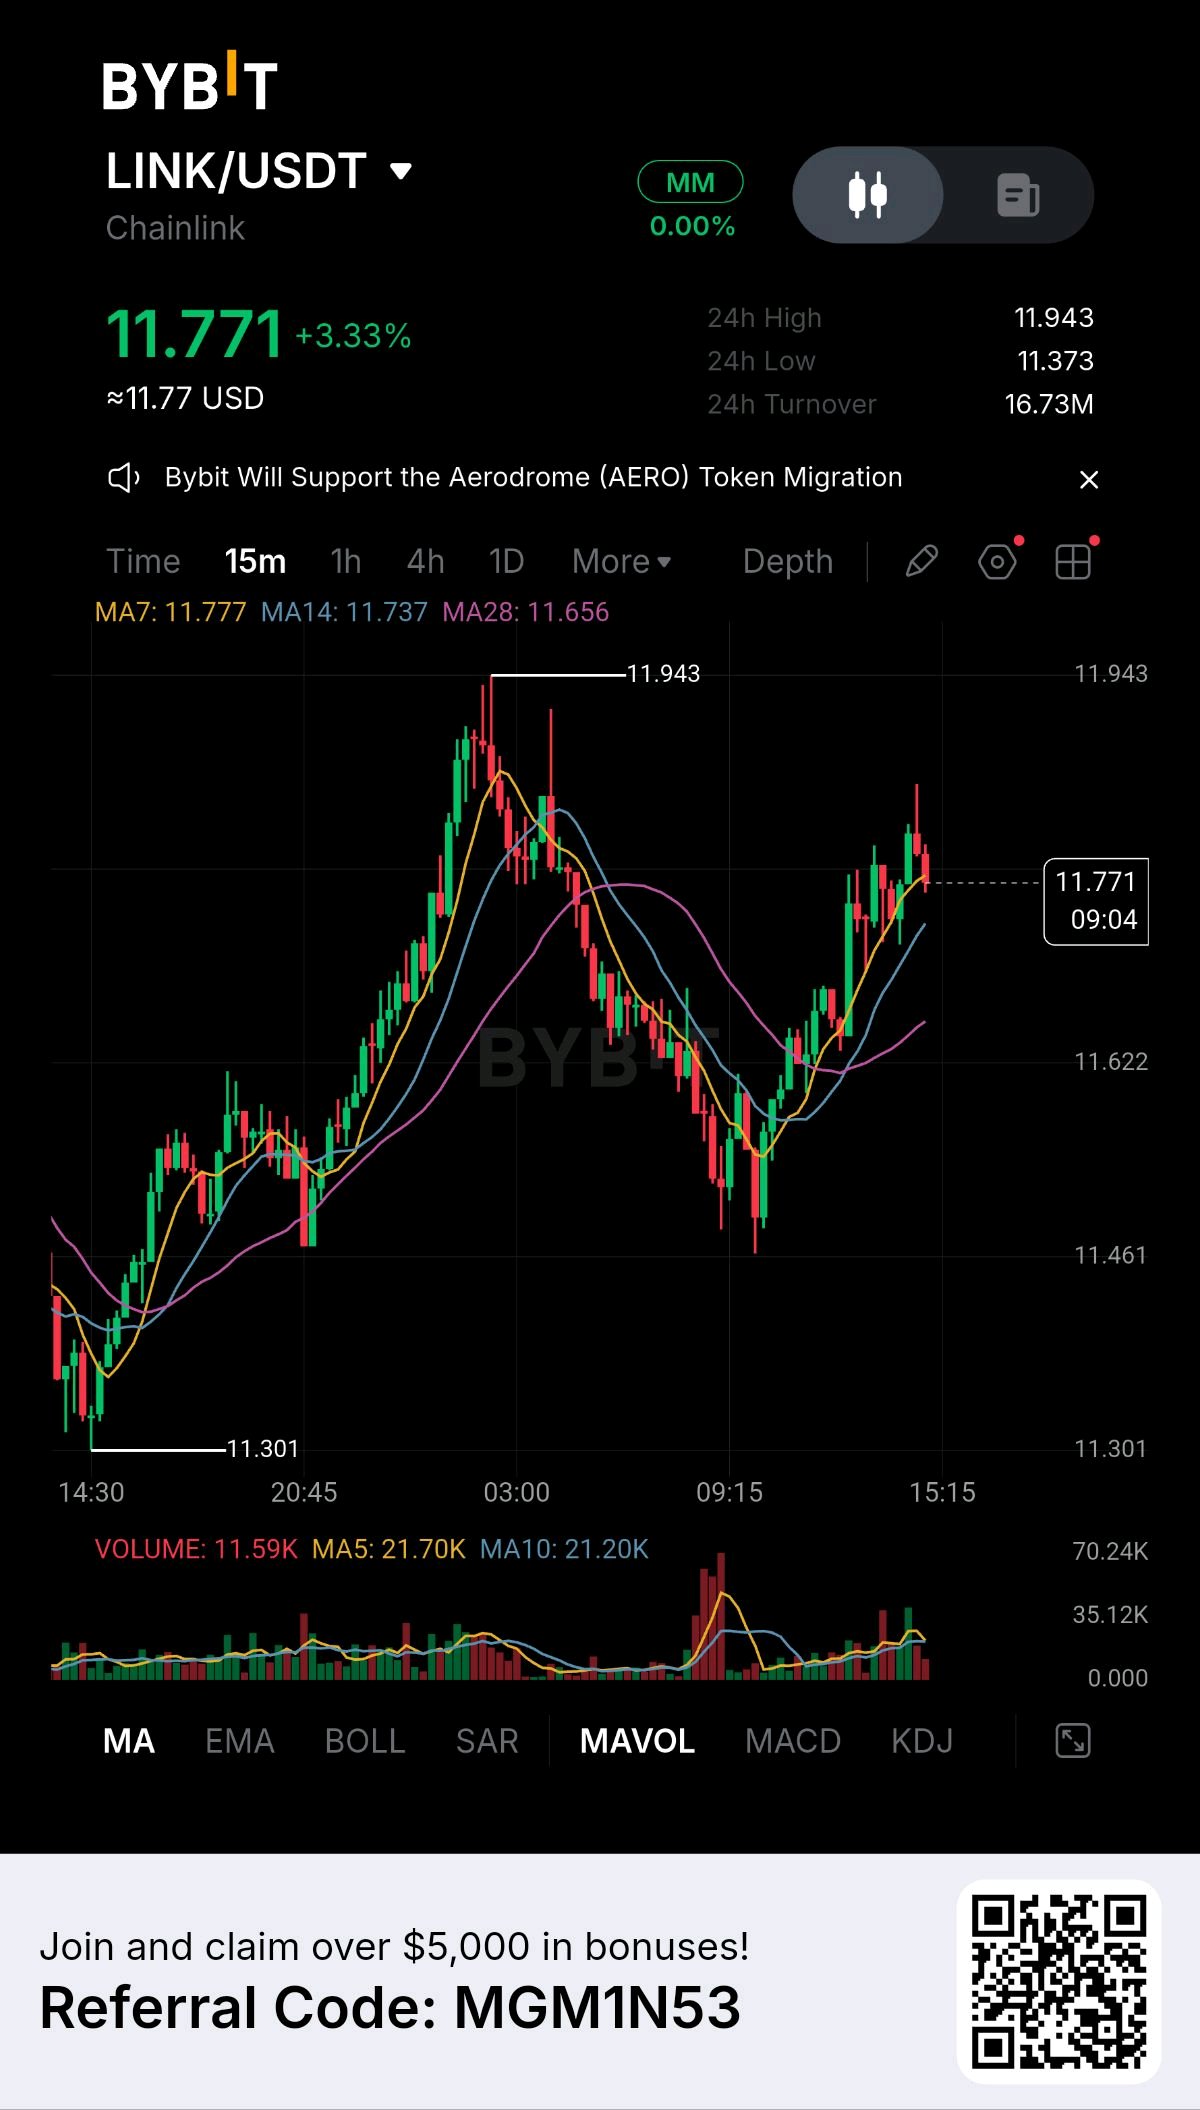
LINK: DTCC, S&P and Aave are all building on Chainlink. LINK is down about 21% this month. Someone is early or someone is wrong. I’ve been watching Chainlink this week and the news doesn’t match the chart. On Oct 29 the CEO of DTCC, the clearinghouse behind the U.S. stock market, stood on Chainlink’s stage and said it could free up billions in trapped liquidity. Chainlink launched 24/7 price feeds for stocks and commodities, and S&P Global Ratings vault risk data went onchain. LINK trades near $11.1. A year ago it was $21.32. That gap is the whole trade. Why LINK is on my screen The adoption is real. DTCC’s Collateral AppChain will run on Chainlink’s CCIP, and Aave’s institutional lending platform Horizon is using the new 24/7 feeds. The token’s cut isn’t clear. One analysis points out that no public fee structure has been set for LINK in the DTCC deal. When DTCC first announced in May, LINK opened the month at $9.10 and closed at $9.14. The price keeps falling anyway. LINK is down about 21% in October and about 27% over 30 days from an early-October high near $14.41. Supply: about 233M LINK are still unreleased, so each unlock raises the money needed to hold the price. Levels I’m watching $14.41: the early-October high $12.70: old support, now resistance $12.00 and $11.76: first resistance, the round number and the hourly 200 average $11.00 to $11.20: support to defend How I’d play it: LONG only after a daily close above $12.00 and a clean retest. No chasing. SHORT only if $11.00 breaks and price fails to climb back over it. In the middle, I stay out. Partnerships are headlines, and fee revenue is what pays the token. DTCC, SWIFT, S&P and Aave are all building on Chainlink, and LINK is half its price from a year ago. Is it the most underpriced infrastructure bet in crypto, or the best product in the market with no way for the token to capture it? #ByXIMPACT #WSOT2026 #IMPACTbyTrade #NewFinancialPlatform #MidtermsMarketWatch $BTCUSDT $LINKUSDT
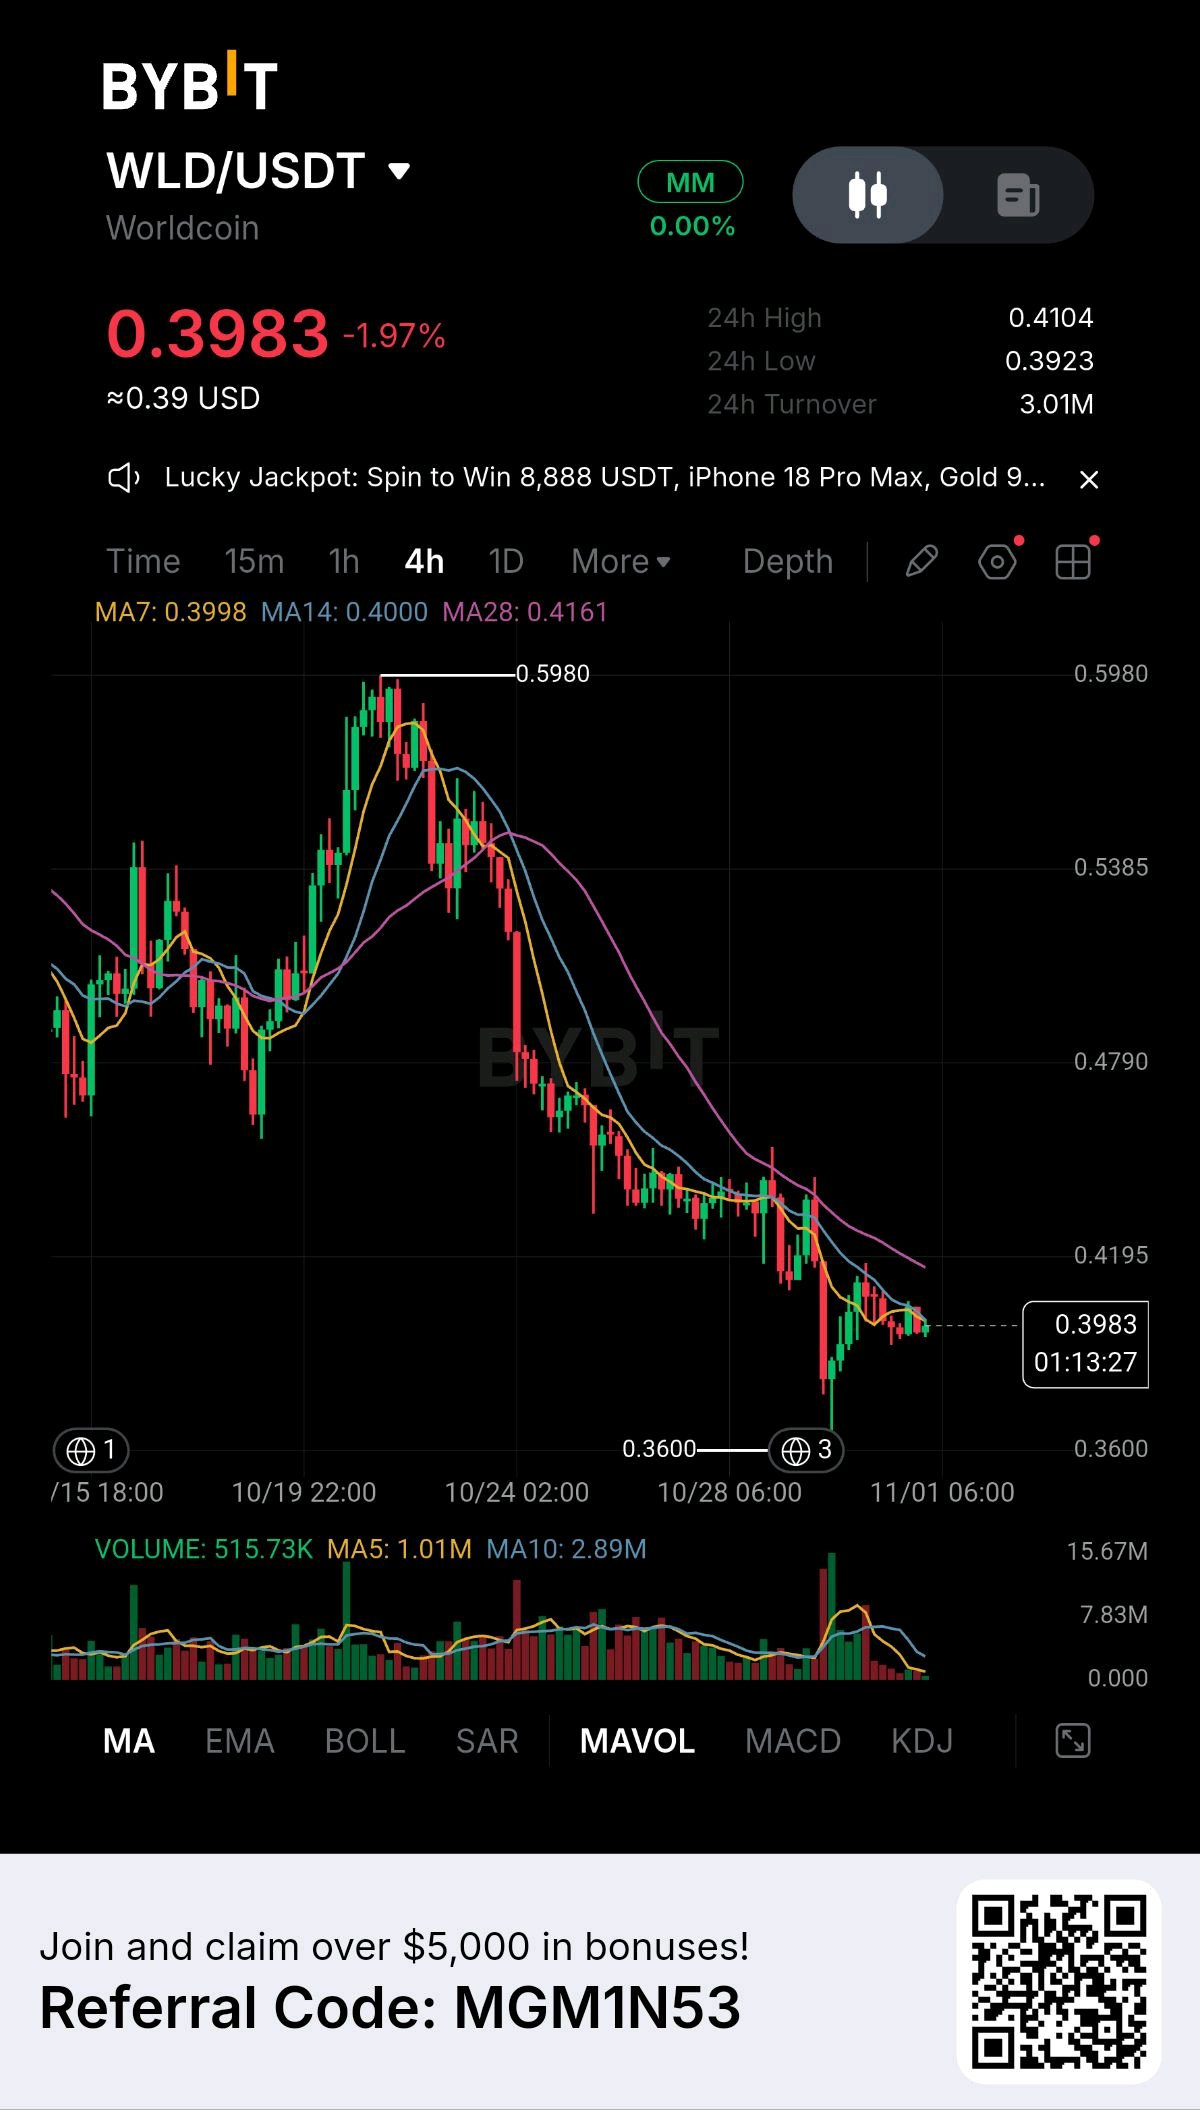
$WLDUSDT is trying to find its footing after getting hit twice in two weeks. Price is 0.3983, down 1.97% today. It fell from the 0.5980 high to a wick low of 0.3600, about a 40% drop, and has bounced about 10% from there. It’s still about 33% below the high. The first hit was insider-linked selling. A team-linked address moved out its entire 9.57M WLD after three years dormant and sent 6.5M to exchanges, while WLD was down about 26% on the week. The second hit came from the exchange hack. On-chain data shows the attacker sold 17.32M WLD for about $6.09M on Oct 29, as part of a swap of seven stolen altcoins into ETH. Now there’s a counter-force. The exchange says it is buying assets to match every stolen altcoin through OTC deals and exchange markets, to complete its proof of reserves. I couldn’t find a WLD-specific buyback figure, so the size of that bid is unknown. Turnover The 24-hour turnover is 3.01M on this pair, which is quiet. For scale, the stolen WLD that was dumped (about $6.09M) is small next to the roughly $161M that traded in 24 hours across markets. The dump hurt sentiment more than it moved the market. But this bounce has no heavy flow behind it yet. Volume The crash candle printed one of the biggest volume bars on the chart, which was panic and forced selling. Since then volume has dried up: the MA5 (1.01M) sits well under the MA10 (2.89M). The current 4h candle is still open, so its volume reading is incomplete. Buyers are testing, not committing. Moving Averages MA7: 0.3998 | MA14: 0.4000 | MA28: 0.4161 Price (0.3983) is sitting just under MA7 and MA14, which are stacked right on the 0.4000 round number. MA28 is about 4.5% overhead at 0.4161 and still sloping down. The trend is down until price reclaims the 0.4000 cluster. Levels to watch · 0.5980 — The high before the sell-off. · 0.4161 — MA28, the heavy overhead resistance. · 0.4104 — The 24h high. · 0.4000 — The MA7/MA14 cluster and a round number. · 0.3983 — Where we are right now. · 0.3923 — The 24h low and the level to hold. · 0.3600 — The crash low. Consideration This is a supply story with two sides. Heavy insider and attacker selling pushed price down, and a one-for-one buyback plus the proof-of-reserves report could pull it back up. The exchange’s reserves report is due in the coming days, and it will show whether the stolen tokens were replaced. Until that lands, the chart is stuck below its moving averages. Trade plan · The Bullish Path: We need a strong 4h close above 0.4104 and a reclaim of 0.4000 to show buyers are in control. If that holds, the next stop is MA28 at 0.4161. · The Bearish Path: If we lose 0.3923, it likely retests the 0.3600 crash low. · My take: I’m staying patient. The news could turn supportive, but volume is thin and the MAs are still falling. I want to see 0.3923 hold and a confirmed 4h close above 0.4104 before looking for a long. Support and resistance Support: 0.3923 (24h low) → 0.3600 (crash low) Resistance: 0.4000 (MA7/MA14) → 0.4104 (24h high) → 0.4161 (MA28) Invalidation and risk note This setup is invalidated if we close a 4h candle below 0.3923. The biggest risk is a dead-cat bounce: price drifts up on thin volume, then drops again if insider or attacker selling returns or the reserves report disappoints. Don’t guess the direction, wait for the break. #ByXIMPACT #IMPACTbyTrade $WLDUSDT $BTCUSDT
ARB: a 30-day activity high and a council with freeze powers. I traded both ideas in one entry. Two stories, one position. When it stopped out, I couldn’t tell which one was wrong. My Play 📊 TRADE : LONG ARB/USDT Entry: $0.16476 (market) Stop loss: $0.16377 (filled at $0.16377) Leverage: 25x P&L: −0.05 USDT (price move −0.60%, ROI about −15%) 🤔 Why I took it On Oct 28, Arbitrum One hit about 1.09M daily active addresses, a 30-day high and up about 90% on the week, and Pump.fun announced an Arbitrum integration. But ARB was around $0.162, down about 20% over 30 days and under its 50-day EMA at $0.1739. Binance open interest rose about 16% in a day while price barely moved, though that’s one venue, with total OI near $230M. The second story was governance. In April, Arbitrum’s Security Council froze 30,766 ETH (about $71M) tied to the KelpDAO exploit, with 9 of 12 members voting yes, and the funds can only move through further governance action. The market’s reaction was split: one April summary had ARB up about 3% in 36 hours, while critics questioned whether a 12-person council fits a decentralized network. My notes say the council froze more funds after the Binance exploit, which put the same question back on the table. I’m not saying either story is priced wrong. What interested me was a narrower question: does the token get paid for record activity and for a council that can act, or does price stay under the EMA regardless? 🔐 Key levels 🔹 Pivot: $0.16, then $0.15 below 🔹 50-day EMA: $0.1739 🔹 My entry: $0.16476 🔹 My stop: $0.16377 ⚠️ Risk At 25x, a 0.60% move against me costs about 15% of margin, so even a tight stop is a large hit on the position. Active addresses aren’t token demand. A chain can double its users without anyone needing to buy ARB. Freeze powers cut both ways. They can read as protection or as centralization, and the April reaction showed both. Bitcoin was weak and Fear & Greed was around 30, so a good story could still get sold with everything else. 📝 My View I put two different ideas into one trade: activity leading price, and the market valuing the council’s power. When the stop hit, I couldn’t say which one failed, or whether either did. A stop-out only tells me the entry was wrong. It doesn’t grade the thesis, and two theses in one position can’t be graded at all. The dollar loss was small, 0.0488 USDT on 49.3 ARB, but at 25x it cost about 15% of the margin I put up. High leverage turns an untestable idea into an expensive one. Next time it’s one trade, one question, and lower leverage until the question is clear. If I want to know whether the market pays for the freeze power, I trade that and nothing else. #ByXIMPACT $ARBUSDT #WSOT2026 #PiecesOf8 #BlockchainSecurity #IMPACTbyTrade $SOLUSDT
BITCOIN (BTC): ETF demand looks healthy on the surface. But one fund is doing almost all the work. Headlines about Bitcoin ETFs usually talk about “institutions” as if they were one crowd. The flow data tells a narrower story. The news US spot Bitcoin ETFs held $103.94 billion in net assets on October 27, about 6.4% of Bitcoin’s market value. Since August 1, BlackRock’s IBIT has taken in roughly $5.7 billion net, while every other US spot Bitcoin ETF combined took in about $221 million. That puts about 96% of net inflows in a single fund. October follows the same pattern. IBIT averaged $48.1 million of daily inflows, while rival funds lost an average of $59.4 million a day. Market reality Bitcoin traded near $81,385 on October 28, down about 3.3% over the past month. The Federal Reserve held rates at 3.75% to 4.00% with two members voting for a hike, and markets are pricing in roughly 79 basis points of hikes over the next year. That is a tough backdrop for assets that pay no yield. I ran a simple check on October 19. IBIT took in $665 million that day, while the whole category took in $527 million. So the other funds together lost about $139 million on a day that looked like strong ETF demand. Key levels $81,500: the average cost basis of US spot Bitcoin ETF holders. Bitcoin was $115 below it on October 28. A daily close above it puts them back in profit. $84,000 to $84,600: the top of the two-week range, where the October 21 breakout ran out of room. Bull case The biggest buyer keeps buying. IBIT holds $65.52 billion in net assets and keeps taking in money on days when other funds see redemptions. On October 26 and 27, Bitcoin ETFs took in $286.3 million while Ether ETFs lost $148.8 million and Solana ETFs lost $27.4 million. Institutional money is not leaving crypto. It is concentrating in Bitcoin. Risks However, concentration cuts both ways. If IBIT’s buyers slow down, there is no second source of demand behind them. The number I keep coming back to is $221 million: that is all the rest of the category has attracted in three months. Meanwhile, a Fed that refuses to ease keeps pressure on every non-yielding asset, Bitcoin included. Bottom line The Bitcoin ETF bid is real, but it is narrow. I would watch whether the other funds stop bleeding, whether Bitcoin closes above $81,500, and how IBIT’s daily flow reacts to the Fed’s hold. If one fund is the bid, what happens on the day it stops? #ByXIMPACT #BitcoinSlidesBelow$80K #NewFinancialPlatform #MidtermsMarketWatch #IMPACTbyTrade$HYPEUSDT $BTCUSDT