Mirha Inaya

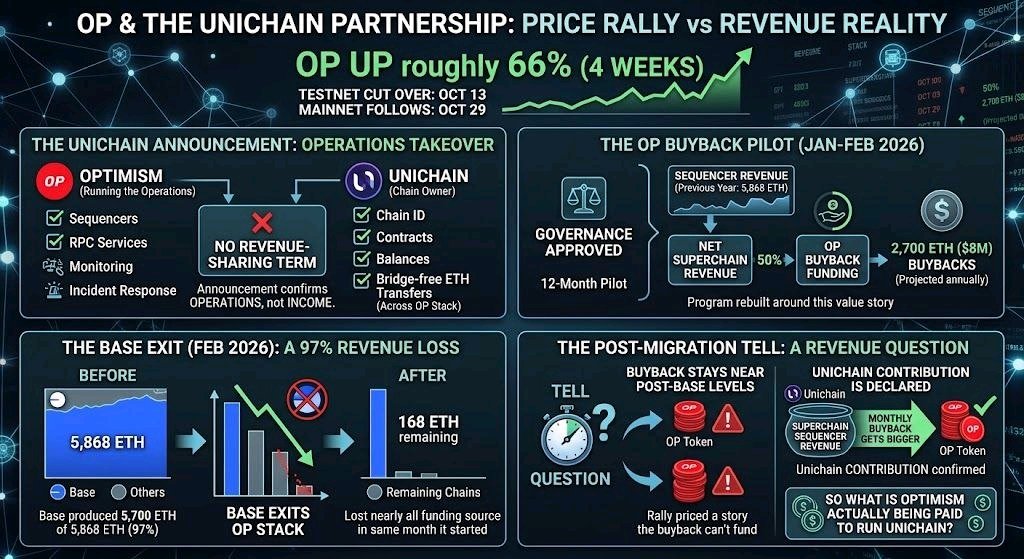
OP is up roughly 66% in four weeks, and almost all of it traces back to one announcement: Unichain is handing its production operations to Optimism. The testnet cut over on October 13. Mainnet follows tomorrow, October 29. The price reacted as if the deal pays OP holders, so I went looking for where it does. Here’s what the announcement actually covers. Optimism takes over the sequencers, the RPC services, monitoring and incident response. Unichain keeps its chain ID, contracts and balances, and gets set up for bridge-free ETH transfers across OP Stack chains. What it doesn’t include is any revenue-sharing term or projected income. Even the coverage that cheered the rally says so outright. That gap matters because of how OP gets paid. In January, governance approved a 12-month pilot that sends 50% of net Superchain sequencer revenue into monthly OP buybacks, starting in February. It was sized on about 5,868 ETH of sequencer revenue the year before, which works out to roughly 2,700 ETH, or about $8M, going into buybacks. Then Base left. Coinbase moved Base off the OP Stack onto its own unified stack in February and stopped sharing revenue with the Optimism Collective. Base had produced roughly 5,700 of those 5,868 ETH. The program the token’s value story was rebuilt around lost nearly all of its funding source in the same month it started. Unichain is a real win, and I’d say that plainly. Unichain already had an OP Enterprise relationship, so this moves Optimism from supporting a chain to being responsible for running it. That’s a bigger job, and it shows OP Enterprise can sell operations and not just software. But running a chain and earning from it are two different lines. The announcement confirms the first. The buyback needs the second. Tomorrow’s cutover is the easy part. The tell comes after it: whether Optimism or Uniswap ever says what Unichain contributes to Superchain sequencer revenue, and whether the monthly buyback gets bigger once the migration is live. If it stays near post-Base levels, the rally priced a story the buyback can’t fund. So what is Optimism actually being paid to run Unichain? #IMPACTbyTrade #ByXIMPACT $OPUSDT
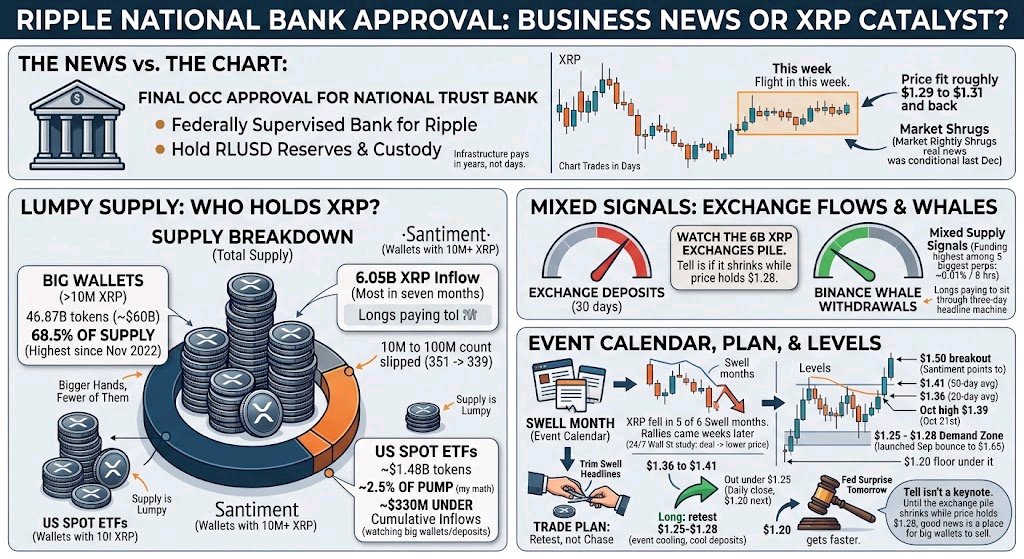
Ripple got the thing it has waited about ten months for this week, final OCC approval for its national trust bank, and XRP did nothing. $1.29 to $1.31 and back. Swell opened today. I think the market is right to shrug. The real news was the conditional approval last December. Final approval gives Ripple a federally supervised bank to hold RLUSD reserves and sell custody. That’s a business for Ripple, not a reason to buy XRP. Infrastructure pays in years, and this chart trades in days. The better question is who’s actually holding the supply. Wallets with 10M+ XRP hold 46.87B tokens, about 68.5% of supply and the highest since November 2022, per Santiment. At $1.29 that’s roughly $60B. The US spot ETFs, the flow everyone watches, hold about $1.48B, roughly 2.5% of that pile (my math), and they sit about $330M under their cumulative inflows. So I’m watching the big wallets and exchange deposits, not the ETF tape. Those signals are mixed. Exchanges took in 6.05B XRP over 30 days, the most in seven months. Binance whale withdrawals hit a five-year low. The 10M to 100M wallet count slipped from 351 to 339. Bigger hands, fewer of them, which makes supply lumpy. The event calendar isn’t friendly either. XRP fell in five of the last six Swell months, and the two big rallies came weeks later. 24/7 Wall St counted every Ripple deal this year as followed by a lower price. Funding was the highest among the five biggest perps in this morning’s snapshot, at 0.01% per 8 hours, so longs are paying to sit through a three-day headline machine. Levels: $1.25 to $1.28 is the demand zone that launched September’s bounce to $1.65, and $1.20 is the floor under it. Above, $1.36 is the 20-day average, $1.41 is the 50-day, and $1.50 is the breakout Santiment points to. The October high was $1.39 on the 21st. Plan: I’m not buying Swell headlines into $1.36 to $1.41. That’s where I’d trim, not add. The long I want is a retest of $1.25 to $1.28 after the event with exchange deposits cooling. A daily close under $1.25 and I’m out, with $1.20 next, and a Fed surprise tomorrow gets there faster. The tell isn’t a keynote. It’s whether that 6B XRP pile on exchanges starts shrinking while price holds $1.28. Until it does, good news is just a place for the big wallets to sell into. #ByXIMPACT $XRPUSDT
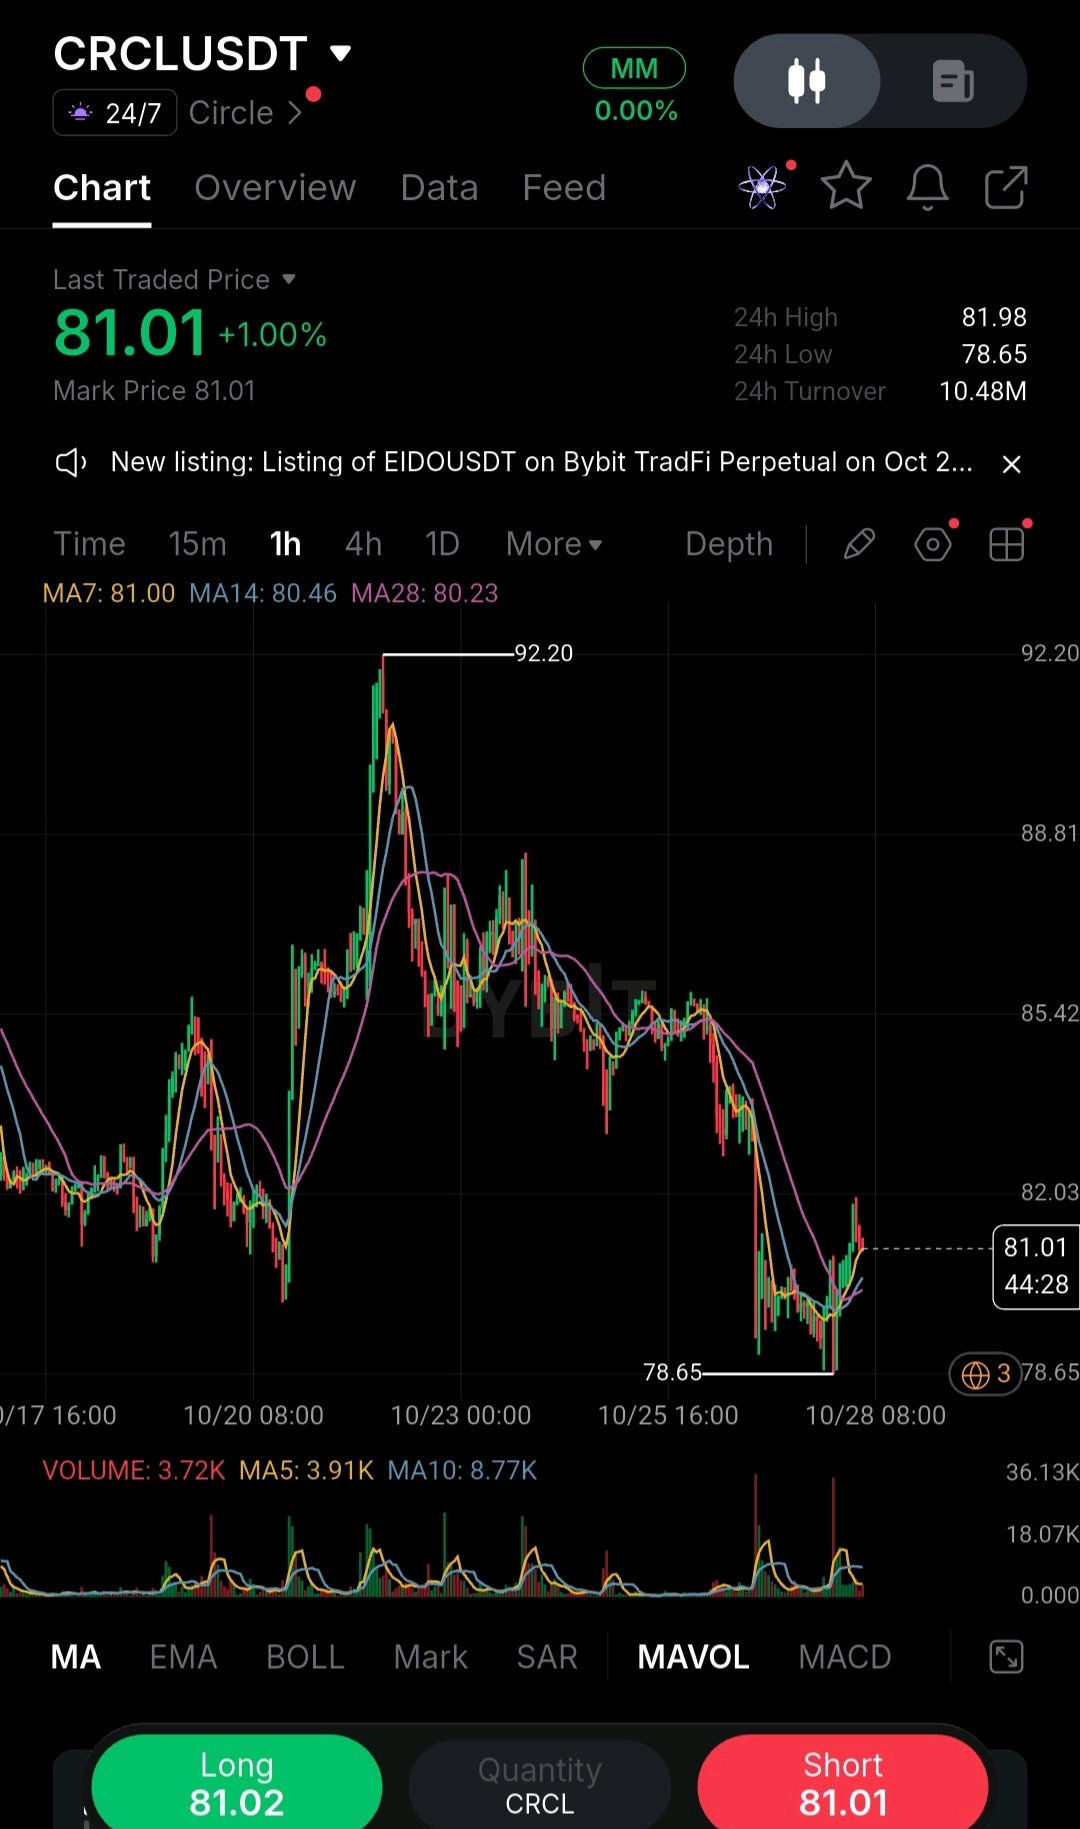
CRCLUSDT has bounced from 78.65 to 81.01 and is sitting right on its 1H moving averages, seven days before Circle reports. What caught my attention isn’t the bounce. It’s the arithmetic behind the number the market is waiting for. Circle reports Q3 on Wednesday, Nov 4. Reserve income was $668M of Q2’s $701M revenue, about 95%, so revenue is mostly two inputs: how much USDC is outstanding and what the reserves earn. In Q2, average USDC grew 25% year over year, but revenue grew only 7%, because the reserve return rate fell 66 bps. The supply side has been soft. USDC ended Q2 at $73.3B, down from $77.0B at the end of Q1. On Circle’s reserve data it was about $73.0B on Oct 8, after a week where redemptions beat issuance. Q2’s average balance was $76.5B. Trackers put Q3 revenue consensus around $785–797M, roughly 12–14% above Q2. With the balance not growing, that needs a higher return rate or a jump in non-reserve revenue. I can’t tell from public data which one analysts are modelling, and Circle missed revenue estimates in both Q2 and Q1. Key figures (1H) 81.01 — price (+1.00%) 78.65 — 24H low, the floor 81.98 — 24H high, the ceiling 92.20 — swing high (price is ~12% below it) 80.23–81.00 — MA28 to MA7, all bunched under price 10.48M — 24H turnover The read: price is boxed between 78.65 and 81.98, about 4% wide, and the MAs sit within 0.8 of price. Both edges have a trade. The middle doesn’t. Reclaim long: a 1H close above 81.98 that holds on a retest. Entry: 82.10 | SL: 80.90 | TP1: 84.50 | TP2: 86.00 R:R is about 2:1 to TP1 and 3.3:1 to TP2. The 84–86 area is where price chopped before the last leg down. Rejection short: a wick into 81.9–82.4 that closes back under 81.00. Entry: 82.00 | SL: 82.90 | TP1: 80.20 | TP2: 78.80 R:R is about 2:1 and 3.6:1. What changes my mind: a 1H close under 78.65 means the base has failed. I see no marked support below it on this chart. Keep in mind that today’s Fed decision feeds the reserve return rate directly, and the report lands Nov 4. Size from the stop, and decide before then whether you hold through the print. For me, the real test isn’t whether CRCL holds 81. It’s whether USDC supply starts growing again. Circle’s weekly issued-versus-redeemed data will show it before the print does. Until it turns up, I’m treating this bounce as a pre-earnings range trade, not a base. If Nov 4 shows balance growth outrunning the return-rate drag, the arithmetic changes, and so does my view. $CRCLXUSDT #ByXIMPACT

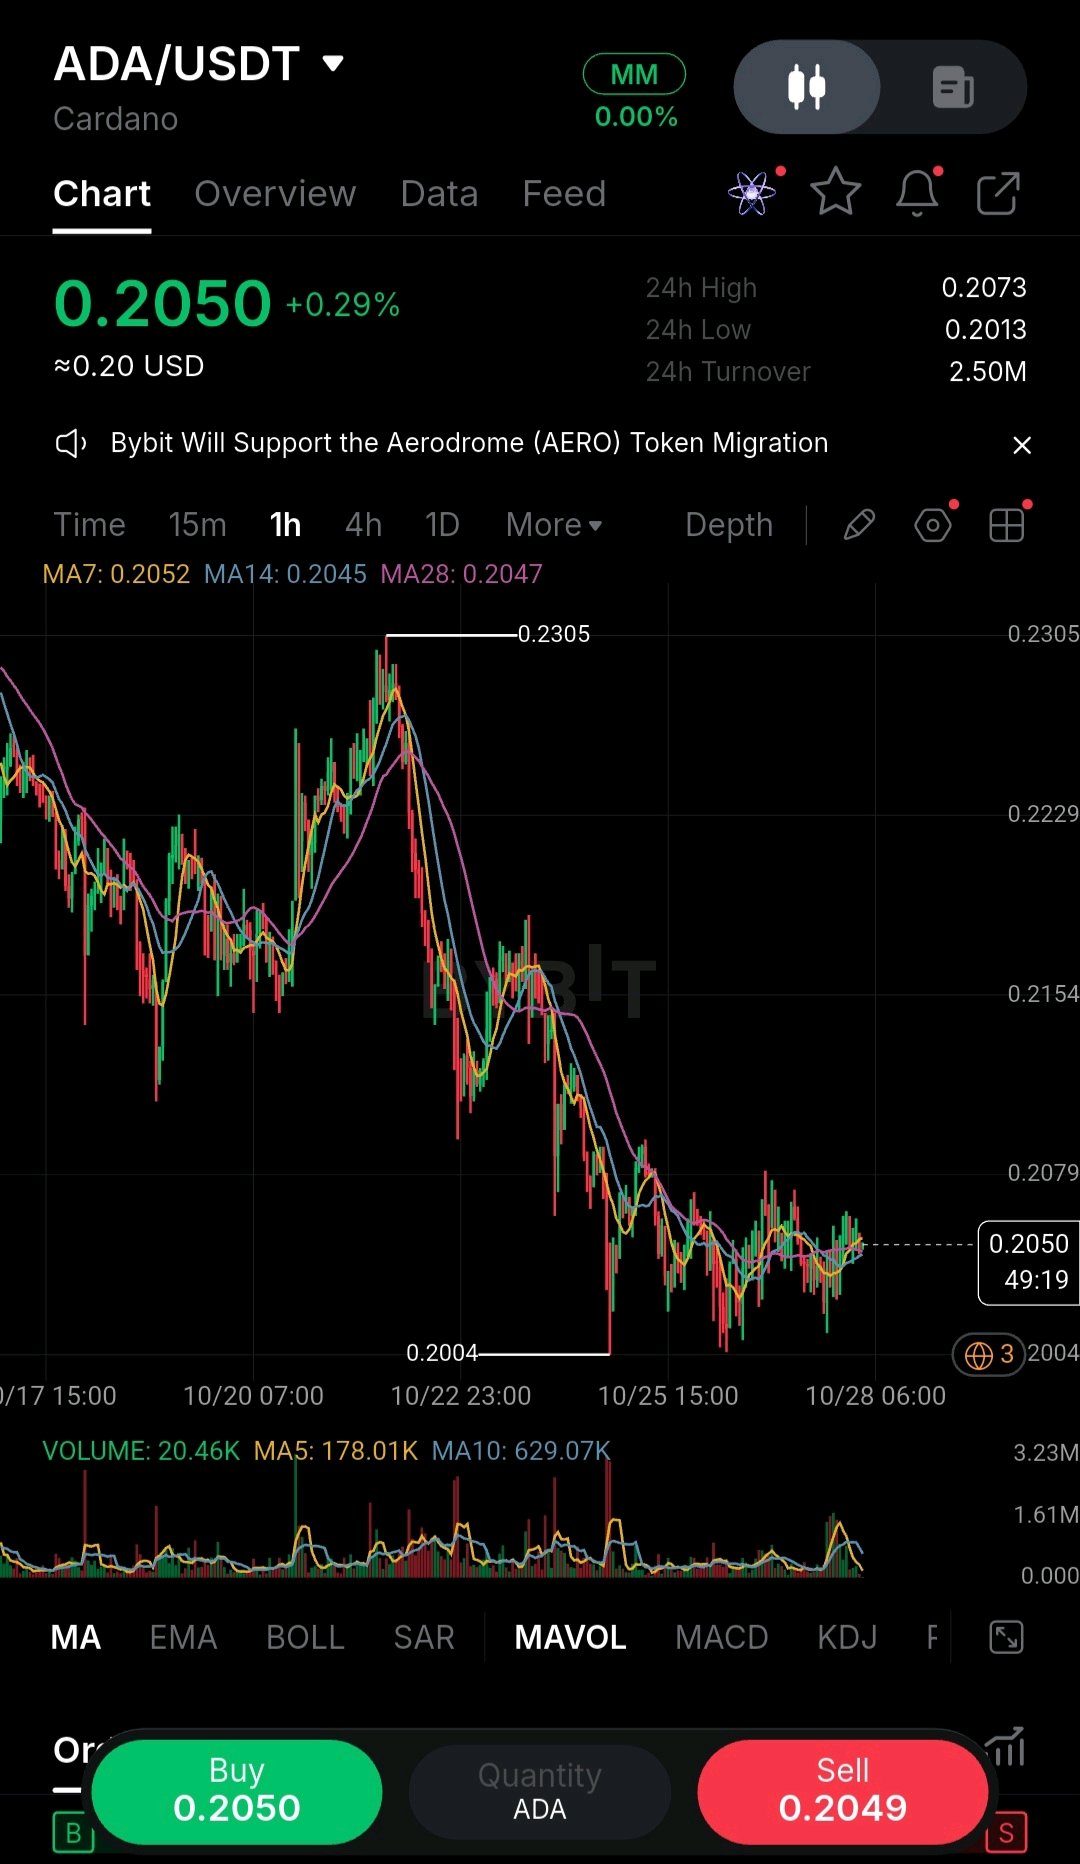
ADA fell about 13% from 0.2305 to the 0.2004 low, and since then it hasn’t done much of anything. That’s what interests me, because a market that stops falling and doesn’t bounce is usually deciding. On the 1H chart, price is 0.2050 and the 24h range is only 0.2013–0.2073. MA7 (0.2052), MA14 (0.2045) and MA28 (0.2047) are all flat and tangled, with price sitting on top of them. Turnover is 2.50M, and recent volume is thin: the 5-candle average is about 28% of the 10-candle one. Sellers have gone quiet, but buyers haven’t stepped up yet. In a range like this, I want to trade the edges and not the middle. The floor is 0.2013, the ceiling is 0.2073, and 0.2050 is the worst place to be doing anything. Key figures 0.2050: price 0.2013–0.2073: 24H range 2.50M: 24H turnover 0.2004: swing low 0.2305: swing high before the drop For a long, I’m looking at 0.2015–0.2030 with a stop at 0.1995, just under the swing low. From a 0.2022 entry I’d risk about 0.0027. The first target is 0.2073, which is only about 1.9:1. The real trade is a break through 0.2073 toward 0.2154, where the earlier bounce rolled over. That’s about 4.9:1, but it needs a breakout, so I won’t size the trade as if I already have it. If price runs into 0.2073 and rejects it hard, I’d flip bias and look at a short back toward 0.2013, with a stop above 0.2085. That’s about 2.6:1. What would change my mind is a 1H close above 0.2073 that holds on a retest. That makes this a breakout, not a range. A close under 0.2004 that can’t reclaim it means the downtrend is still in control, and I’m not buying. I’m ignoring any ETF headlines here. They’ve moved around too much to trust, and the chart is what I can measure. For me, the middle of a range is where traders get chopped. I’d rather wait for an edge, even if it means missing a few ticks. Is 0.2013 the floor you trust, or does this range need one more sweep of the low first? #ByXIMPACT $ADAUSDT
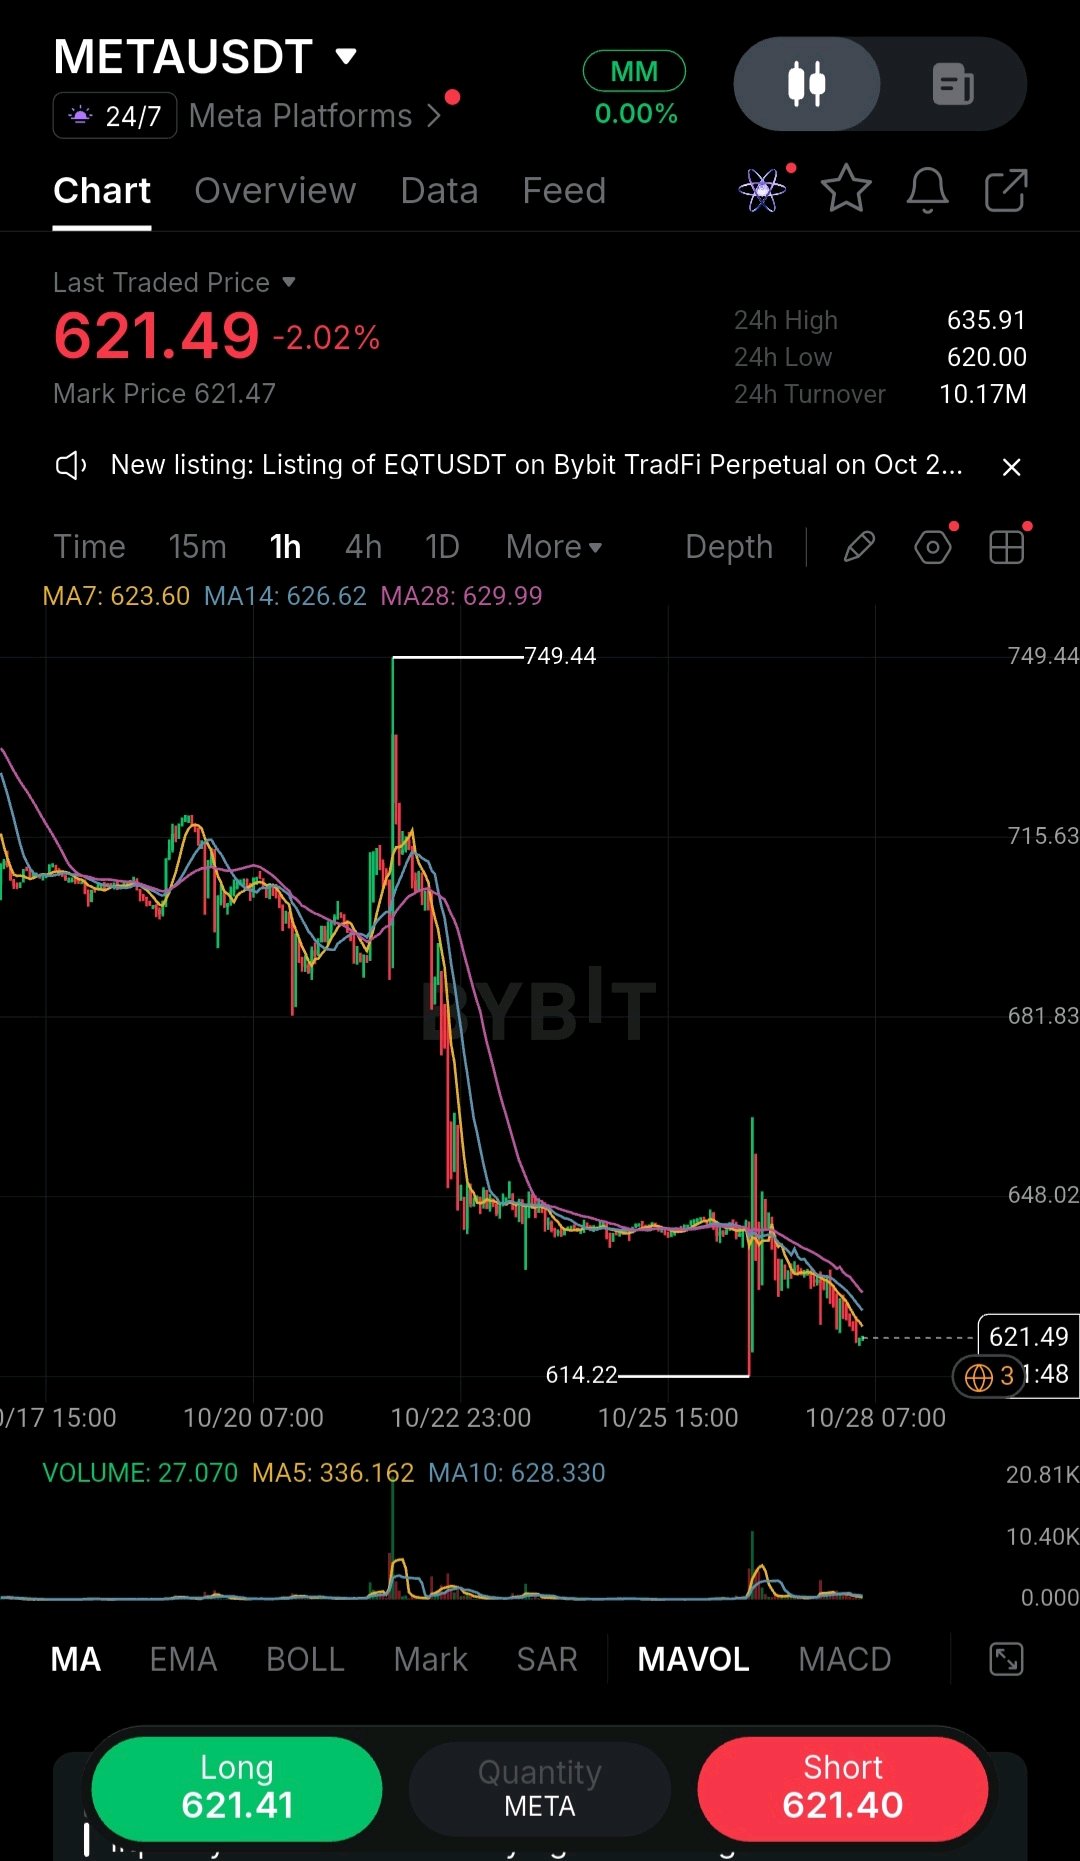
META beat on earnings, popped 6% after hours, then closed down 7% the next day. It’s the third time this year. I’m not trying to catch this one. What caught my attention isn’t the red candle, it’s the stock sale. Meta priced $25B of shares at $625 on Tuesday, and the perp is at 621, below what those buyers just paid. The shares hit the market now, but Meta doesn’t see the cash until it settles the forward, which can be as late as November 2027. Add the $12.5B preferred and a $60B at-the-market program planned for later, and that’s roughly 6% of the company in new equity. The reason behind it is real. Capex is heading to $135–145B this year, about double last year, and Q3 spending already ran past operating cash flow. Nvidia and AMD put $4B into the deal, so the chip suppliers are helping fund their own customer. That may be why chip names like MRVL are bouncing while META isn’t. On the chart, price is under MA7, MA14 and MA28, all pointing down, and the 648 base from Oct 22 is gone. The $625 deal price sits right on the MA cluster, so that’s where I’d expect sellers. Key figures 621.49 — Price 625 — Deal price 626.6 / 630 — MA14 / MA28 614.22 — Swing low 636.50 — Where my read is wrong If I take it, it’s only a short on rejection at 625–630, with a stop at 636.50. TP1 is 614.50 and TP2 is 600, about 1.6R to the first target from 628. I’d take a partial at TP1. What changes my mind: a 1H close above 636.50, or a reclaim of 648. META did bounce hard after the July drop (+44% by late September), so I’m not going to fight real buyers. It just took eight weeks last time, not eight hours. If 614.22 breaks, I won’t chase it. I’d wait for the lower-high retest. Size from the stop, not leverage: 8.5 points on a 24/7 perp at 20x is about 27% of margin. Fade the bounce at $625, or buy the dip like July? #ByXIMPACT $METAXUSDT
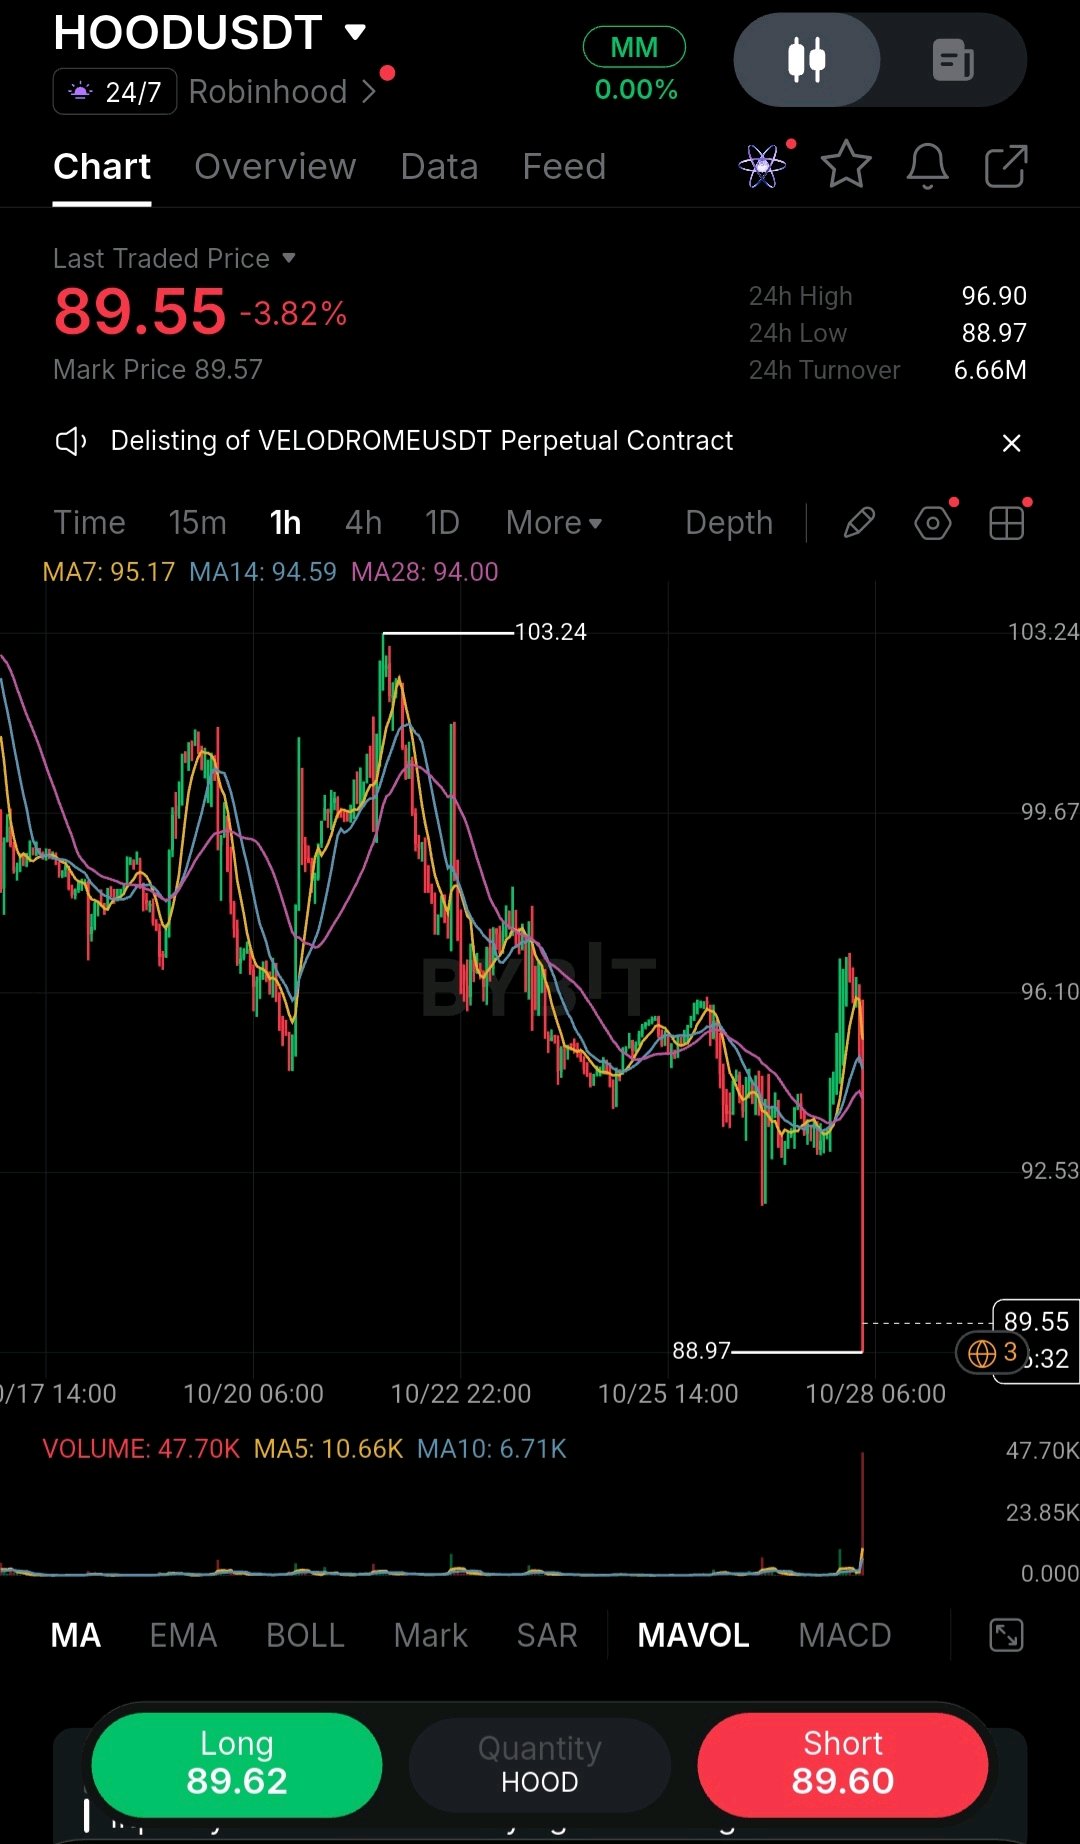
HOOD is trading like it missed, and I’m watching whether $93 gets taken back before the US open. What stands out is the gap between the headline and the business. Revenue was a record $1.42B, up 12%, but EPS came in at $0.51 against about $0.55 expected, and the perp is sitting near $89.55, roughly 5% under Tuesday’s close. The business underneath still looks healthy to me. Options revenue was up 31%, event contracts grew more than sixfold to $173M, and crypto was the weak spot, down 55%. About 7 cents of the miss was a paper loss on an investment fund, not trading. But the market sells the headline first. Last quarter HOOD beat EPS by about 48% and still dropped 6.6%. Levels I’m watching $89.55 — HOOD perp now $94.56 — Tuesday close $88.97 — 24H low, the lowest print on the 1H chart $93.14 — 200-day average 47.70K — last candle volume vs a 10.66K average If buyers reclaim $93 to $95 and hold it on a retest, I read the drop as an overreaction. If it fails there and loses $88.97, there’s no support left on this chart. It turns into price discovery, with the Fed decision landing the same day. I could be wrong on timing. This is a perp trading overnight on thin liquidity, and a strong call can erase an after-hours move before the open. For me the test is how it behaves around $93 once the cash market opens, not the print itself. Is this a dip-buy on record revenue, or a stock that keeps getting marked down on every miss? #ByXIMPACT $HOODXUSDT

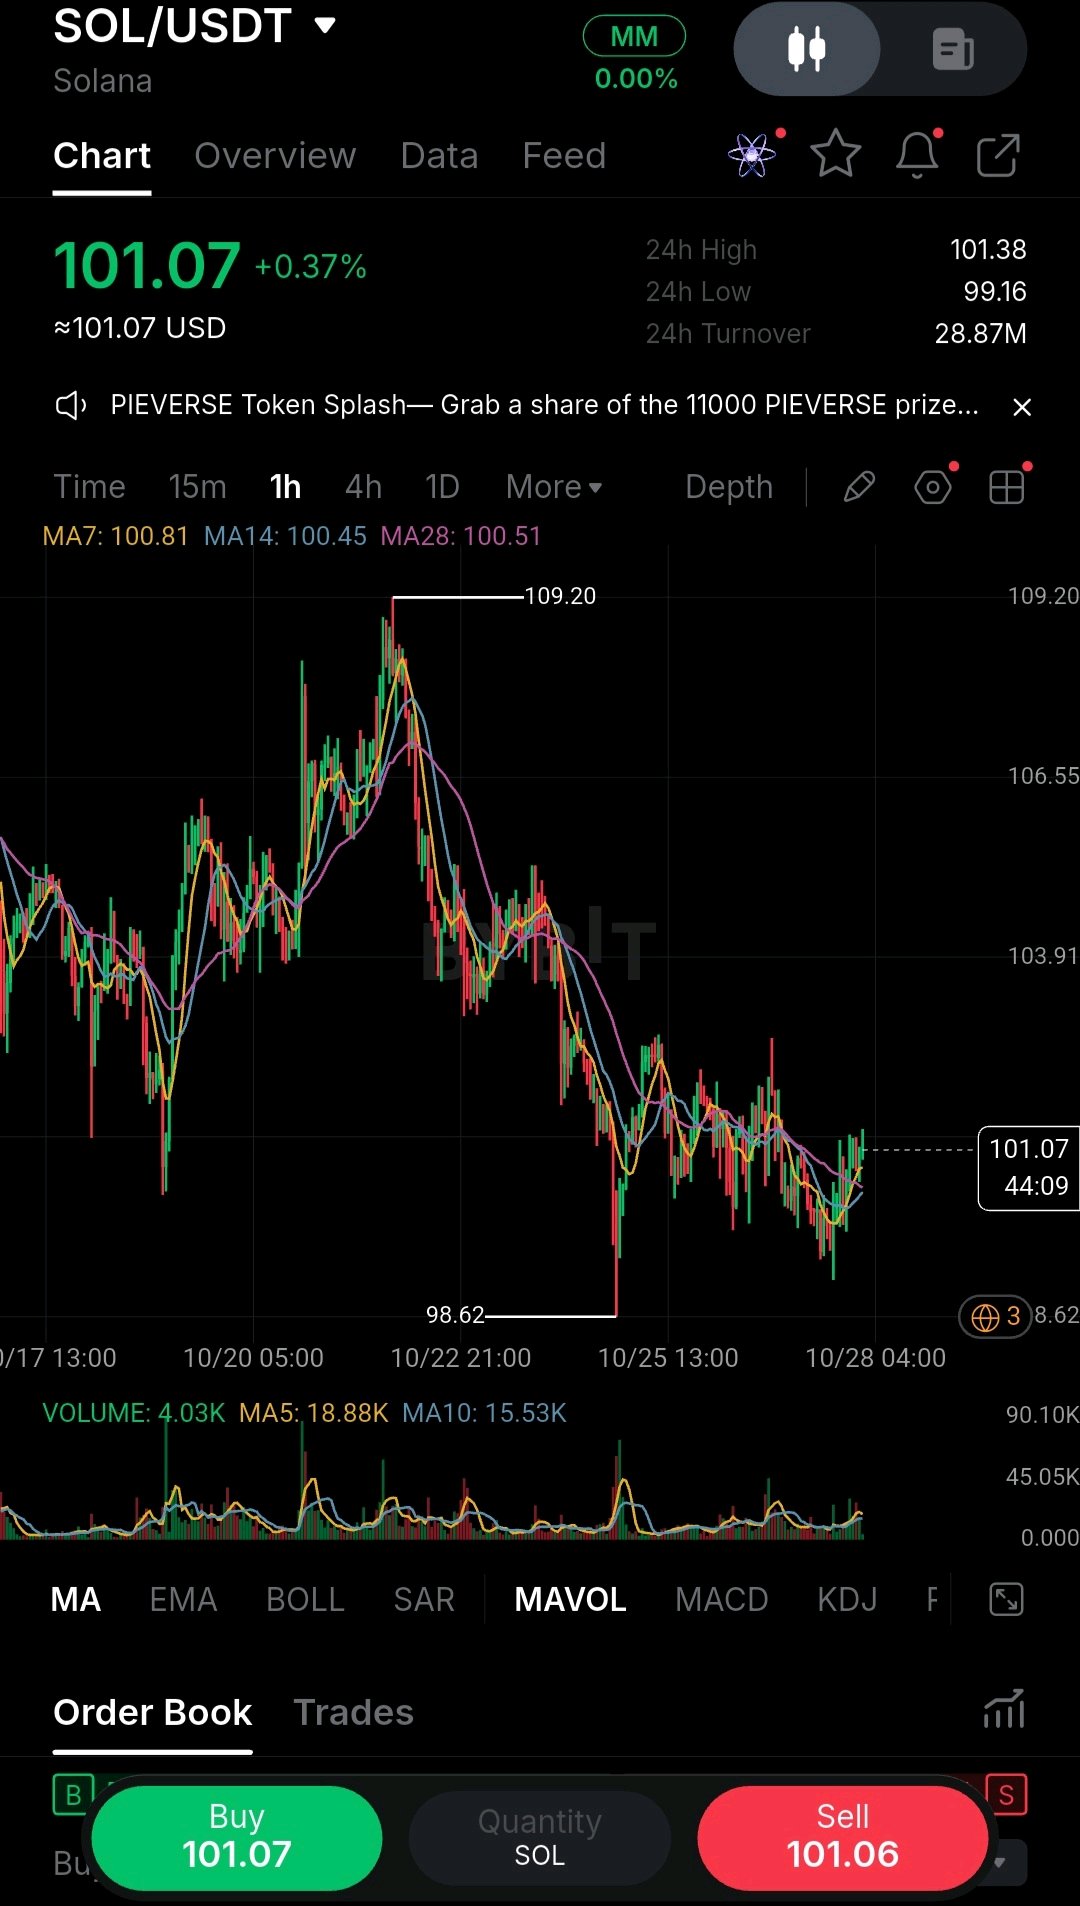
SOL JUST PRINTED A HIGHER LOW UNDER A LOWER-HIGH TREND: BASE OR PAUSE? SOL fell from 109.20 to 98.62, then stopped making new lows. The latest dip held 99.16, above the 98.62 swing low, while the averages have flattened and price is back on top of them. SOLUSDT, 1H. Price 101.07 (+0.37%), 24h range 99.16 to 101.38, turnover 28.87M. What the chart shows: Price sits above MA7 (100.81), MA14 (100.45) and MA28 (100.51). All three are bunched within about 0.35%, so they form one shelf just under price. The drop spans 10.58 points. The 23.6% retrace is near 101.12, so price is sitting right on the first level. The 38.2% level is near 102.66 and the 50% level near 103.91. Volume is the weak spot. The latest candle shows 4.03K against a MA5 of 18.88K and a MA10 of 15.53K. The candle is still open, but the bounce isn’t loud. The spread is tight, bid 101.06 against ask 101.07, so this is a liquid tape. Levels Support: 100.81 (MA7), 100.51 (MA28), 100.45 (MA14), 99.16 (24h low), 98.62 (swing low) Resistance: 101.38 (24h high), 102.66 (38.2%), 103.91 (50%), 105.16 (61.8%), 109.20 (swing high) Bias: a bounce while price holds the shelf at 100.45. It becomes a real recovery only above 103.91. Until then the higher highs are missing. Plan: buy the pullback onto the shelf Entry: 100.60-100.90 SL: 99.95, under the shelf and above the 99.16 low TP1: 102.66 | TP2: 103.91 R:R from 100.75: risk 0.80, so about 2.4:1 to TP1 and 4.0:1 to TP2. I’d take a partial at TP1 and move the stop to entry. Alternative (short): a rejection wick at 102.66 that closes back under, targeting 101.38 and then 100.45. Confirmation: a 1H or 4h bounce candle off the shelf, with volume rising toward its MA5. Invalidation: a 1H close under 99.95 and the higher low has failed. Risk note: the 0.80-point stop is about 0.8% of price. At 20x that is roughly 16% of your margin, so size from the stop, not from the leverage on offer. If you missed the shelf, wait for the next pullback and don’t buy the candle. A higher low against falling highs is not a reversal yet. Is that 99.16 floor the start of a base, or the quiet before 98.62 goes? #ByXIMPACT $SOLUSDT
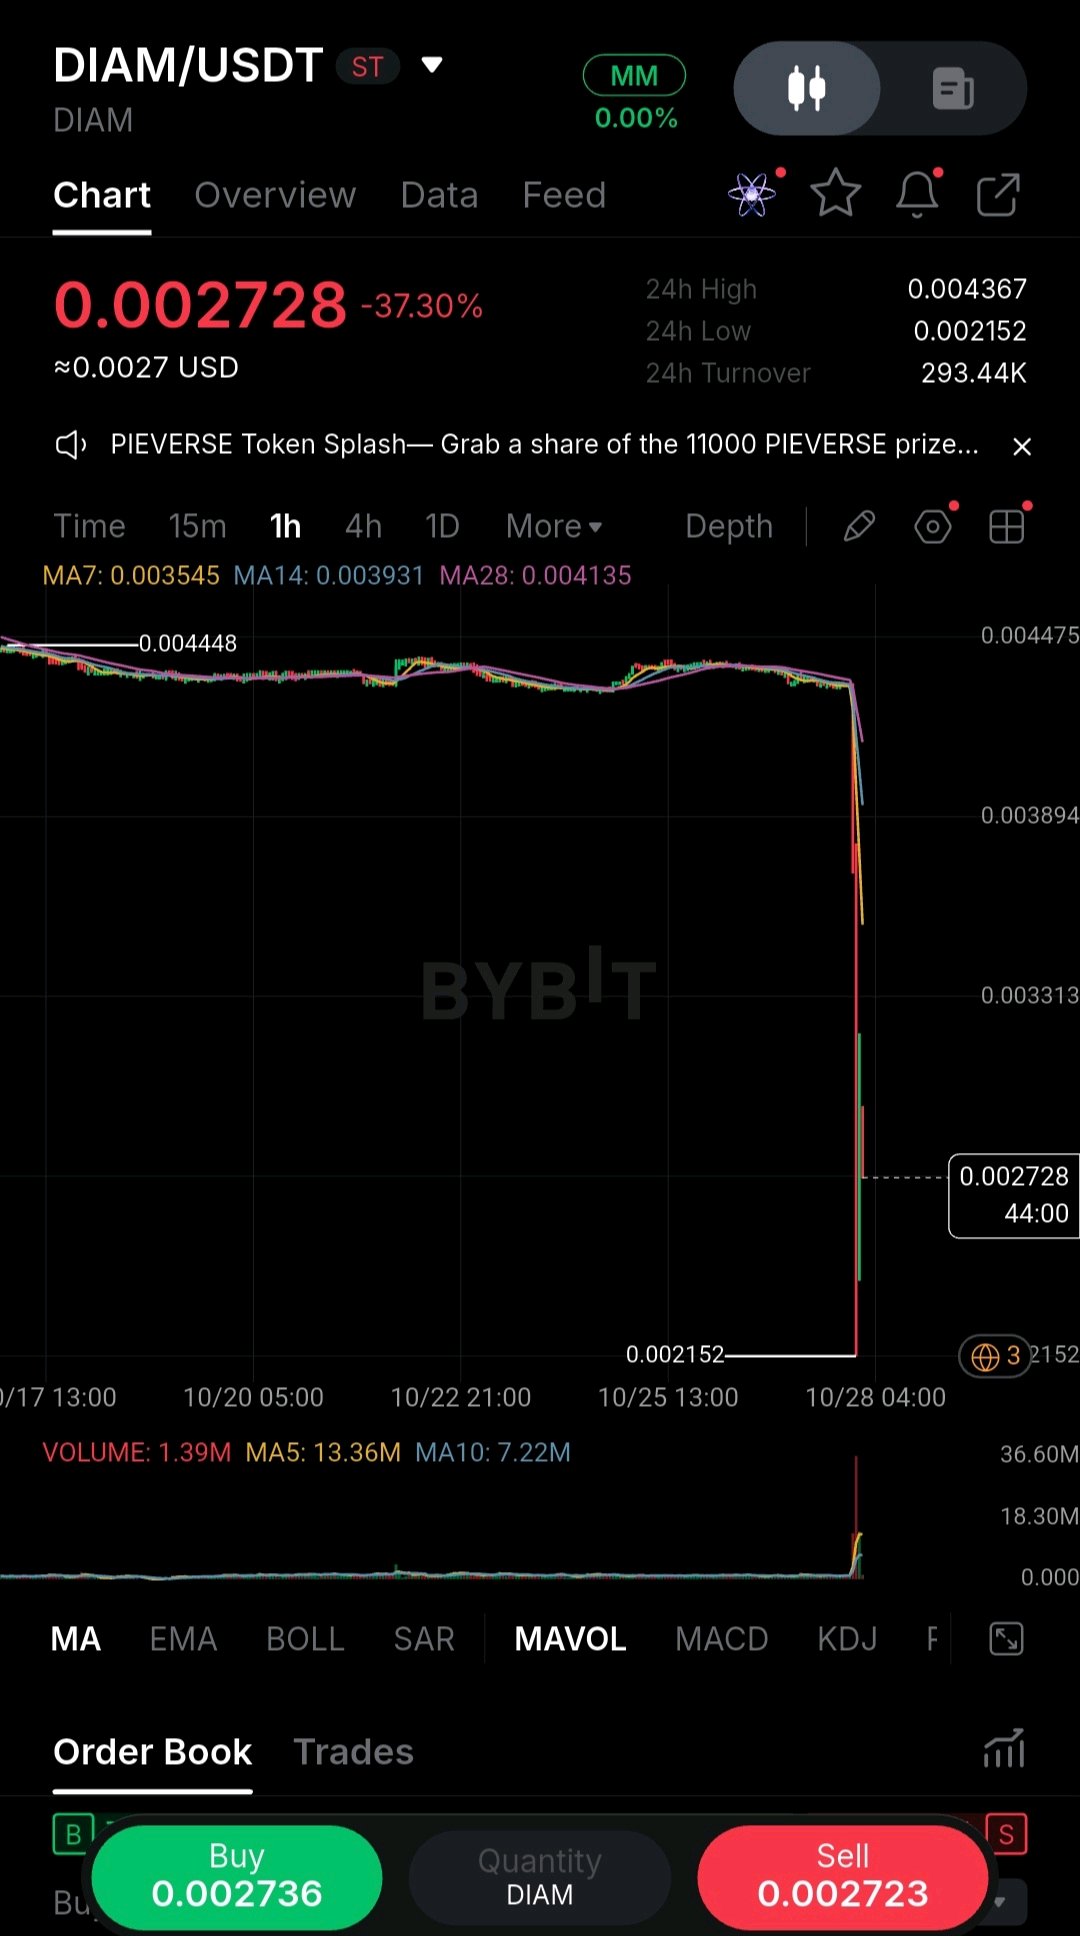
DIAM FELL 37% IN ONE CANDLE AND BOUNCED 27%: DEAD CAT OR REAL BASE? For weeks DIAM was flat near 0.0040-0.0044, with MA7, MA14 and MA28 glued together. Then one vertical candle took it down to 0.002152. That is not a normal pullback, and I don’t know the cause, so I’m not inventing a story for it. DIAMUSDT, 1H. Price 0.002728 (-37.30%), 24h range 0.002152 to 0.004367, turnover 293.44K. It carries the ST tag. What the chart shows: The bounce off 0.002152 is about +27%, but price still sits far below every average: MA7 0.003545, MA14 0.003931, MA28 0.004135. All three are now overhead supply. Measured from the 24h high of 0.004367 to the 0.002152 low, the bounce has retraced only about 26%. The 23.6% level is near 0.002675 and the 38.2% level is near 0.002998. The crash candle printed heavy volume, while the bounce candles are thin. The latest candle shows 1.39M against a MA5 of 13.36M. The spread is wide, bid 0.002723 against ask 0.002736, about 0.5%. Thin books turn small orders into slippage. Levels Support: 0.002675 (23.6%), 0.002152 (swing low) Resistance: 0.002998 (38.2%), 0.003260 (50%), 0.003545 (MA7), 0.003931 (MA14), 0.004135 (MA28) Bias: no long until 0.00300 is reclaimed. Below it, this is a bounce inside a crash. Plan (long on reclaim) Entry: 0.00299-0.00302, only after a 1H close above 0.00300 and a retest that holds SL: 0.00265 TP1: 0.003545 | TP2: 0.003931 | TP3: 0.004135 R:R from 0.003005: risk 0.000355, so about 1.5R to TP1, 2.6R to TP2, 3.2R to TP3. The MAs will drift, so re-measure before entering. Alternative (short): a rejection wick at 0.00300 that closes back under, targeting 0.002675 and then the 0.002152 low. Invalidation: a 1H close under 0.002675 before the reclaim means the bounce has failed. A new low under 0.002152 means the crash is continuing. Risk note: ST tag, 293K turnover and a 0.5% spread mean this can gap through any stop. Size so a full stop-out costs a tiny, fixed % of your account, and use limit orders only. Check Bybit’s announcements for the cause before you trade. Volume was huge on the way down and thin on the way up. Who is actually buying this bounce? #ByXIMPACT $DIAMUSDT
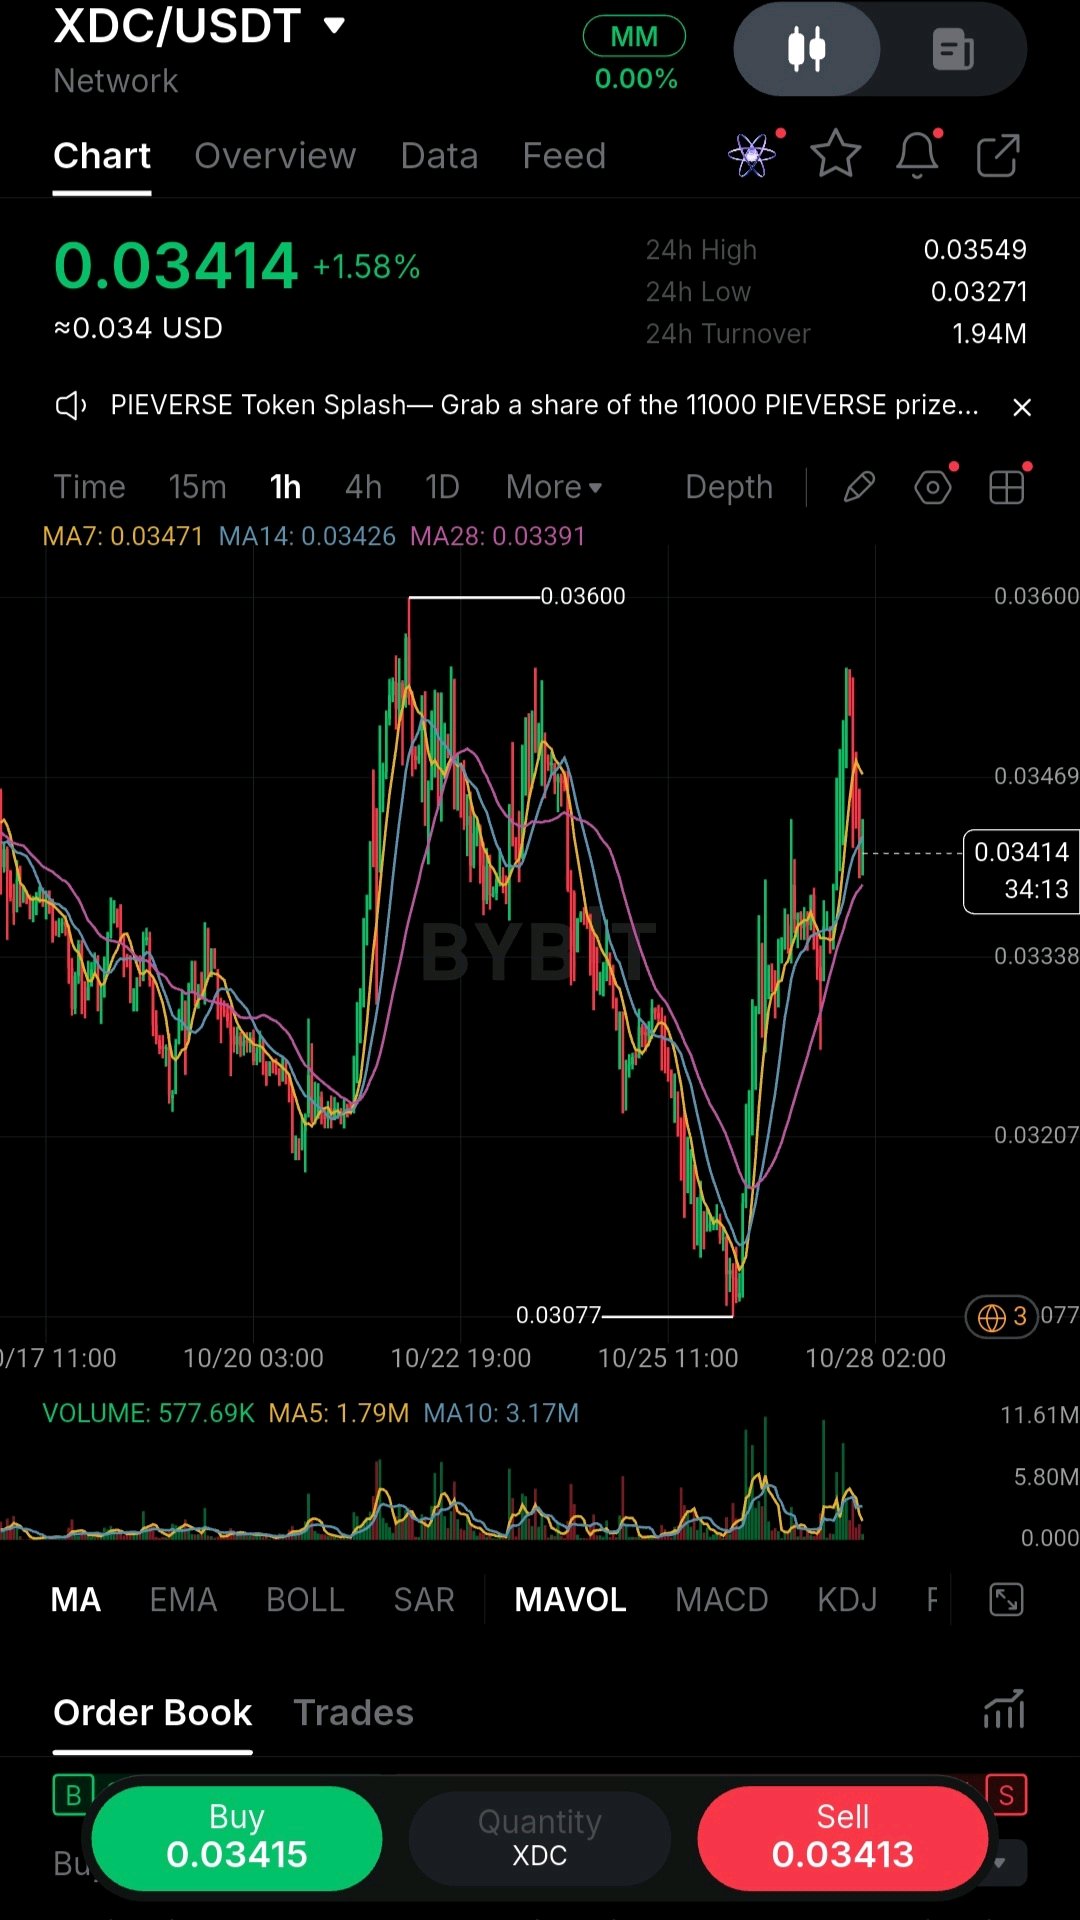
A V-shaped bounce looks great until you notice what it did at the top. XDC went from 0.03077 to a spike near 0.0355, got rejected hard, and is now back at 0.03414. The pump candles had real volume, but the pullback is already pushing price under MA7 (0.03471) and MA14 (0.03426). That tells me buyers got a first reaction, not control. The level I care about is 0.0339, where MA28 sits, right above the 0.0334 area that held during the bounce. If buyers defend that zone and form a higher low, the move up is still alive and I’d look for a push back toward the 0.0355 high. If price loses it on a 1H close, the spike was just a relief rally and the lows come back into play. I’m not buying 0.03414 in the middle of nowhere, and I’m not shorting a bounce this size either. I’d rather let it come to me. Entry: 0.03385–0.03400 (only after a 1H candle holds MA28 and closes green) SL: 0.03300 TP1: 0.03545 TP2: 0.03600 Invalidation: 1H close below 0.03320 Risk management: the stop is about 0.00095 away, so TP1 is roughly 1.6R and TP2 about 2.2R. I risk no more than 0.5–1% of the account on this, so position size comes from the stop distance, not from how bullish I feel. At TP1 I take half off and move the stop to breakeven. If the entry zone doesn’t trigger within the next 12 hours, I cancel the idea. Turnover is only 1.94M, so slippage is real here. I keep this one small. If price rejects at 0.0347 and loses 0.0338, I stay flat. No trade is a valid trade. Are you buying the MA28 retest, or waiting to see if XDC makes a lower low first? #ByXIMPACT $XDCUSDT
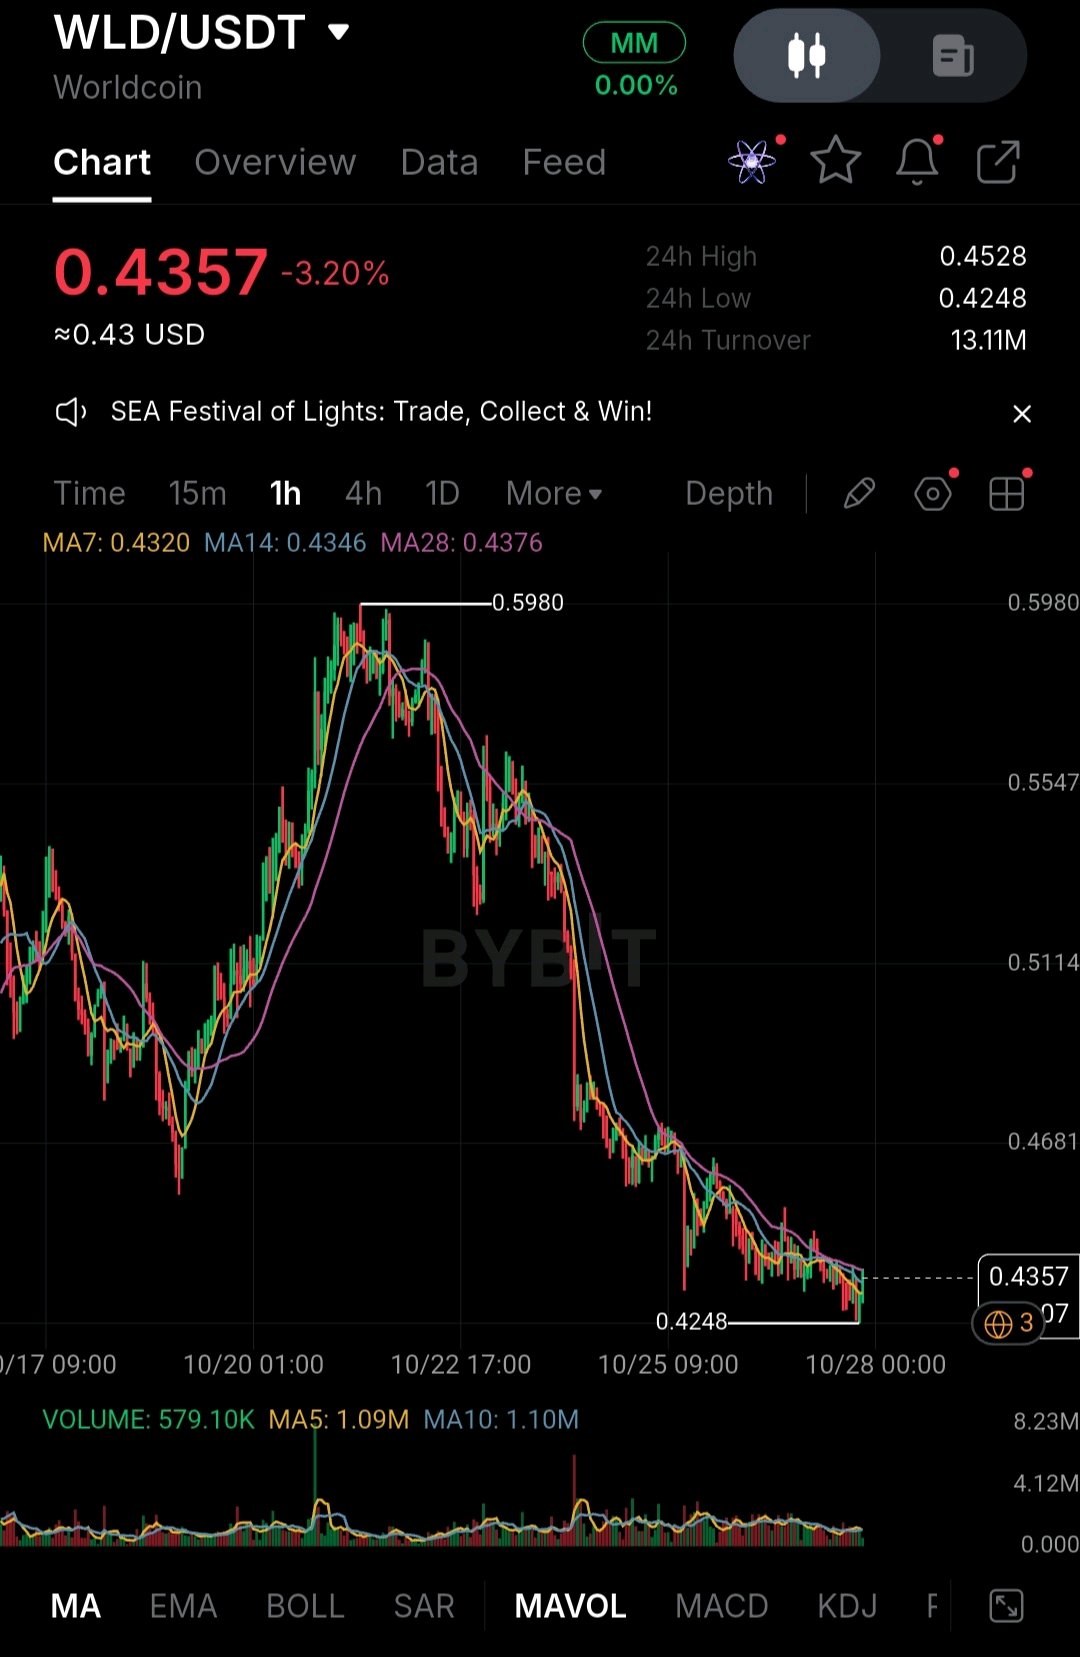
WLD is sitting right on top of its low, and I’ll be honest, my first thought was to short it here. Price is down about 29% from 0.5980, every bounce has been weaker than the last, and the MAs are stacked bearish with MA28 at 0.4376 overhead. But I’m not shorting the low. Look at the volume. There’s no capitulation spike on the way down, it’s a slow grind. Slow grinds near a low are where I’ve seen shorts get squeezed the fastest, so I’d rather let the level break and prove itself. The line I’m watching is 0.4248, the 24h low. Price is only about 2.5% above it right now, so this gets decided soon. My plan: I need a 1H close below 0.4248 first, then I short the retest from below. If it holds above 0.4248 and reclaims MA28 at 0.4376 with a strong close, I drop the short idea completely, and the next test is the 0.4528 high. Entry: 0.4250–0.4265 on a retest from below after the breakdown SL: 0.4380, above MA28 TP1: 0.4100 TP2: 0.4000 That’s roughly 1.3:1 to TP1 and 2.1:1 to TP2. TP1 is mainly there to cut risk, not because I think the move ends there. Invalidation: a 1H close above 0.4376. If it does that, the bounce is real and I’m out of the way. No retest, no trade. If it flushes straight down without giving me an entry, I let it go. Are you shorting the breakdown, or waiting to see if 0.4248 holds? #ByXIMPACT $WLDUSDT
Balancer’s pools switch to withdrawals-only on October 30, three days from now. BIP-928, the wind-down plan, passed the Snapshot vote on September 29 with 99.2% of 17,226,164 BAL in favor. The rival fork proposal, BIP-929, lost with 69.9% against. After October 30 the V3 Vault pauses on November 30, and BAL holders can burn their tokens for a share of the treasury from the end of May 2027. That payout is the part worth examining. Marcus Hardt, Balancer Labs’ former CEO and the author of the plan, put the distributable treasury at about $9.96 million against 63.07 million redeemable BAL, which works out to roughly $0.1579 per token. His own September 20 update treats the figure as unaudited. BAL traded near $0.134 on September 30, the most recent quote I have, so the estimate sits about 18% above that price. The money arrives seven months later, from a number the plan’s author calculated himself. At that point BAL is no longer a governance or revenue token. In April, BIP-918/919 cut holders’ share of protocol revenue to zero, and this plan replaced the approved buyback with burn-to-redeem. The token is now a claim on whatever is left in the treasury. Turnout was thin for a vote that ended the protocol. The 17.2 million BAL that voted equals about 27% of the 63.07 million BAL the payout estimate assumes, though the voting-eligible base and the redeemable base aren’t necessarily the same pool. The October 30 cutoff isn’t clean either. The proposal’s timeline pauses pools only where the contracts allow it, and it ends bug bounty coverage for every pool on the same date. Pools that can’t be paused keep operating without bounty coverage, on a protocol that lost about $128 million to a v2 exploit in November 2025. That reading of the timeline is mine. The proposal doesn’t say outright that unpausable pools stay open. Crypto Times reported on October 26 that Balancer found about $500,000 in overlooked user funds, v3 buffer shares and v2 liquidity-mining rewards. Funds sat unclaimed even after a vote, a forum thread and weeks of notice. Anyone who hasn’t pulled their liquidity is relying on a withdrawal process that has already missed money once. Two things to check after October 30: which V3 pools partners kept alive through the November 30 extension, and how much liquidity is still sitting in pools once withdrawals-only starts. #MyByXTake #ByXIMPACT #IMPACTbyTrade $BTCUSDT $SOLUSDT
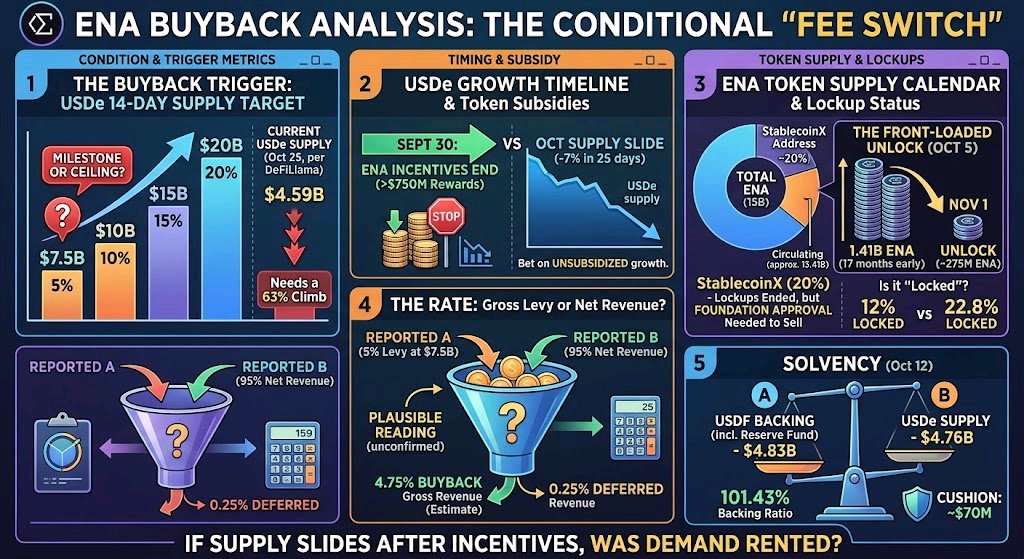
Ethena’s fee switch passed on September 2 with 17.8M votes in favor and none against, but ENA holders got a condition that has nothing to do with governance: buybacks start only when USDe’s 14-day average supply reaches $7.5B. The rate then steps up with supply, to 10% at $10B, 15% at $15B and 20% at $20B. USDe stood at about $4.95B on September 30, $4.66B on October 21 and $4.59B on October 25 per DeFiLlama. That’s a 7% slide in 25 days, and from here it needs a 63% climb to reach the trigger. The October 2025 peak was about $15B. The timing matters. On September 26 Ethena announced that all ENA incentives and inflation tied to USDe growth would end on September 30, after more than $750M in rewards and an ~85% decline since the first airdrop in 2024. So the first month of USDe without a token subsidy is the month supply slid. That doesn’t prove cause. Funding rates and basis yields move supply too, and staked USDe held at $1.212B (25.45% of supply) as of October 12. But the switch is now conditional on exactly the metric the subsidy used to prop up. The token calendar, meanwhile, is front-loaded. On October 5 the remaining investor allocation, about 1.41B ENA, unlocked in a single step, 17 months early. That replaced roughly 78.1M a month through March 2028 (18 months of it works out to the same 1.41B). It followed a Foundation buyout of early investors who had sold after the October 2025 peak. Another ~275M ENA unlocks on November 1, with about 13.41B of 15B already circulating. In fairness, one known release is easier to price than a 17-month drip. One address, StablecoinX, holds about 3.03B ENA (roughly 20% of supply) whose lockups have ended but whose sales need Foundation approval. Whether that counts as “locked” seems to be why some write-ups say 12% is locked and others say 22.8%. The buyback rate itself gets reported two ways: 5% of revenue at $7.5B, and 95% of net revenue. The governance update carries both numbers. The most plausible reading is a 5% to 20% levy of which 95% goes to ENA purchases, which would make the first-tier buyback about 4.75% of gross revenue. That’s my reading, not a confirmed parameter. Solvency isn’t the concern. As of October 12, backing was $4.83B against $4.76B of USDe, a 101.43% ratio including the reserve fund, roughly a $70M cushion. Ethena has bet that USDe grows without being paid to. The trigger reads a 14-day average, so one big mint won’t flip it. If supply keeps sliding after the last subsidy ended, is $7.5B a milestone or a ceiling on demand that was partly rented? #IMPACTbyTrade #MyByXTake #ByXIMPACT $ENAUSDT
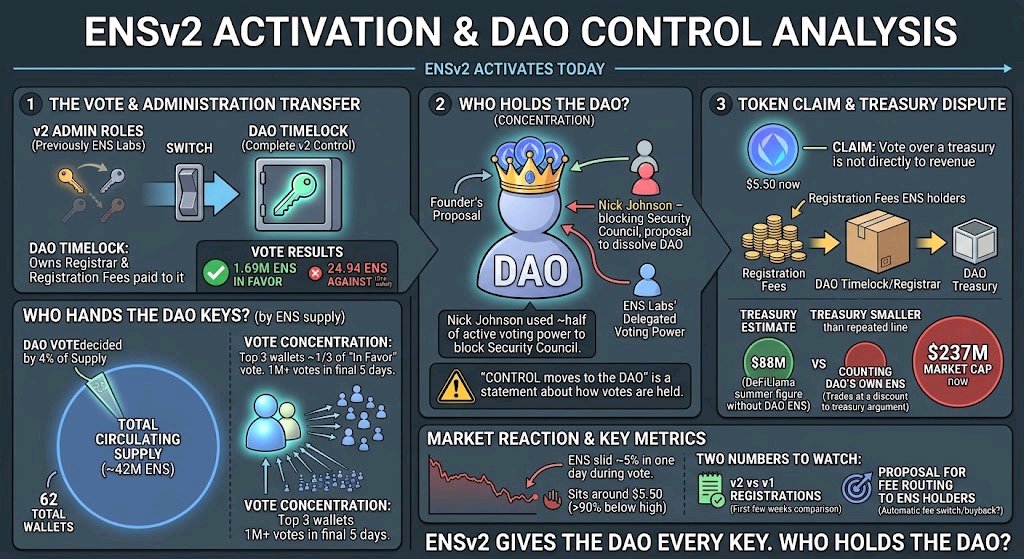
ENSv2 activates today. The DAO voted it through with 1.69M ENS in favor and one wallet against, which cast 24.94 ENS. The pitch is clean: every v2 admin role moves to the DAO timelock, and ENS Labs keeps no special privileges. Worth asking who the DAO is. That vote came from 62 wallets. The top three supplied about a third of it, and more than 1M of the votes arrived in the final five days. Circulating supply is around 42M ENS, so the vote that handed the DAO every v2 key was decided by roughly 4% of supply. The proposal came from the founder, and one delegate flagged on the forum that ENS Labs’ delegated voting power was concentrating influence. That isn’t a theoretical worry here. This summer, Nick Johnson used roughly half of the DAO’s active voting power to block renewal of its Security Council, and a proposal to dissolve the DAO followed. “Control moves to the DAO” is really a statement about how the votes are held. Now the token. In v2 the registrar is owned by the DAO timelock from deployment, and registration fees are paid straight to it. Nothing about revenue changes hands. I couldn’t find a fee switch or buyback that sends any of it to ENS holders. The token’s claim is a vote over a treasury. And that treasury is smaller than the line people repeat. The “ENS trades at a discount to treasury” argument counted the DAO’s own ENS tokens at market price. DeFiLlama’s figure without them was about $88M this summer, against a market cap near $237M now. The market isn’t treating this as a catalyst. ENS slid about 5% in a day during the vote and sits around $5.50, more than 90% below its high. I’m watching two numbers: how v2 registrations compare with the old v1 run-rate in the first few weeks, and whether any proposal ever routes those fees to holders. ENSv2 gives the DAO every key. Who holds the DAO? #IMPACTbyTrade #MyByXTake #ByXIMPACT $ENSUSDT
NEAR RSI hit 31. Fear or opportunity?
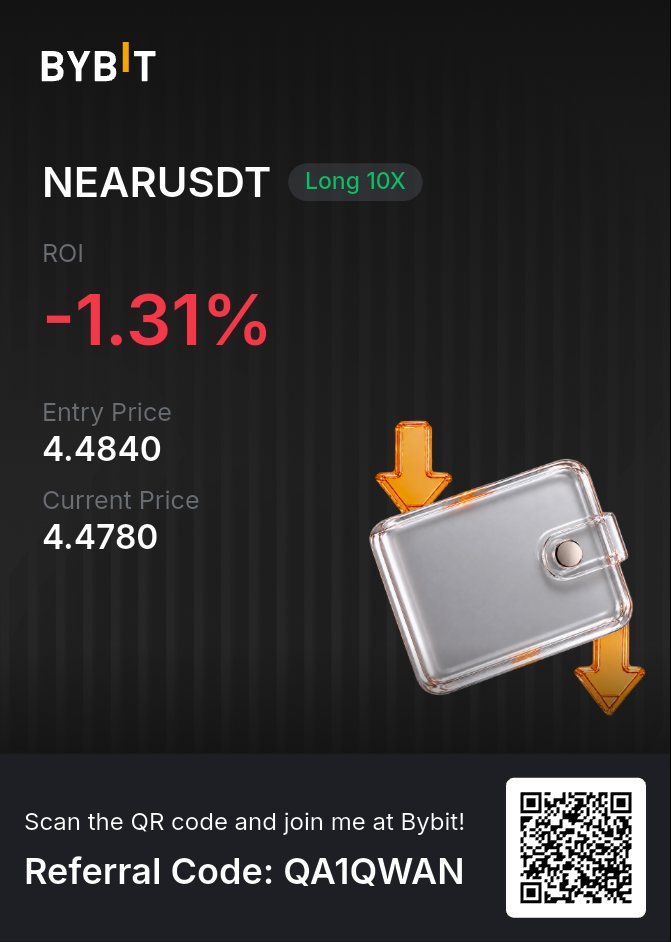
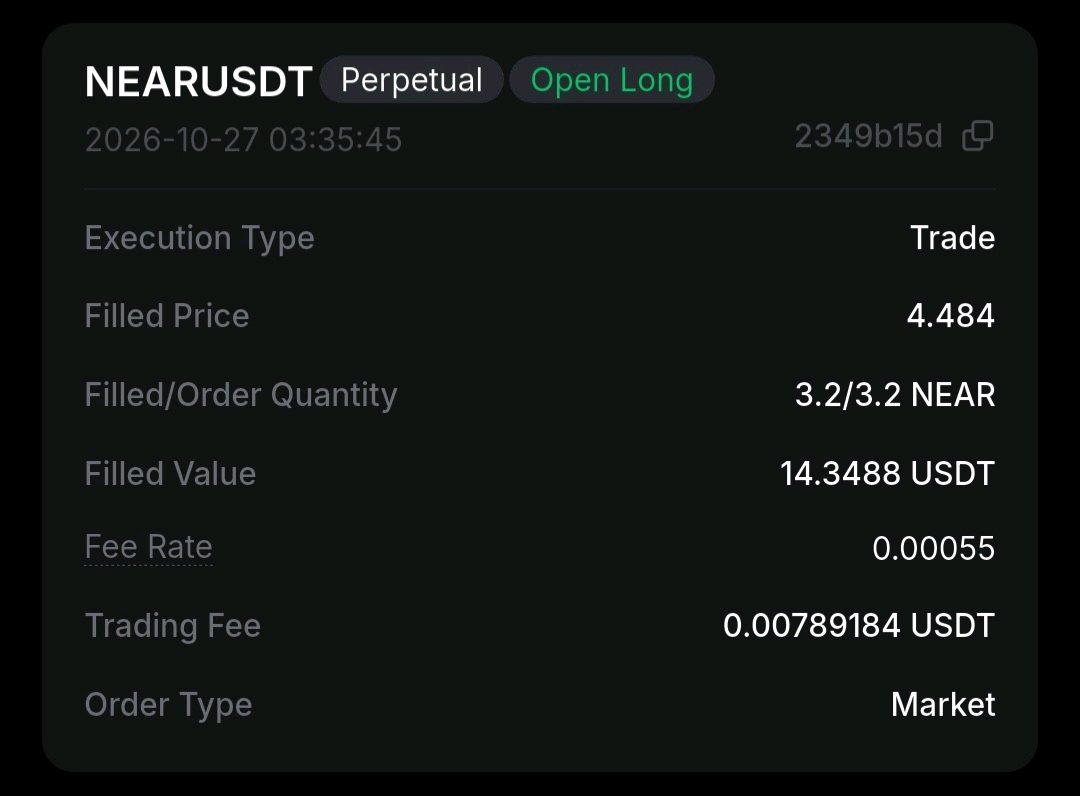
NEAR fell 7% in a day while Bitcoin slipped about 1%, and RSI was already at 31 when price was still at $4.53. I went long at 4.4840 with 10x leverage (attached), right above the $4.44 support everyone is watching. This is the full case, including the parts that could go wrong. Why would I buy something this weak? The drop is real, but the bigger trend isn’t broken. NEAR is still up about 150% over 90 days, spot ETF inflows stayed positive through October 24, and NEAR intents volume has been rising. A pullback of 12% on the week after a run like that is what a market looks like when leverage gets cleaned out, not necessarily when buyers leave. I’m treating it as a possible flush, not a confirmed bottom. The structure is simple. Support sits at $4.438, then $4.040, then $3.443. Overhead, the 200 EMA at $4.643 is the first level bulls need to reclaim, and above it NEAR has been rejected again and again around $5.40 to $5.60, with long upper wicks each time. There was also a false breakout near $6.00 on October 12 that still hangs over the chart. So I’m not trading a trend. I’m trading a bounce off support into a ceiling. My plan is a long at 4.4840 with a stop at 4.40, just under the $4.438 support. That’s about 1.9% on price, or roughly 19% of my margin. First target is the 200 EMA at 4.643, about 3.5% higher, or roughly +35% on margin, which works out to about 1.9 to 1 reward-to-risk. If it holds, the second target is the $4.70 to $4.80 zone, where the old support should now act as resistance, and I only hold a small runner toward $5.45 if $4.80 flips to support. When TP1 hits, I take half and move the stop to entry. Here is what could go wrong. Price could lose $4.438 and hold below it, which opens $4.040 and then $3.443, and my liquidation sits near $4.04 at 10x, so the stop has to do its job. Oversold can stay oversold, and long liquidations were still rising while spot demand looked thin. Bitcoin weakness would drag NEAR further, because it fell harder than BTC on the way down and would probably do the same again. My stop is also tight after a 10% daily move, so a wick can sweep it and the price can recover without me. What would make this trade better? I bought before NEAR reclaimed anything. Waiting for a daily close back above $4.643 would have given a cleaner confirmation at a worse price, and I chose the earlier entry. Lower leverage would let me use a wider stop, like $4.30, without risking 41% of margin. I’m also not adding if it dips, because there’s no spare margin to absorb a wick, and that is a real limit on how well I can manage this trade. What proves me wrong is a close below $4.44 that holds, or a failed bounce that gets rejected at the 200 EMA. If either happens, I’m out. I’m not calling the bottom. I’m taking a small bet that selling is overdone near support, with the exit written down before the trade. Do you read the $4.44 support as buyers defending the level, or just a pause before the next leg down? #IMPACTbyTrade #MyByXTake #ByXIMPACT $NEARUSDT
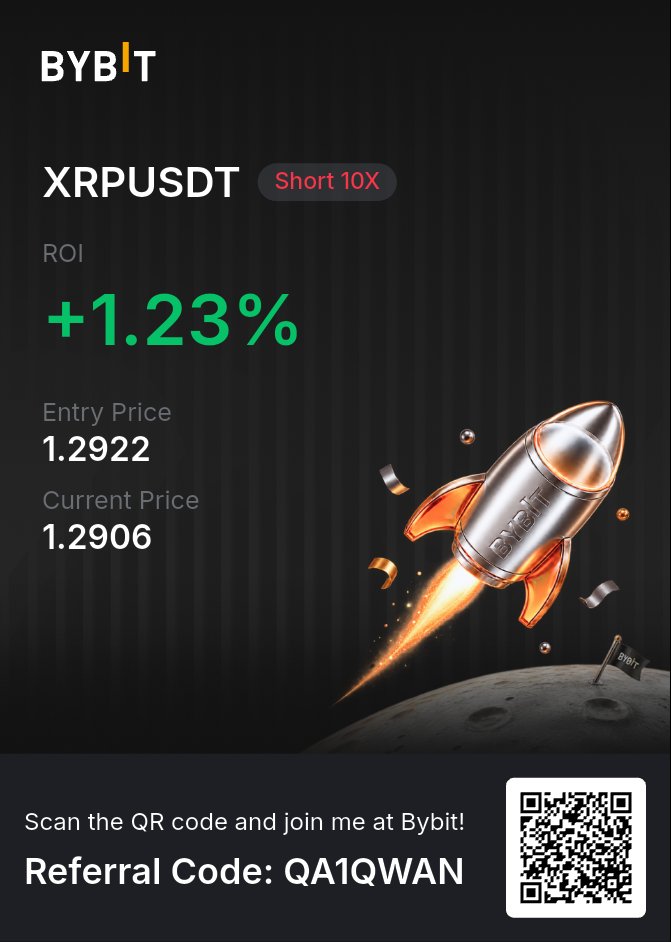
XRP short at 1.2922 (10x): my reasoning, the risk math, and where I could be wrong XRP is down about 17% this month and sitting on the $1.26-$1.33 support zone. Shorting after a drop that big is where many traders get squeezed, so I want to show exactly why I took this trade and what would make me exit. It’s a small, leveraged position with a defined stop. I’m not calling a crash. Why I’m short here Since the $1.60 area, XRP has kept making lower highs. The last bounce from $1.27 ran into the $1.40 resistance and faded, and price has slid back toward $1.29. When rallies keep getting sold at lower levels, a short has an edge, because each bounce gives sellers a chance to add. BTC is also below $80K after five straight losing days, and XRP has been falling with it instead of holding up better. Are whales leaving, or is it noise? Large-wallet counts have dropped, and about $61M moved onto exchanges. Coins moving to exchanges is how supply looks before it gets sold. But data providers report different totals, and a falling wallet count doesn’t guarantee a falling price. I’m treating it as pressure that supports the idea, not proof. Is ETF demand enough to hold the price up? Spot XRP ETFs have pulled in over a billion dollars since launch, which is real institutional access. But recent flows have been mixed, and price has dropped even on some inflow days. This is the biggest risk to my trade: if flows pick up while $1.26 holds, the short is in trouble. Is the regulatory story dead? Not dead, but stalled. A court already ruled that XRP is not a security, and Ripple is backing the SEC’s proposed rules, but the CLARITY Act hasn’t crossed the line. The catalyst the market wanted is delayed, and price has drifted without it. That fits the weak bounces, but it can flip fast on a headline. Levels Support: $1.26 is the level analysts call critical. Below it, $1.11, then $0.98. Resistance: $1.40, then $1.50, with heavy volume around $1.40-$1.55. Funding is slightly positive, so longs are paying shorts. That’s a tiny edge, and I’m not trading it. My trade and the risk math Short XRP/USDT at 10x, entry 1.2922 (attached). Stop: a close above $1.33, the top of the support zone. That’s about 2.9% above my entry, or roughly -29% of margin at 10x. First target: $1.26, about 2.5% below entry, or roughly +25%. Second target: $1.11, only if $1.26 breaks and holds. The first target pays slightly less than I’m risking, about 0.85 to 1. I’m saying that plainly because the trade really works only if $1.26 breaks. Where I could be wrong, and what I’d do differently I’m shorting inside the support zone, not after it breaks. A cleaner short would wait for a hold below $1.26, at a worse price. I chose the earlier entry and accept the squeeze risk. ETF inflows could return and push XRP toward $1.40. The Fed decision tomorrow can move everything within hours, in either direction. If price closes above $1.33, the idea is wrong and I exit. I won’t move the stop because hindsight looks different. Conclusion The selling pressure is real, but support hasn’t broken. I’m betting the next bounce fails the way the last ones did, with a clear exit if it doesn’t. If $1.26 breaks, do you think $1.11 is next, or does ETF demand step in first? #IMPACTbyTrade #MyByXTake #ByXIMPACT $XRPUSDT
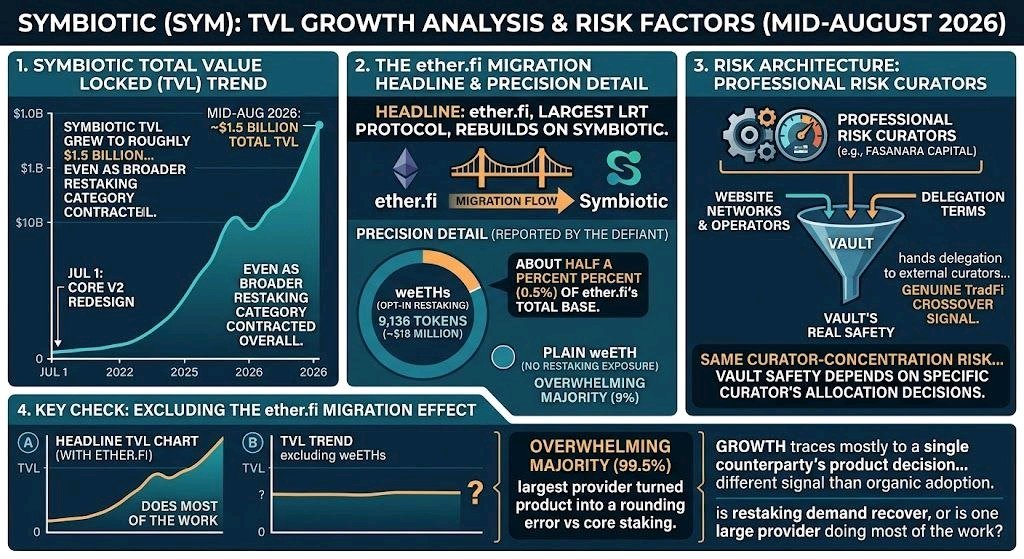
Symbiotic grew to roughly $1.5 billion in total value locked by mid-August 2026, even as the broader restaking category contracted overall. The reason traces to one specific event: ether.fi, the largest liquid restaking protocol, rebuilt its restaking product on Symbiotic rather than EigenLayer. That’s the headline most coverage leads with. The more precise detail, reported by The Defiant, is what ether.fi actually did with restaking once it moved: it quarantined the whole thing into a separate, opt-in token called weETHs. As of that report, weETHs held around 9,136 tokens — roughly $18 million — about half a percent of ether.fi’s total staking base. That’s worth sitting with. The category’s single largest LRT provider didn’t migrate its restaking exposure to a new venue and keep it as the default product. It made restaking something a user has to deliberately opt into through a separate token, while the overwhelming majority of ether.fi’s users now hold plain weETH with no restaking exposure at all. Three years into the restaking narrative, its largest liquid provider has effectively turned the product into a rounding error against its core staking business. That has a direct consequence for how to read Symbiotic’s own growth number. A meaningful share of Symbiotic’s $1.5 billion TVL is attributable specifically to ether.fi’s migration — one large, concentrated flow from one dominant partner, not broad independent demand from many restakers choosing Symbiotic on its own merits. Growth that traces mostly to a single counterparty’s product decision is a different kind of signal than organic adoption spread across a diverse user base, even though both show up identically in a headline TVL chart. The underlying risk architecture is also worth being precise about. Symbiotic’s Core V2 redesign, live since July 1, 2026, hands the actual terms of each vault — which networks and operators the collateral gets delegated to — to professional risk curators, including the London asset manager Fasanara Capital. That’s a genuine signal of TradFi crossover into this category. It’s also the same curator-concentration risk shape that’s shown up repeatedly across this space: a vault’s real safety depends on that specific curator’s allocation decisions across potentially many vaults at once, not on which restaking protocol the vault happens to sit on. Worth checking before treating Symbiotic’s growth as evidence restaking demand is recovering: what the TVL trend looks like excluding the ether.fi weETHs migration specifically, since that’s the only way to tell whether the category is actually growing again or whether one large provider’s product decision is currently doing most of the work in the headline number. #IMPACTbyTrade #MyByXTake #ByXIMPACT $ETHFIUSDT
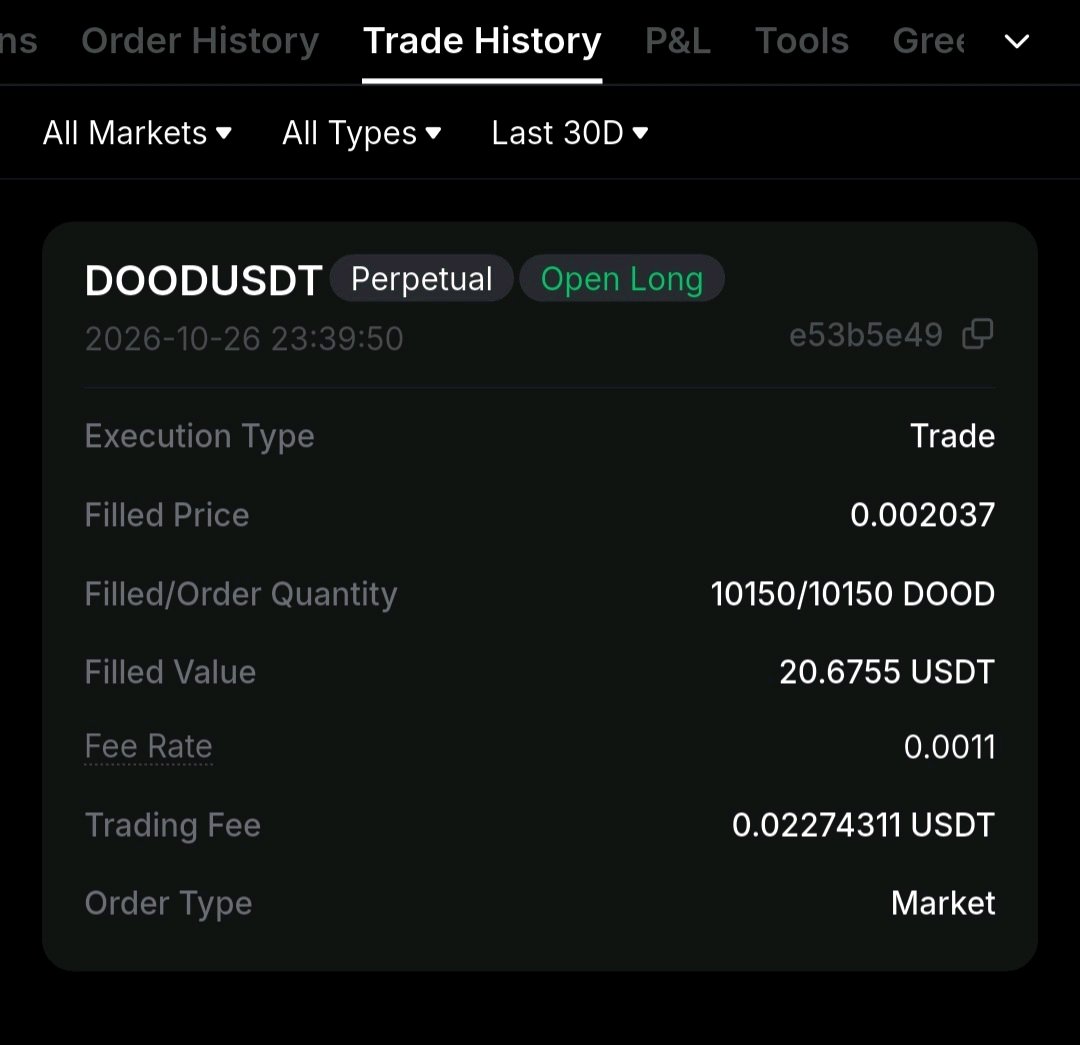
DOOD/USDT: up 100%+ with no news, and I still opened a long. Smart or a trap? 🤔 My real trade is a perpetual long on DOOD, opened with a market order at 0.002037. I have not placed a stop or take-profit order yet. Leverage: [12x]. The levels I’m watching are 0.0020 as invalidation, 0.0025 as first resistance, then 0.0028. Price is now around 0.0022. The surface picture: the rally is enough to make you nervous Everyone in the group is yelling “get in,” but all I smell is liquidation. DOOD went from 0.0011 to 0.0026, up 50%+ in 24 hours, and at its most extreme 212% in a single day. Its market cap briefly hit $38 million, while trading volume reached $100–200 million, dozens of times the market cap. NFT floor prices rose only 7%, so nobody is buying NFTs. The degens are going all-in on perpetuals. 1. A huge rally with no news is the most dangerous kind of “good news” No partnerships, no upgrades, no influencers shilling it, yet DOOD surged 212%. A rally with no news is, at its core, a liquidity grab. With a small-cap coin, a few million dollars can make it double. They pump it until you FOMO, chase the top, and open a long, then the whales dump their bags on you at the peak. 2. Negative funding is not automatically bullish Funding is deeply negative, nearing -2% every 8 hours, so shorts are paying longs, and short liquidations are driving the move. That’s short-term upward momentum. But it also means the squeeze is a one-time fuel: once the crowded shorts are wiped out, the buying can disappear and price can fall back to where it came from. Open interest has risen significantly, which means more leveraged positions are exposed to a sharp reversal. Negative funding on a small-cap coin is a piece of candy with a slap waiting behind it. 3. Technically: consolidation after a high-volume breakout, not “the bull market is back” DOOD broke out from 0.0011–0.0014 to 0.0026 on high volume and is overbought in the short term. Support: 0.0020–0.0018, then 0.0015–0.0013 Resistance: 0.0025–0.0028, then 0.0030–0.0035 (previous high and psychological barrier) At 0.0022, price is stuck between support and resistance. If it can’t break 0.0025, it’s a false breakout. If it falls below 0.0020, the retracement begins. Why I still took a long I’m not calling this a bull market. My entry at 0.002037 sits right on the 0.0020 support, so my plan is to exit if that level fails. But right now that is a plan, not an order. Honest critique of my entry I opened a long on a coin I just called a possible trap, after a move of 100%+, with a market order, and with no stop order in place. On a perp, a fast wick can do the damage before I can react. That is the weakest part of this trade. What I take away: A rally with no news can still be traded, but only with a defined exit. Negative funding is fuel for a squeeze, not proof of a trend. A trade isn’t a plan until the exit is an order, not a thought. I won’t add to this position into 0.0025 resistance. Conclusion: seeing the trap and trading it are not the same thing. I’m not guessing the direction. I want to see whether buyers hold 0.0020 and break 0.0025, or whether the retracement begins. #IMPACTbyTrade #ByXIMPACT #MyByXTake $DOODUSDT