BITPIA
Full Time Trader
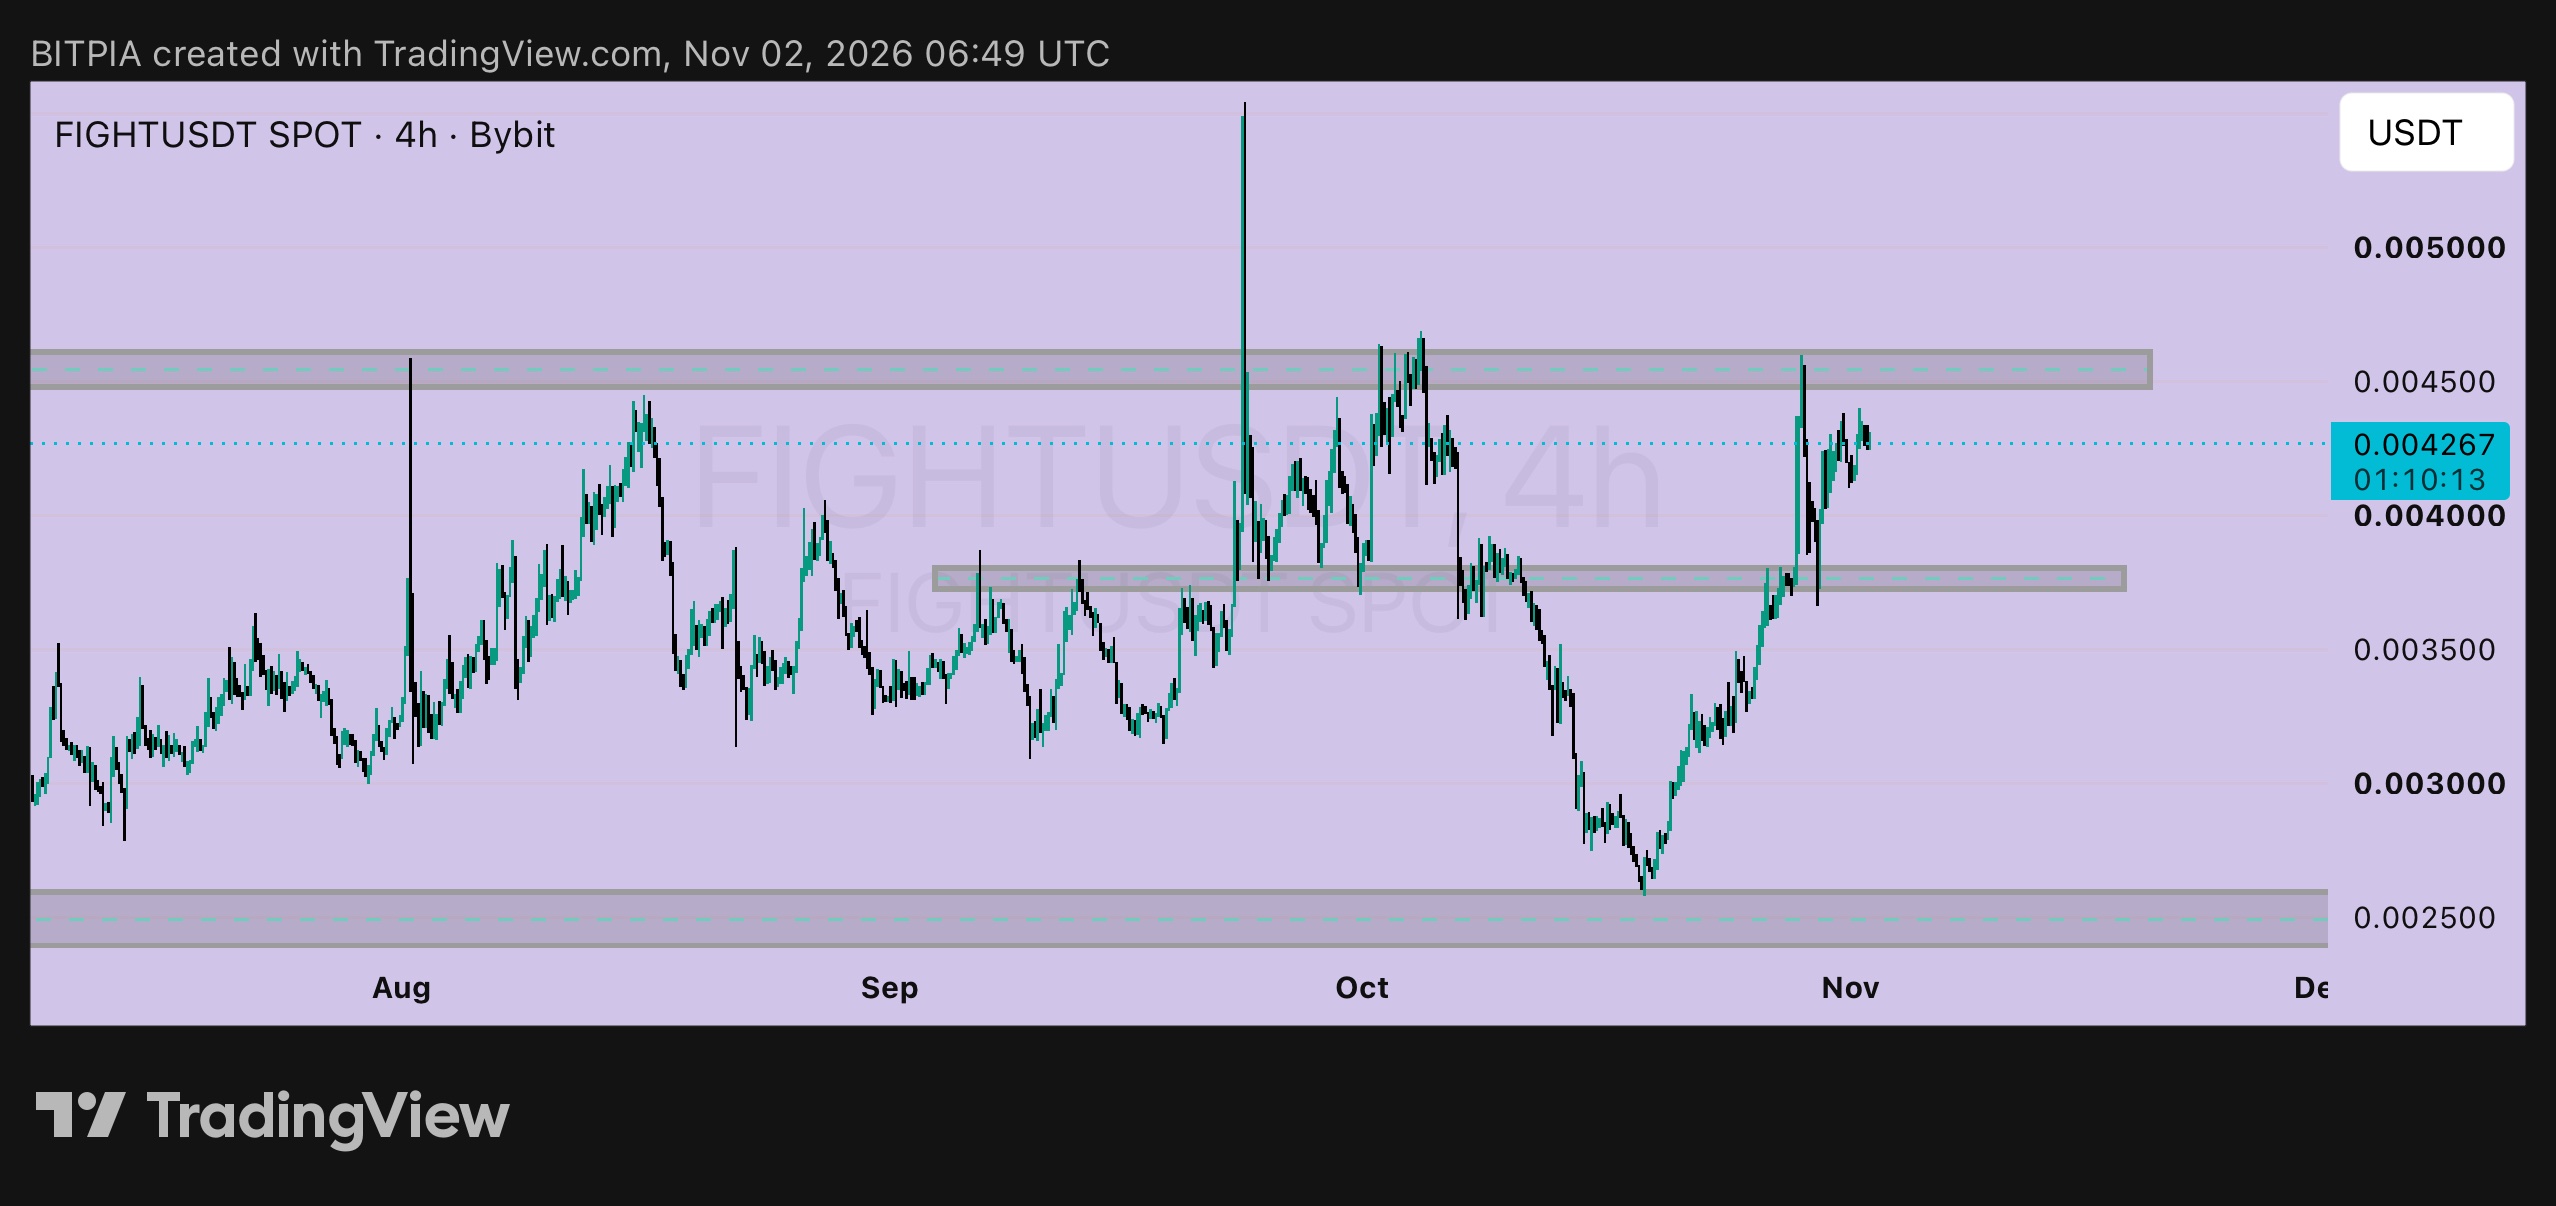
$FIGHTUSDT, the short version first, then the reasoning. TL;DR: it's still a range, price is back near the ceiling, and there's nothing for me to do yet. Here's the longer take. On Oct 31 I said skip the middle, wait for a dip into 0.0037 to 0.0038 or a clean breakout. The dip never came back. Price held a higher low around 0.00415, pushed to about 0.00440, and is now at 0.004267 on the 4h, a few ticks under the ceiling. The Oct 30 rejection high at 0.00460 is still the line that matters. What I like - Higher lows are stacking up since the 0.00368 wick, so buyers are getting more patient - The mid-range zone around 0.0037 to 0.0038 has been defended twice, which makes it a proper floor now - Price is pressing the ceiling instead of sliding away from it What I don't like - The ceiling has rejected this coin at least five times, including the huge Sep spike wick, so it's earned respect - Buying here puts the stop far below with only about 5% to the first target Levels ▸ Ceiling: 0.00450 to 0.00465 ▸ Higher low to protect: 0.00410 to 0.00415 ▸ Mid-range support: 0.00370 to 0.00380 ▸ Invalidation of the bullish idea: a 4h close below 0.00365 ▸ Targets on a breakout: 0.0055, then about 0.0067 The numbers Buying now at 0.004267 with a stop at 0.00365 risks about 14.5% to make about 5.5% at 0.0045, which I won't take. A bid near 0.00405 with a stop at 0.00365 risks about 9.9% for about 11% to the ceiling or about 36% to 0.0055, roughly 1.1 to 1 and 3.7 to 1. A breakout entry on a retest near 0.00465, after a 4h close above 0.0047, with a stop at 0.00435 risks about 6.5% for about 18% to 0.0055 or 44% to 0.0067, roughly 2.8 to 1 and 6.8 to 1. So the plan hasn't changed: let it come to the floor or prove the breakout. FIGHT wicks hard, so keep size small, and put stops beyond the wicks instead of on top of them. Not financial advice, just how I'm reading it. DYOR and only risk what you can afford to lose. #ByXIMPACT #IMPACTbyTrade
Good morning, new week, clean chart 🌅 Woke up, checked the charts, and reminded myself of one thing: the market rewards the ones who stay patient when everyone else panics. Red candles don't scare me anymore. Most of my best entries came when nobody wanted to touch it. Most of my worst losses came from chasing green. This week I'm keeping it simple: → Stick to my plan → Size my risk before I enter → No FOMO, no revenge trades → Take profits when I said I would Discipline compounds faster than any leverage ever will. Who's grinding this week? Drop your game plan below 👇 #ByXIMPACT #IMPACTbyTrade
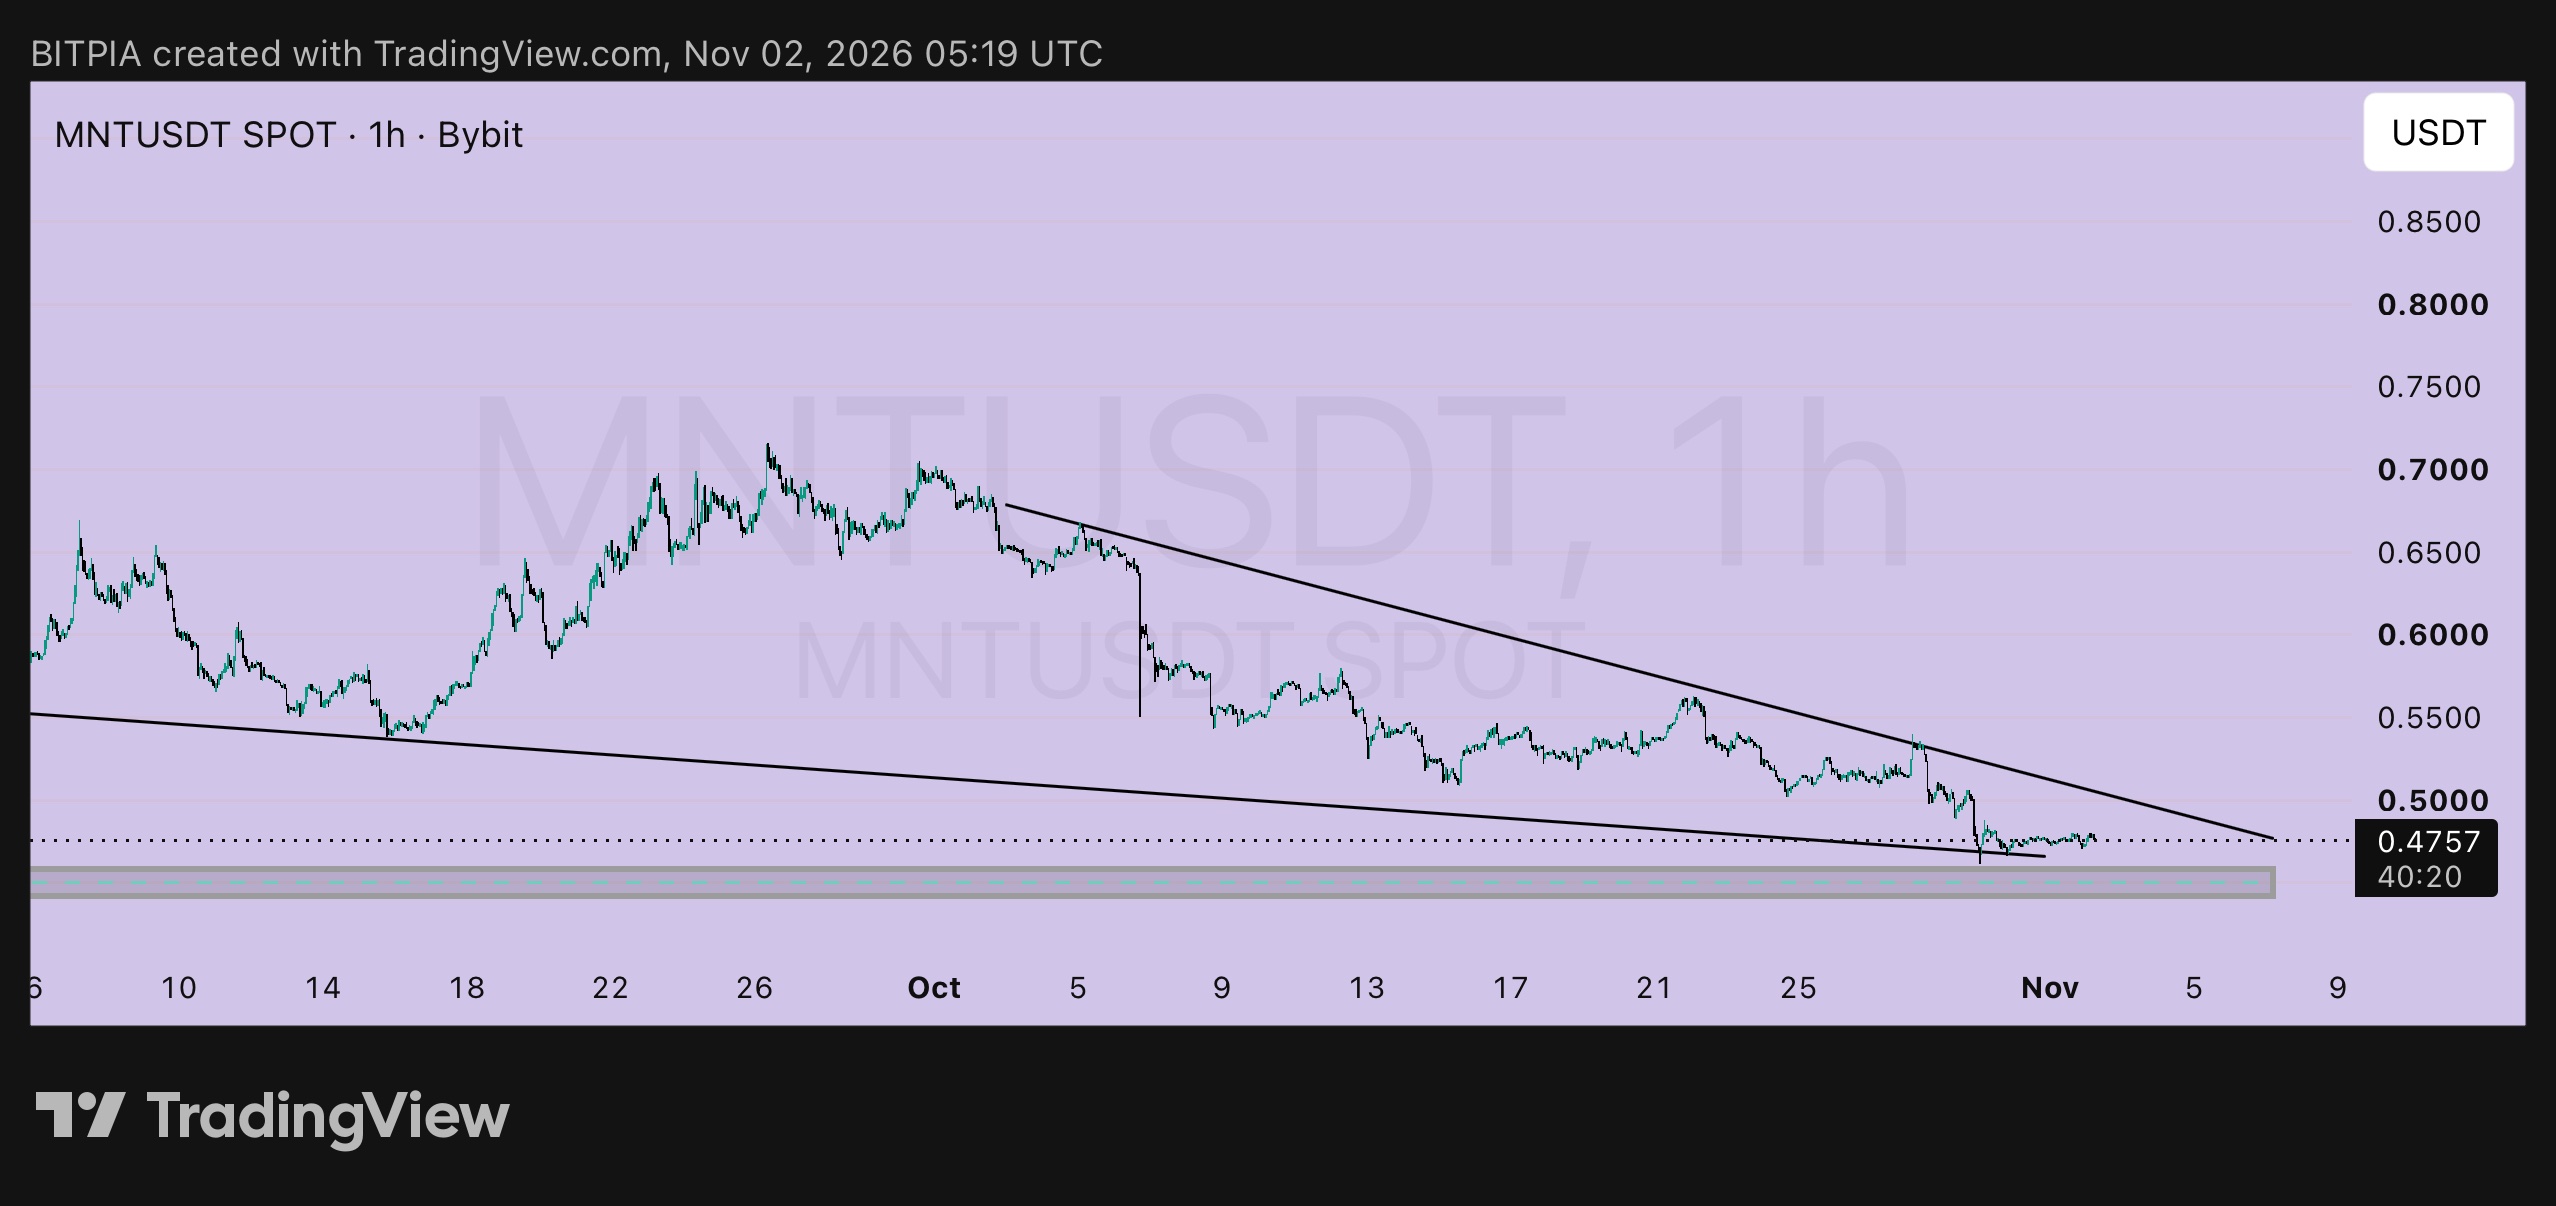
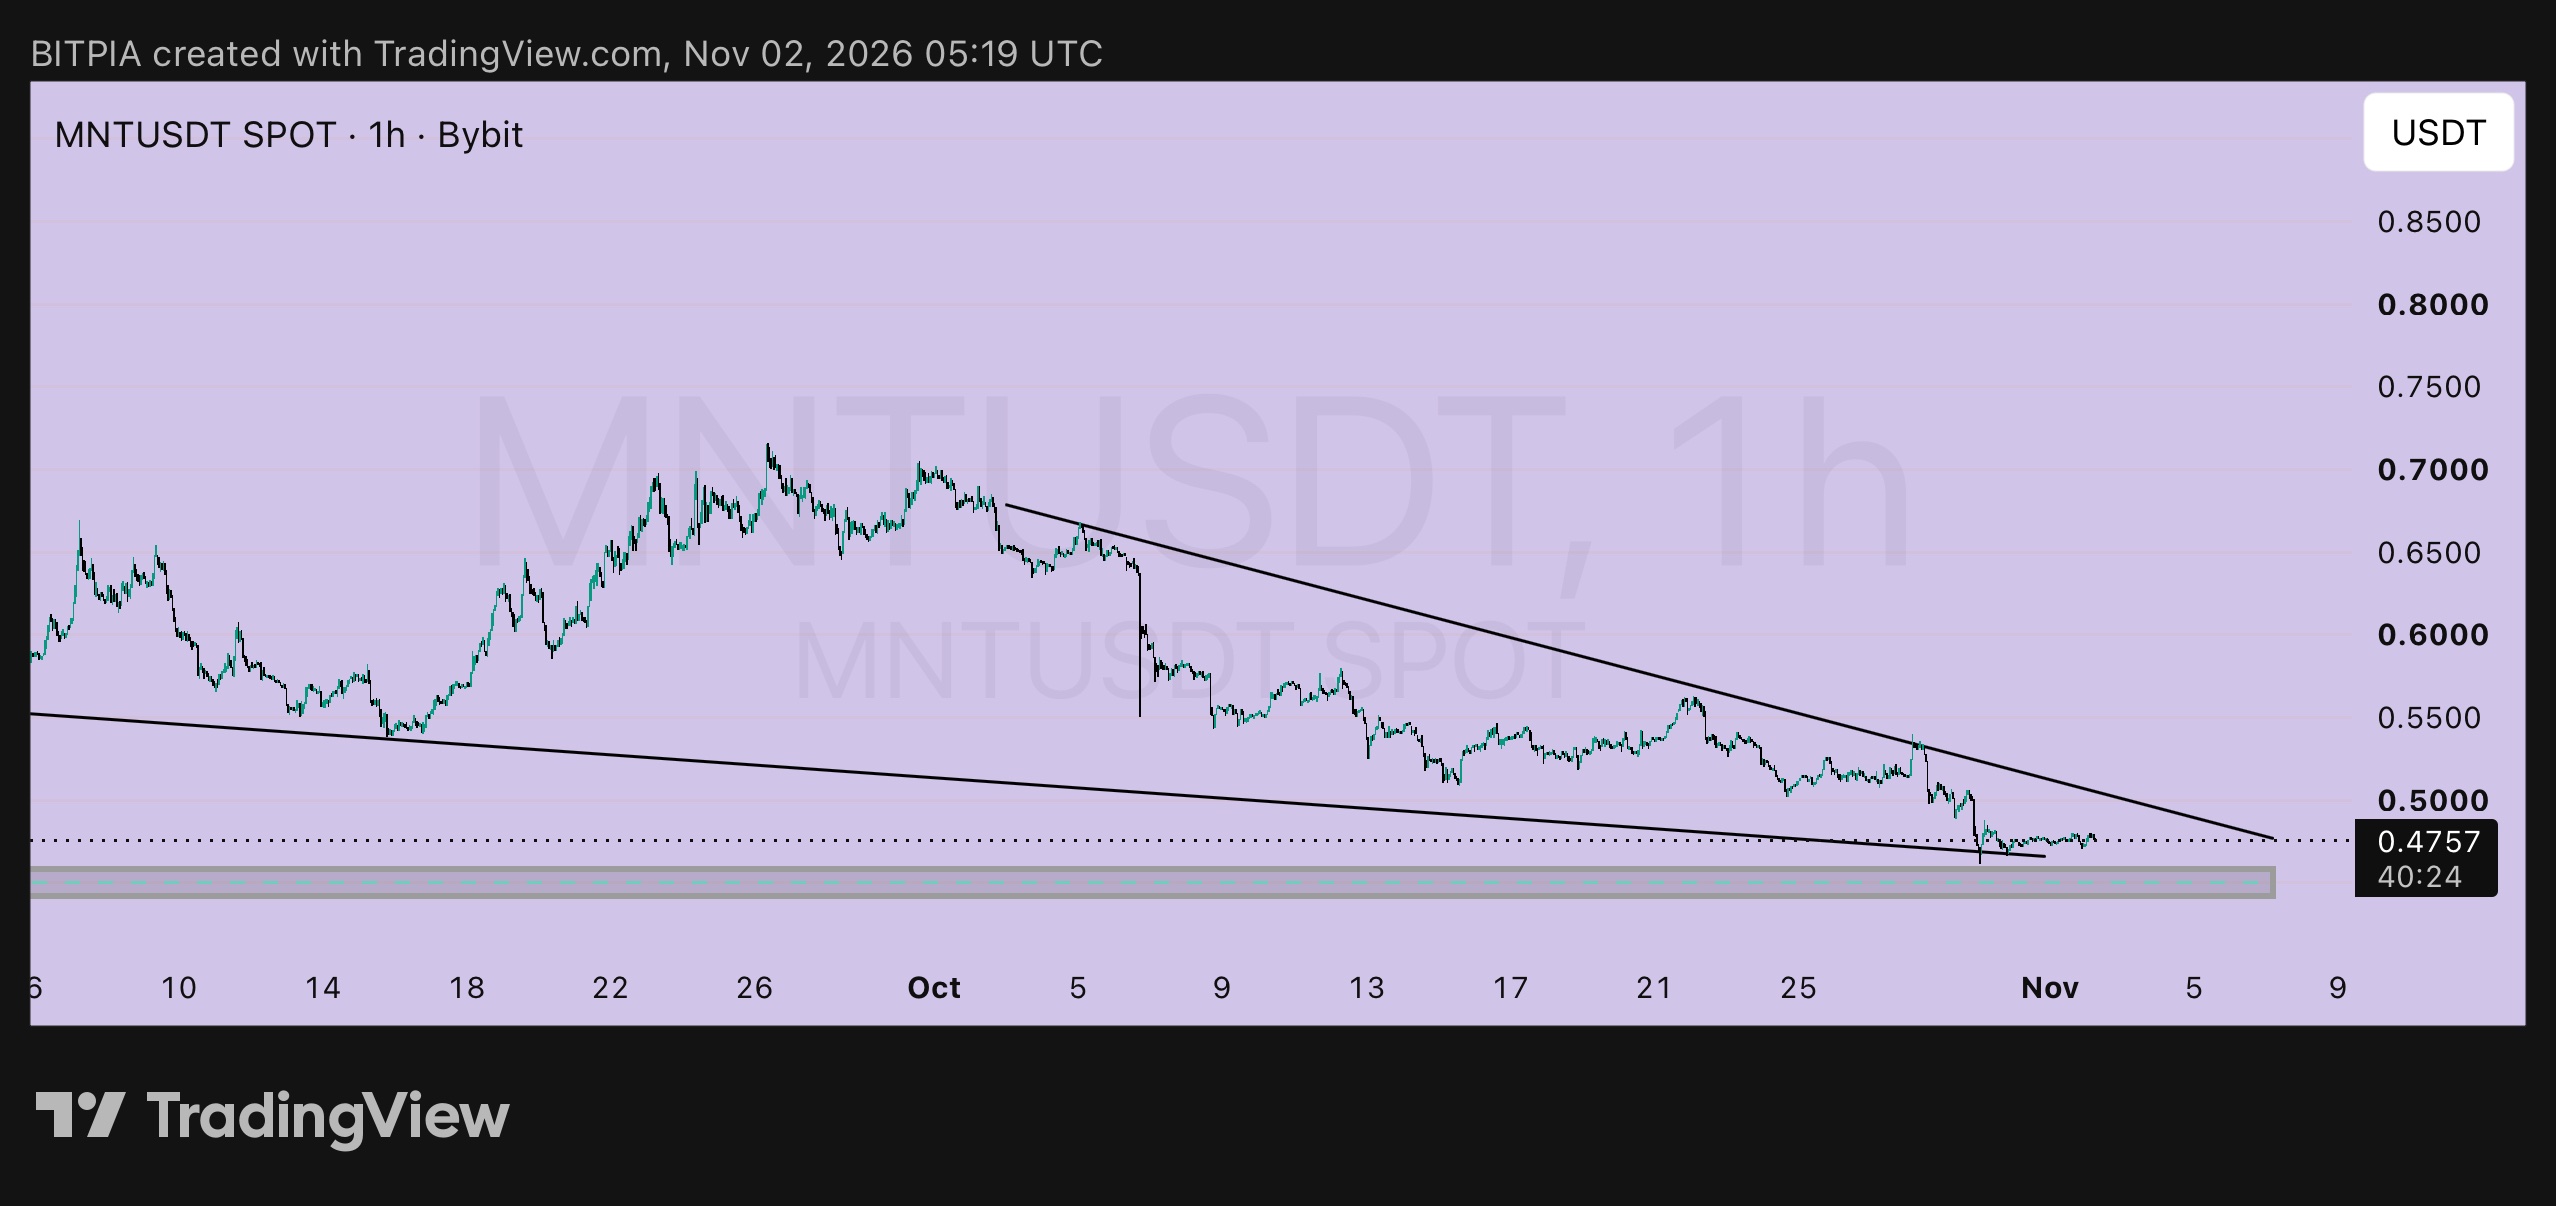
$MNTUSDT has spent three days going basically nowhere, and that's the interesting part. Since my Oct 31 post, price has moved from 0.4762 to 0.4757. That's it. The 1h candles have shrunk into a thin line sitting just under the upper wedge line, and the lower line is only a few ticks below. When a coin goes this quiet inside a falling wedge, the market is usually loading up for a move. It just doesn't say which way. What held The 0.461 wick low from Oct 31 hasn't been touched again, and my 0.440 invalidation is nowhere close. The idea is intact, but it hasn't done anything yet. What's tighter The upper line has slid down to roughly 0.485 to 0.490, so the breakout trigger is only about 2 to 3% above price. That's much closer than the 0.505 I mentioned on Oct 31. How I'd handle each outcome: ▸ Break up: a 1h close above 0.490, then a retest of that line that holds. First target 0.5235, then about 0.56. ▸ Break down: a 1h close below 0.461 puts the 0.445 to 0.463 support box in play. A 4h close below 0.440 means the wedge failed and I'm out. ▸ More chop: nothing to do. Quiet candles don't pay. Levels: ▸ Support: 0.445 to 0.463 ▸ Invalidation: a 4h close below 0.440 ▸ Wedge top: about 0.485 to 0.490 ▸ Resistance: 0.5235 to 0.526 ▸ Extension: about 0.56 The math, because this is where most people go wrong. Buying at 0.4757 with a stop at 0.438 risks about 7.9% to make about 10% at 0.5235, roughly 1.3 to 1. A dip toward 0.465 with the same stop risks about 5.8% for about 12.6% to 0.5235 or 20% to 0.56, closer to 2.2 to 1 and 3.5 to 1. A breakout retest near 0.488 with a stop at 0.468 risks about 4.1% for about 7% to 0.5235 or 15% to 0.56, around 1.7 to 1 and 3.6 to 1. I'm not forcing it. Monday's open can wake this thing up fast, so I'd rather wait for a close than guess the direction. Not financial advice, just how I'm reading it. DYOR and only risk what you can afford to lose. #ByXIMPACT #IMPACTbyTrade
Market dumps, everybody panics. Market pumps, everybody's a genius. 3 things that'll save you in this space: 1. Don't panic sell 2. HODL, and keep your own keys 3. DYOR before you ape in Not your keys, not your coins. Simple. Which one did you learn the hard way? $BTCUSDT #ByXIMPACT

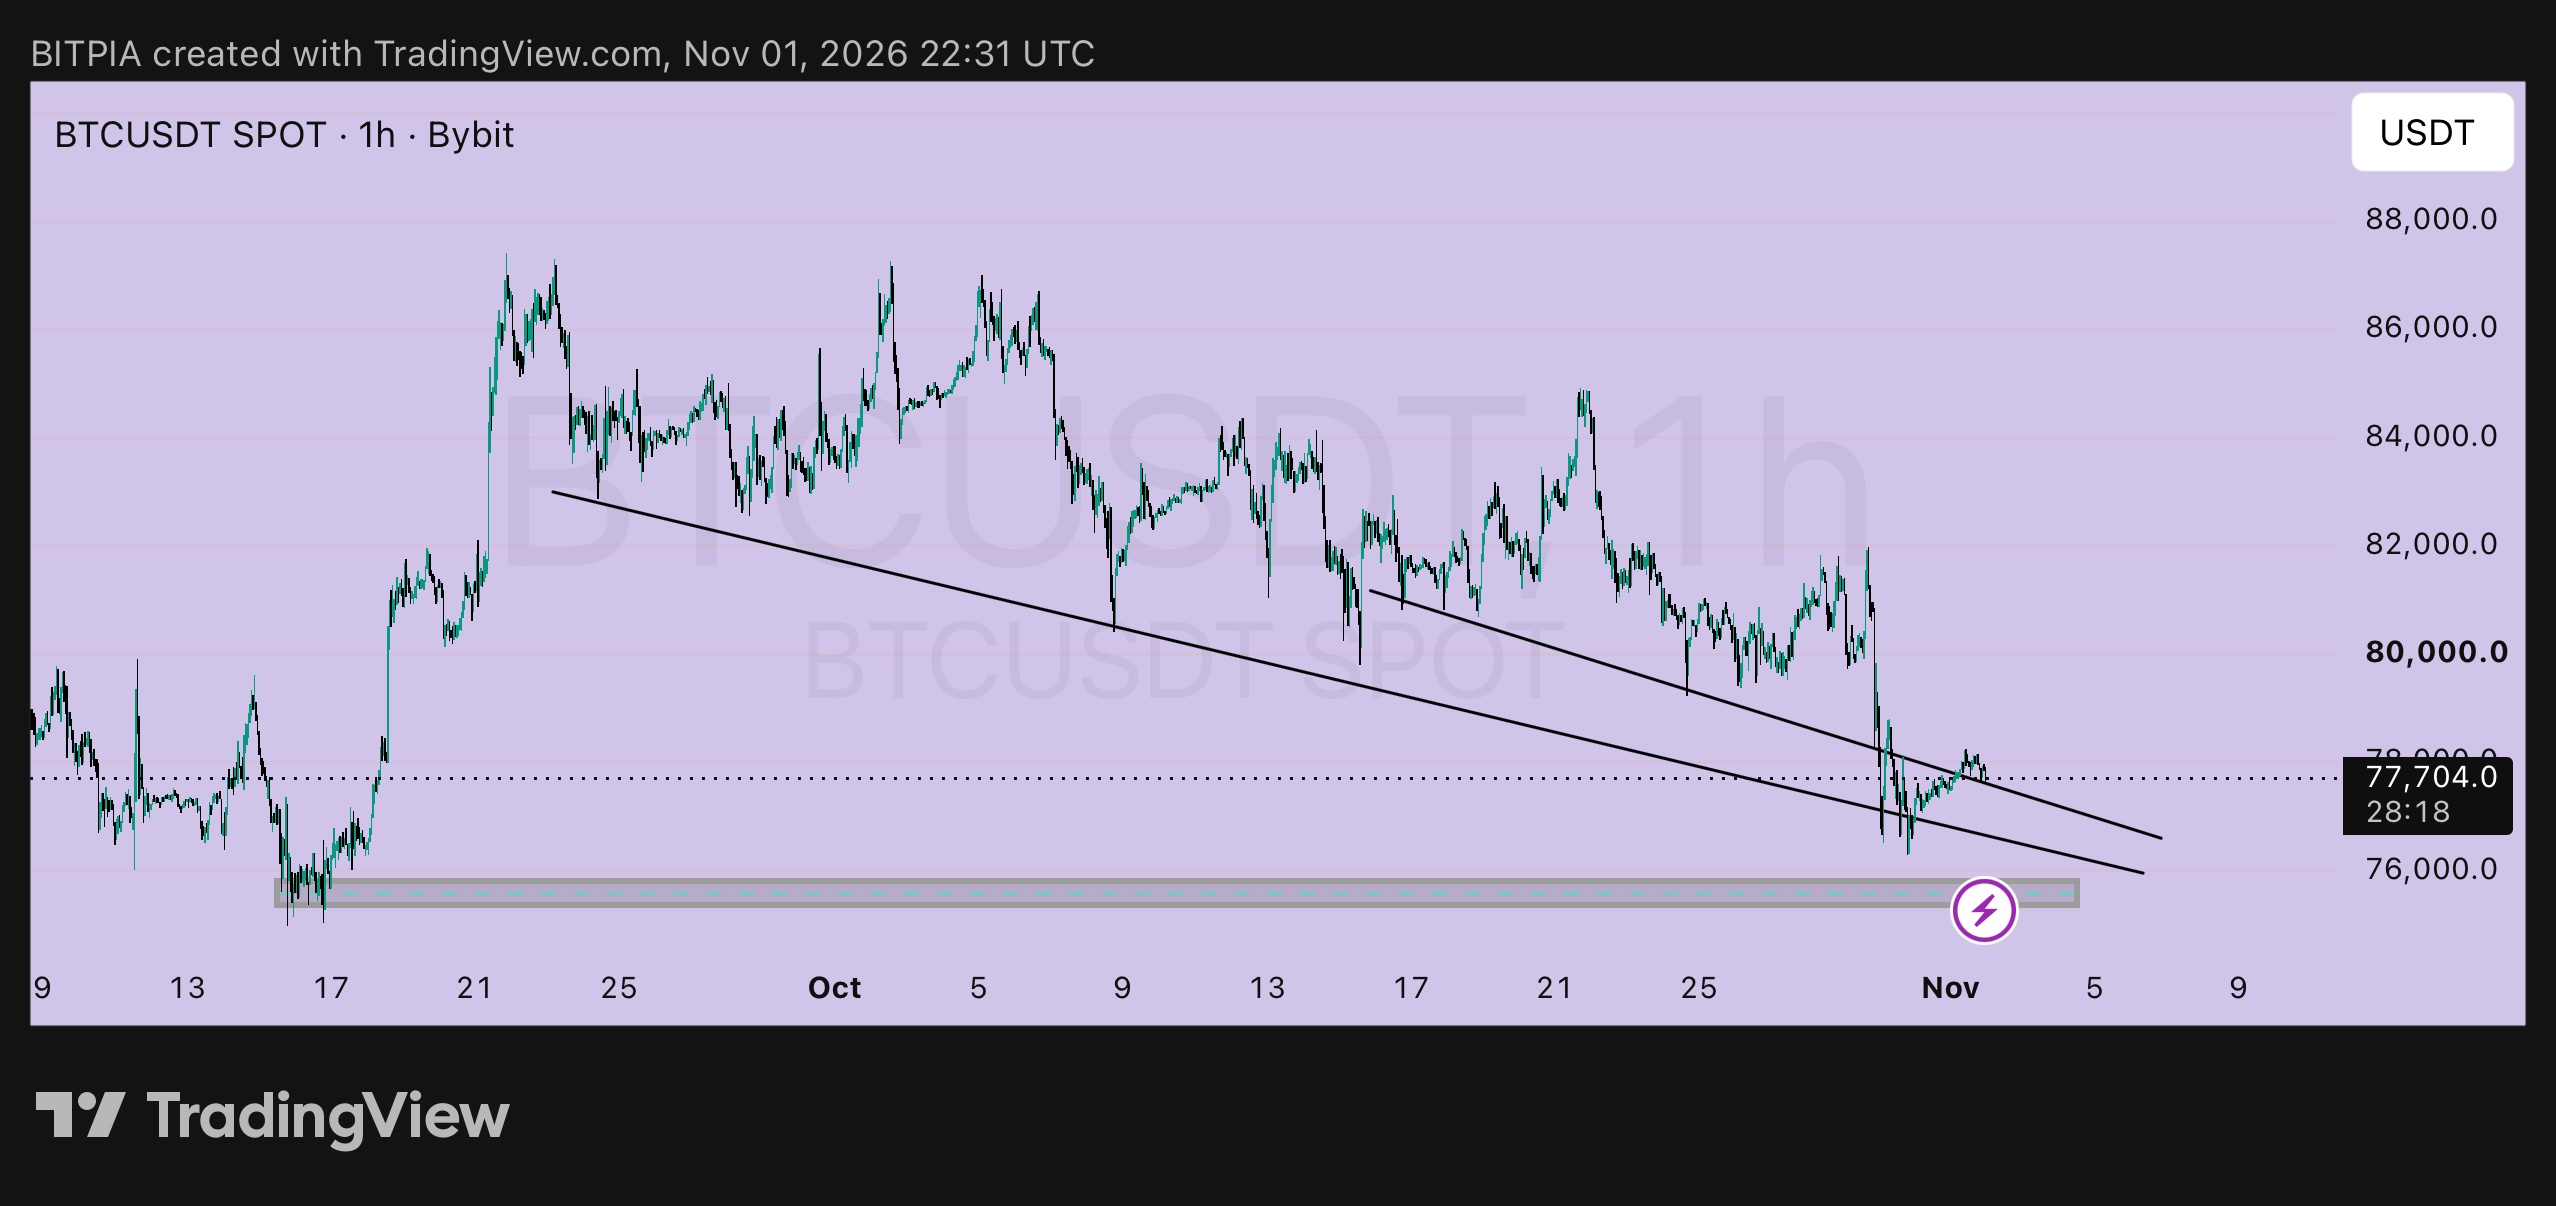
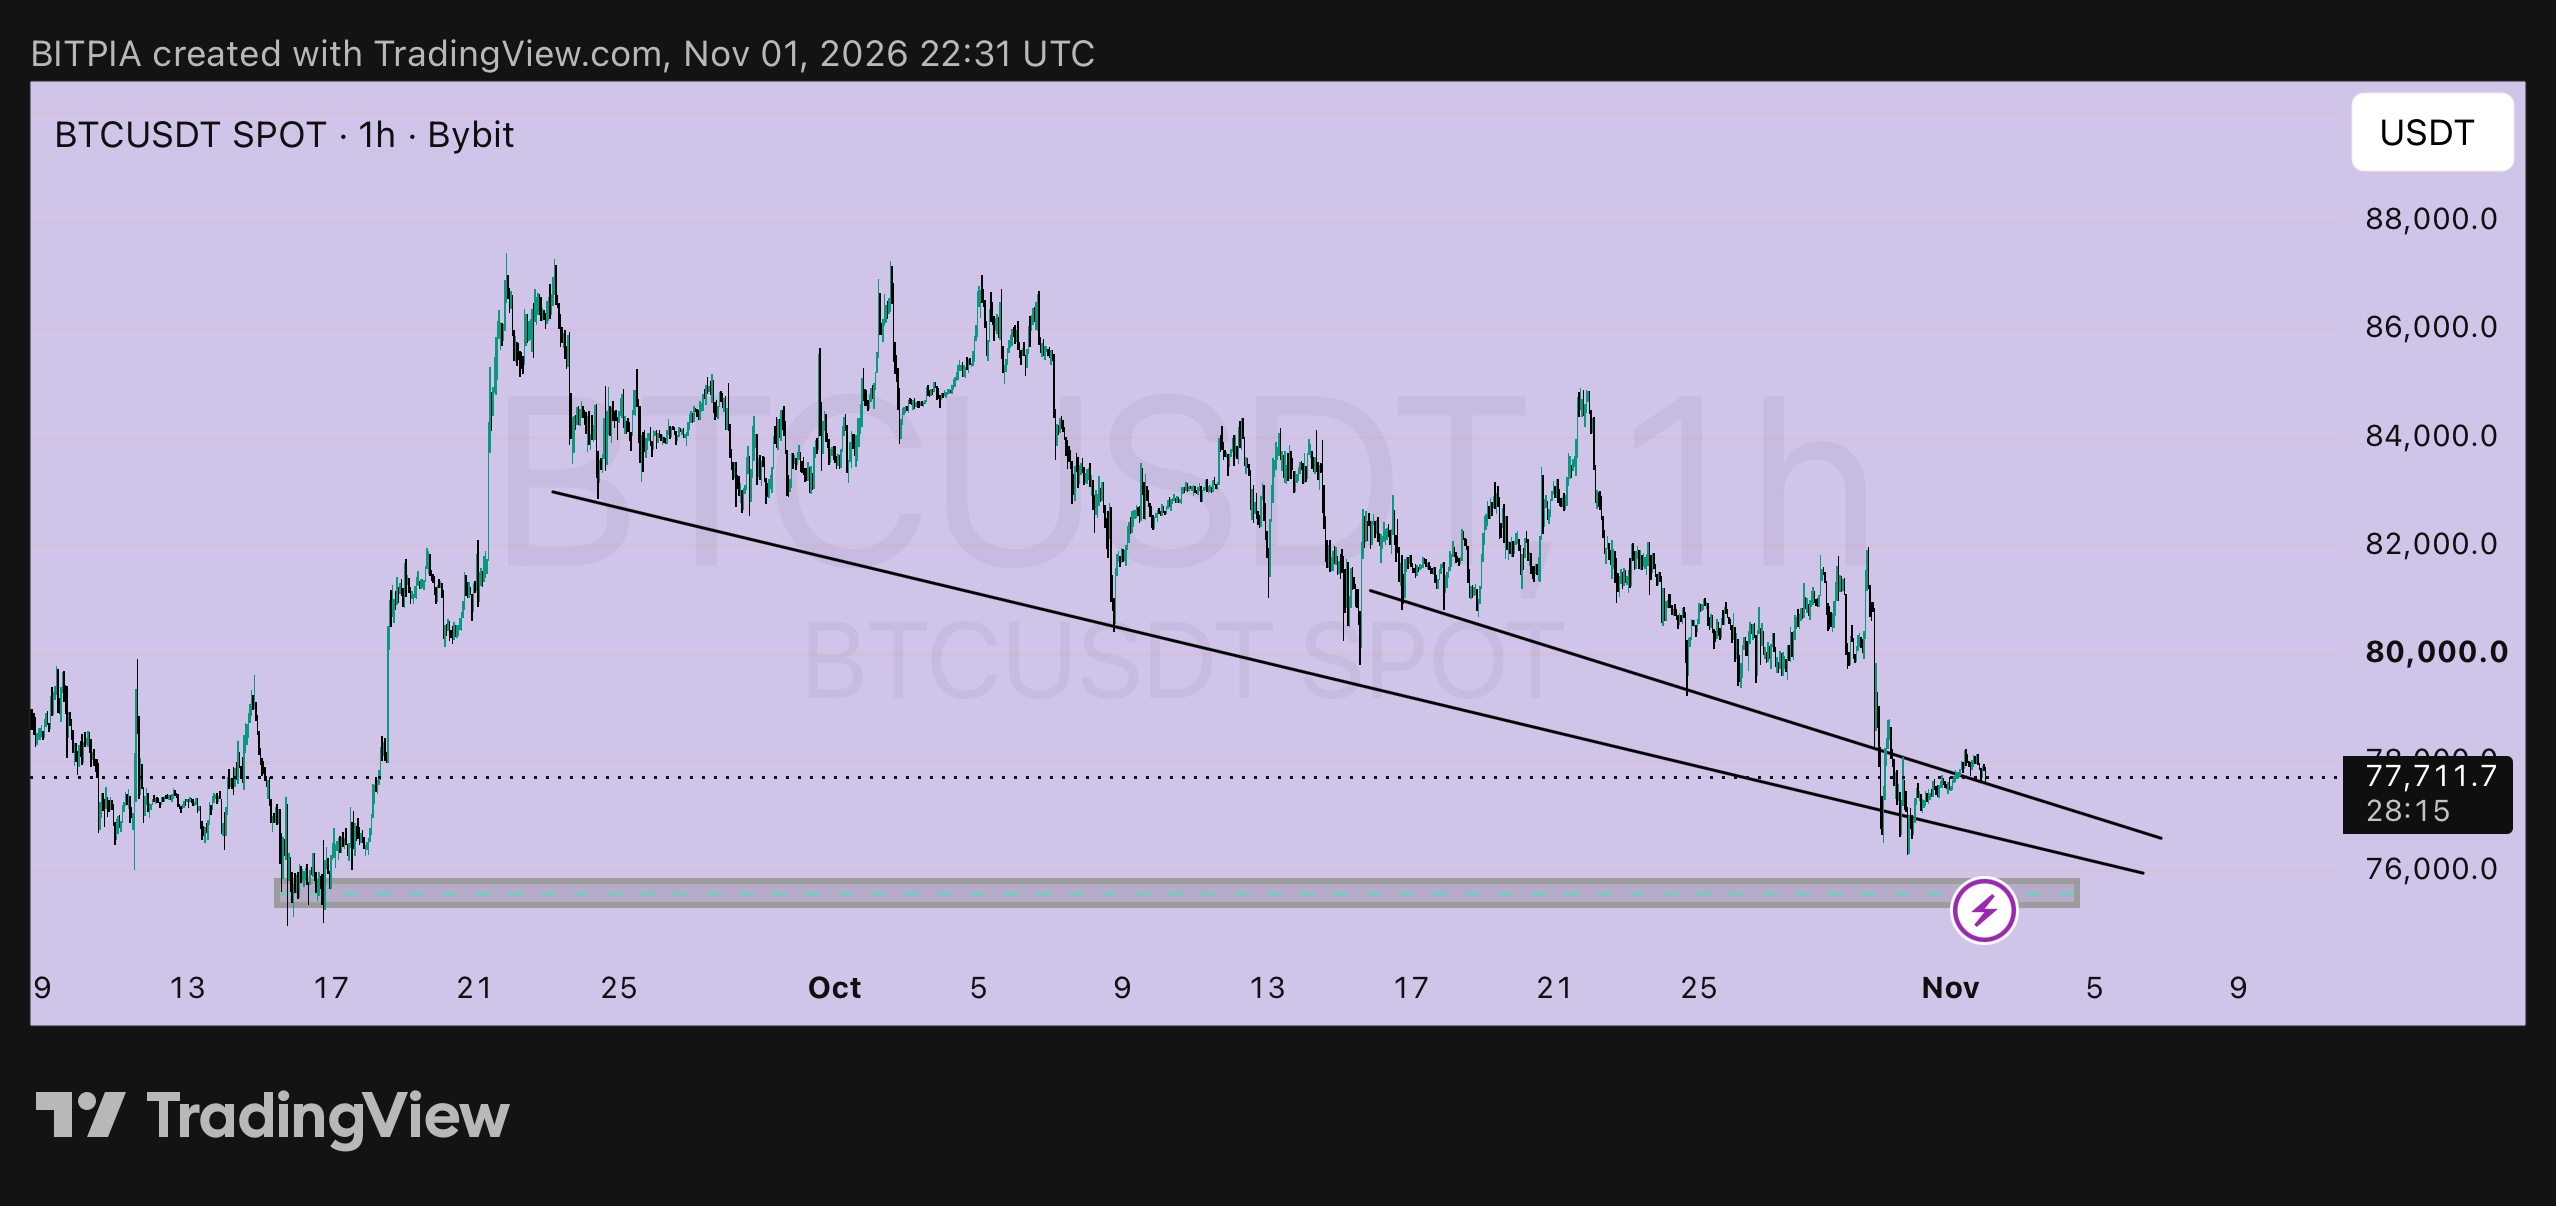
$BTCUSDT weekend close note, because this one is quieter than it looks. On Oct 30 I said I wasn't adding until BTC reclaimed 79,400, and that a close below 75,000 would make me step aside. Neither happened. Price wicked to about 76,250 twice, held well above my line, and is now at 77,711 after a slow grind up. What changed on the 1h chart: price just pushed above the shorter falling trendline, the one from the mid-October highs. It's only just through it, so this is a first step, not a trend change. The longer trendline from the Oct 22 high is still above price, and the whole structure is still lower highs and lower lows. What I like ➤ The 76,250 low held twice, so buyers are defending it ➤ The 75,200 to 76,000 zone sits right underneath as backup, and it's the Oct 17 low, so it has history ➤ The bounce has been steady instead of one panicky candle What I don't like ➤ No real volume behind the move, just a slow drift ➤ 79,400 is the level that broke on Oct 30, and it's still well overhead ➤ A Sunday night grind can flip fast when the week opens Levels ▸ Support: 76,000 to 76,250, then 75,200 ▸ Invalidation: a 1h close below 75,000 ▸ Reclaim level: 79,400 ▸ Resistance: 80,900, then 82,000 The numbers Buying now at 77,711 with a stop at 75,800 risks about 2.5% to make about 2.2% at 79,400, so under 1 to 1. Not interested. A retest of the broken line near 77,000 with the same stop risks about 1.6% for about 3.1% to 79,400 or about 6.5% to 82,000, roughly 2 to 1 and 4.2 to 1. Same chart, and the entry is where the edge lives. My plan: I'd wait for the week to open and see whether the line holds on a retest. A close above 79,400 would be the first real sign buyers are back. Until then it's a bounce, and bounces in downtrends fail more often than they run. If you're on a perp, keep leverage low, because gaps around the weekly open are real. Not financial advice, just how I'm reading it. DYOR and only risk what you can afford to lose. #ByXIMPACT #IMPACTbyTrade
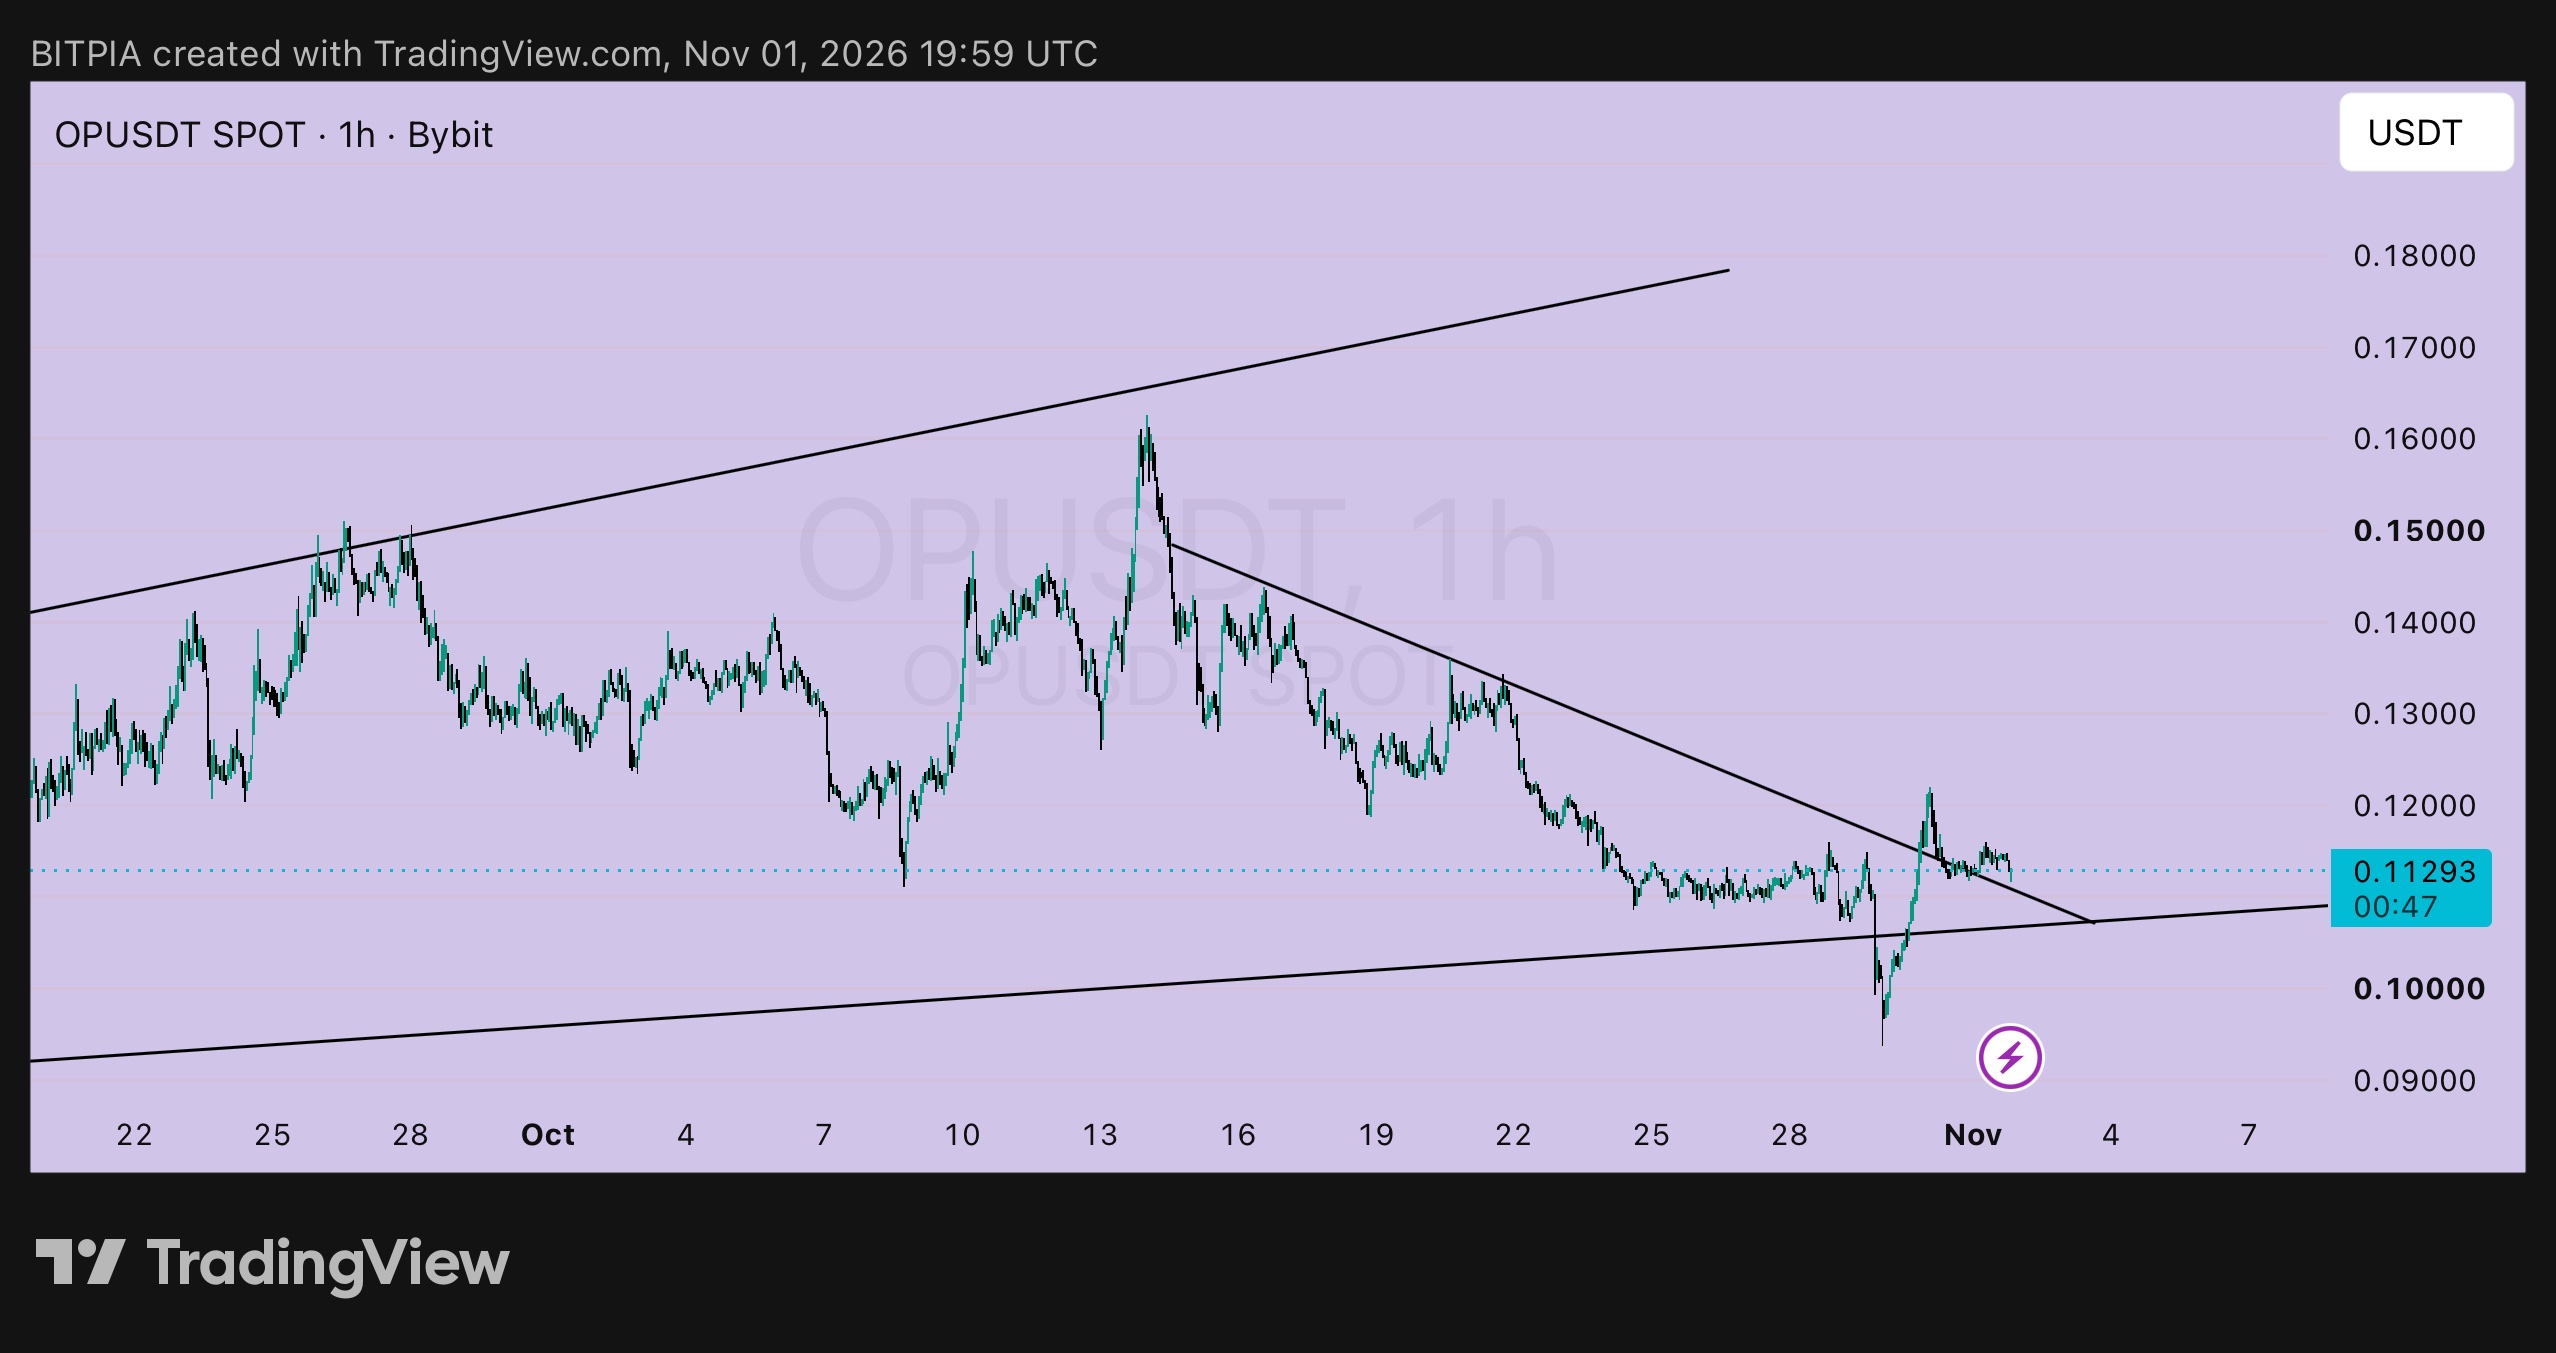
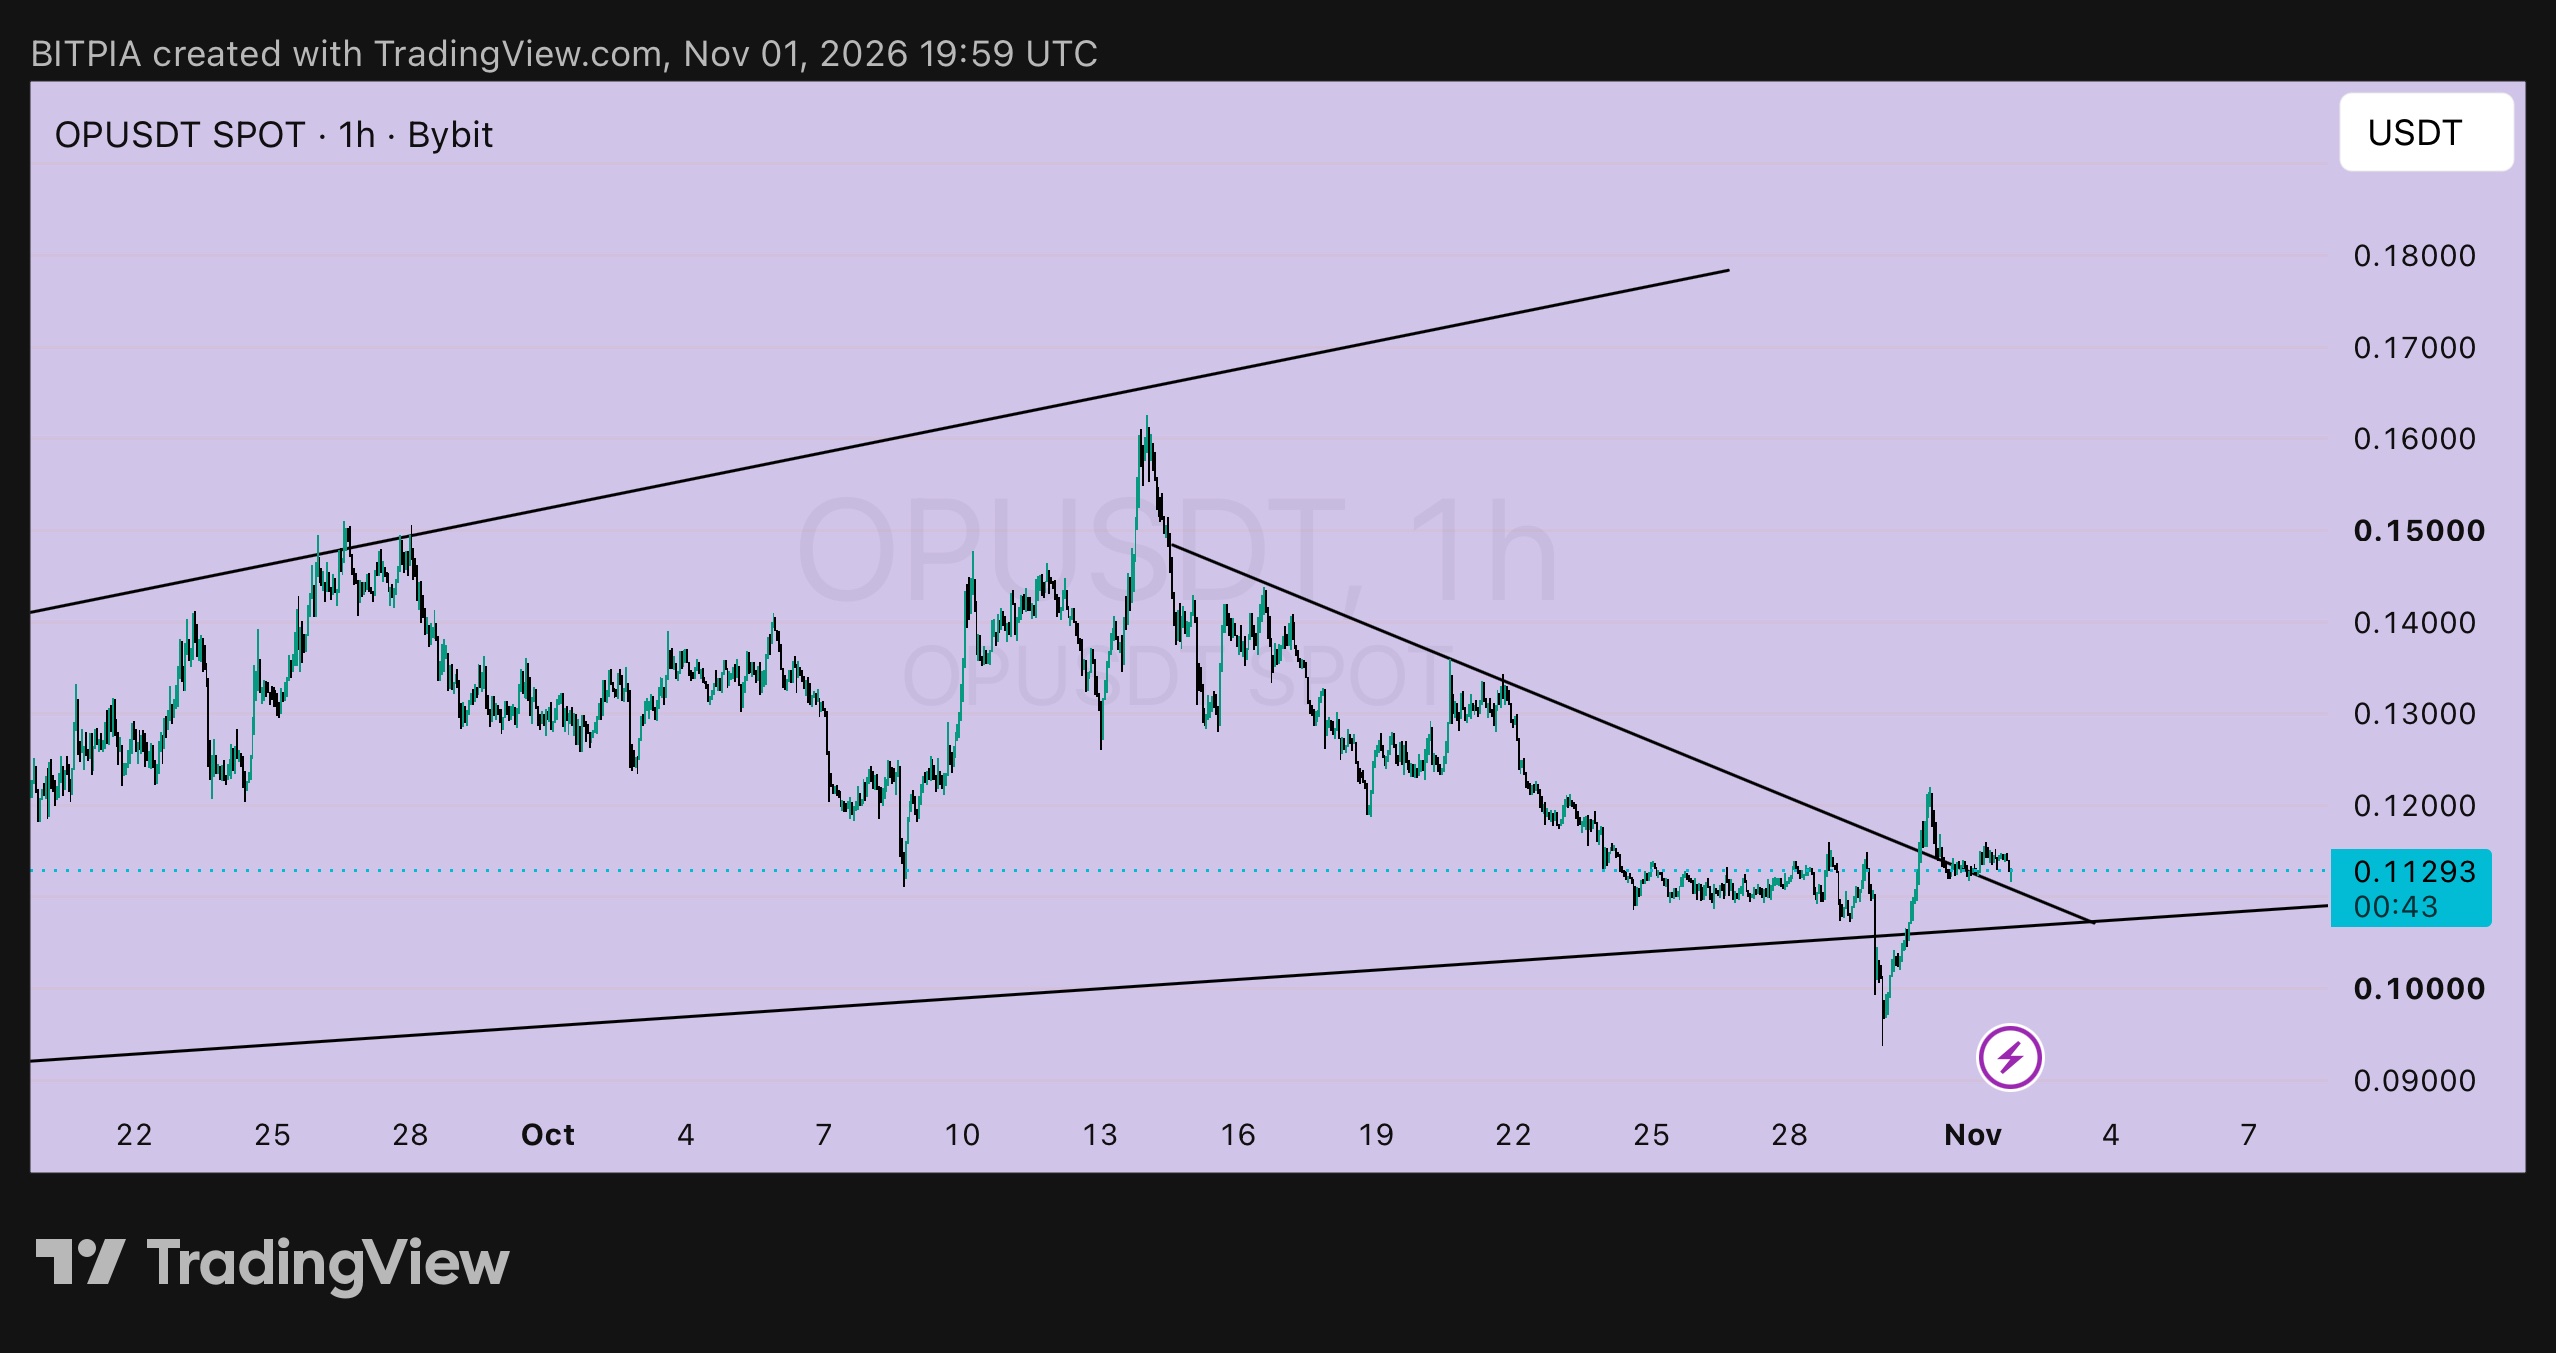
$OPUSDT has three lines on the chart that matter right now, and each one tells you something different. Line 1: the big floor The long rising line along the bottom has been holding since September. OP wicked under it to about 0.0935 on Oct 30 and was bought straight back, so the floor passed a hard test. Spending a few hours below a line and then closing back above it is usually a good sign, not a bad one. Line 2: the falling trendline This is the short one from the 0.162 high on Oct 14, and it capped every bounce for two weeks. This weekend price pushed through it, spiked to about 0.1225, and has since drifted back down to 0.11293, right on top of the line. That's a retest, and it's happening now. Line 3: the ceiling at 0.1225 That spike high is the first thing buyers need to take out. Above it, there are sellers waiting at 0.130 to 0.136, where the Oct 21 and 22 bounces failed. Levels I'm watching: ▸ Retest zone: 0.1100 to 0.1130, the broken line and the old range floor ▸ Invalidation: a 1h close below 0.1045 ▸ First resistance: 0.1225 ▸ Next: 0.130 to 0.136, then 0.1435 ▸ Big picture ceiling: 0.162 What the numbers say Buying right here at 0.1129 with a stop at 0.1045 risks about 7.4% to make about 8.5% at 0.1225. That's roughly 1 to 1, which isn't worth my time. If price dips to 0.1105 and holds, the same stop risks about 5.4% for about 18% to 0.1305 or about 23% to 0.136. That's roughly 3.3 to 1 and 4.2 to 1. Same chart, and the entry is the whole edge. What I'm doing Watching the retest. If a 1h candle holds the line and closes back above 0.1130, I'd start a small position. If price closes under 0.1045, the breakout failed and I'm out. And if it runs without me, I'd rather miss it than buy the top of a spike. OP can wick hard on low volume, so keep size small and put your stop beyond the wicks, not on top of them. Not financial advice, just how I'm reading it. DYOR and only risk what you can afford to lose. #ByXIMPACT #IMPACTbyTrade
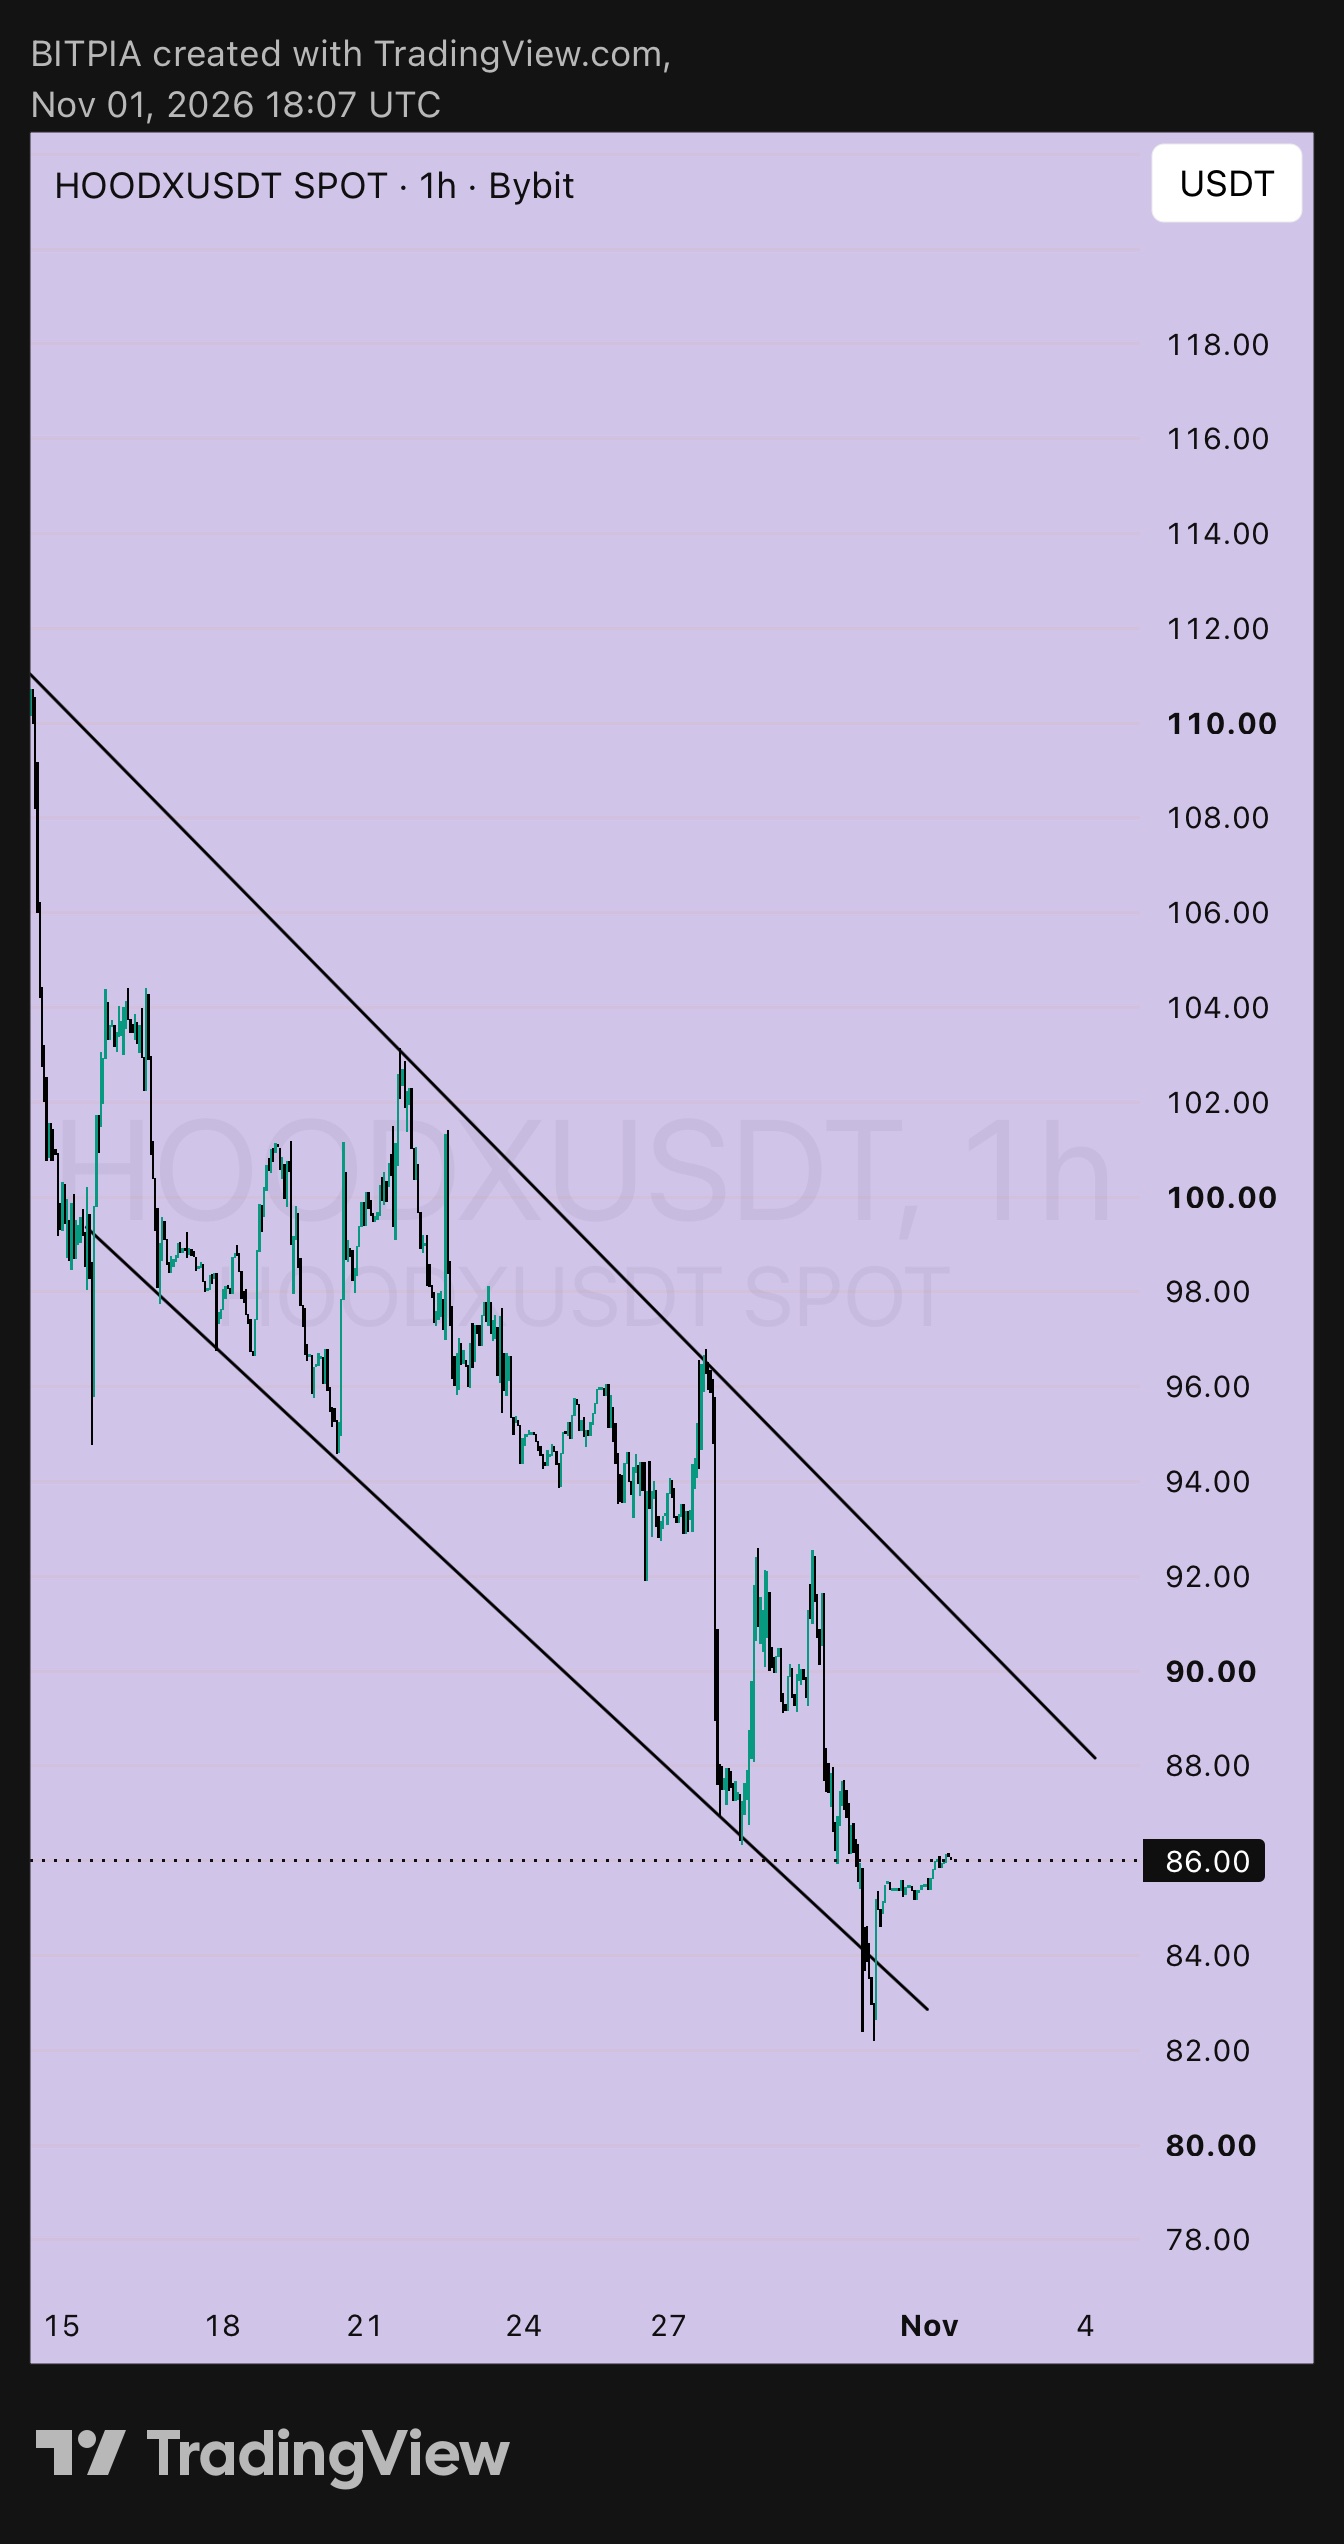
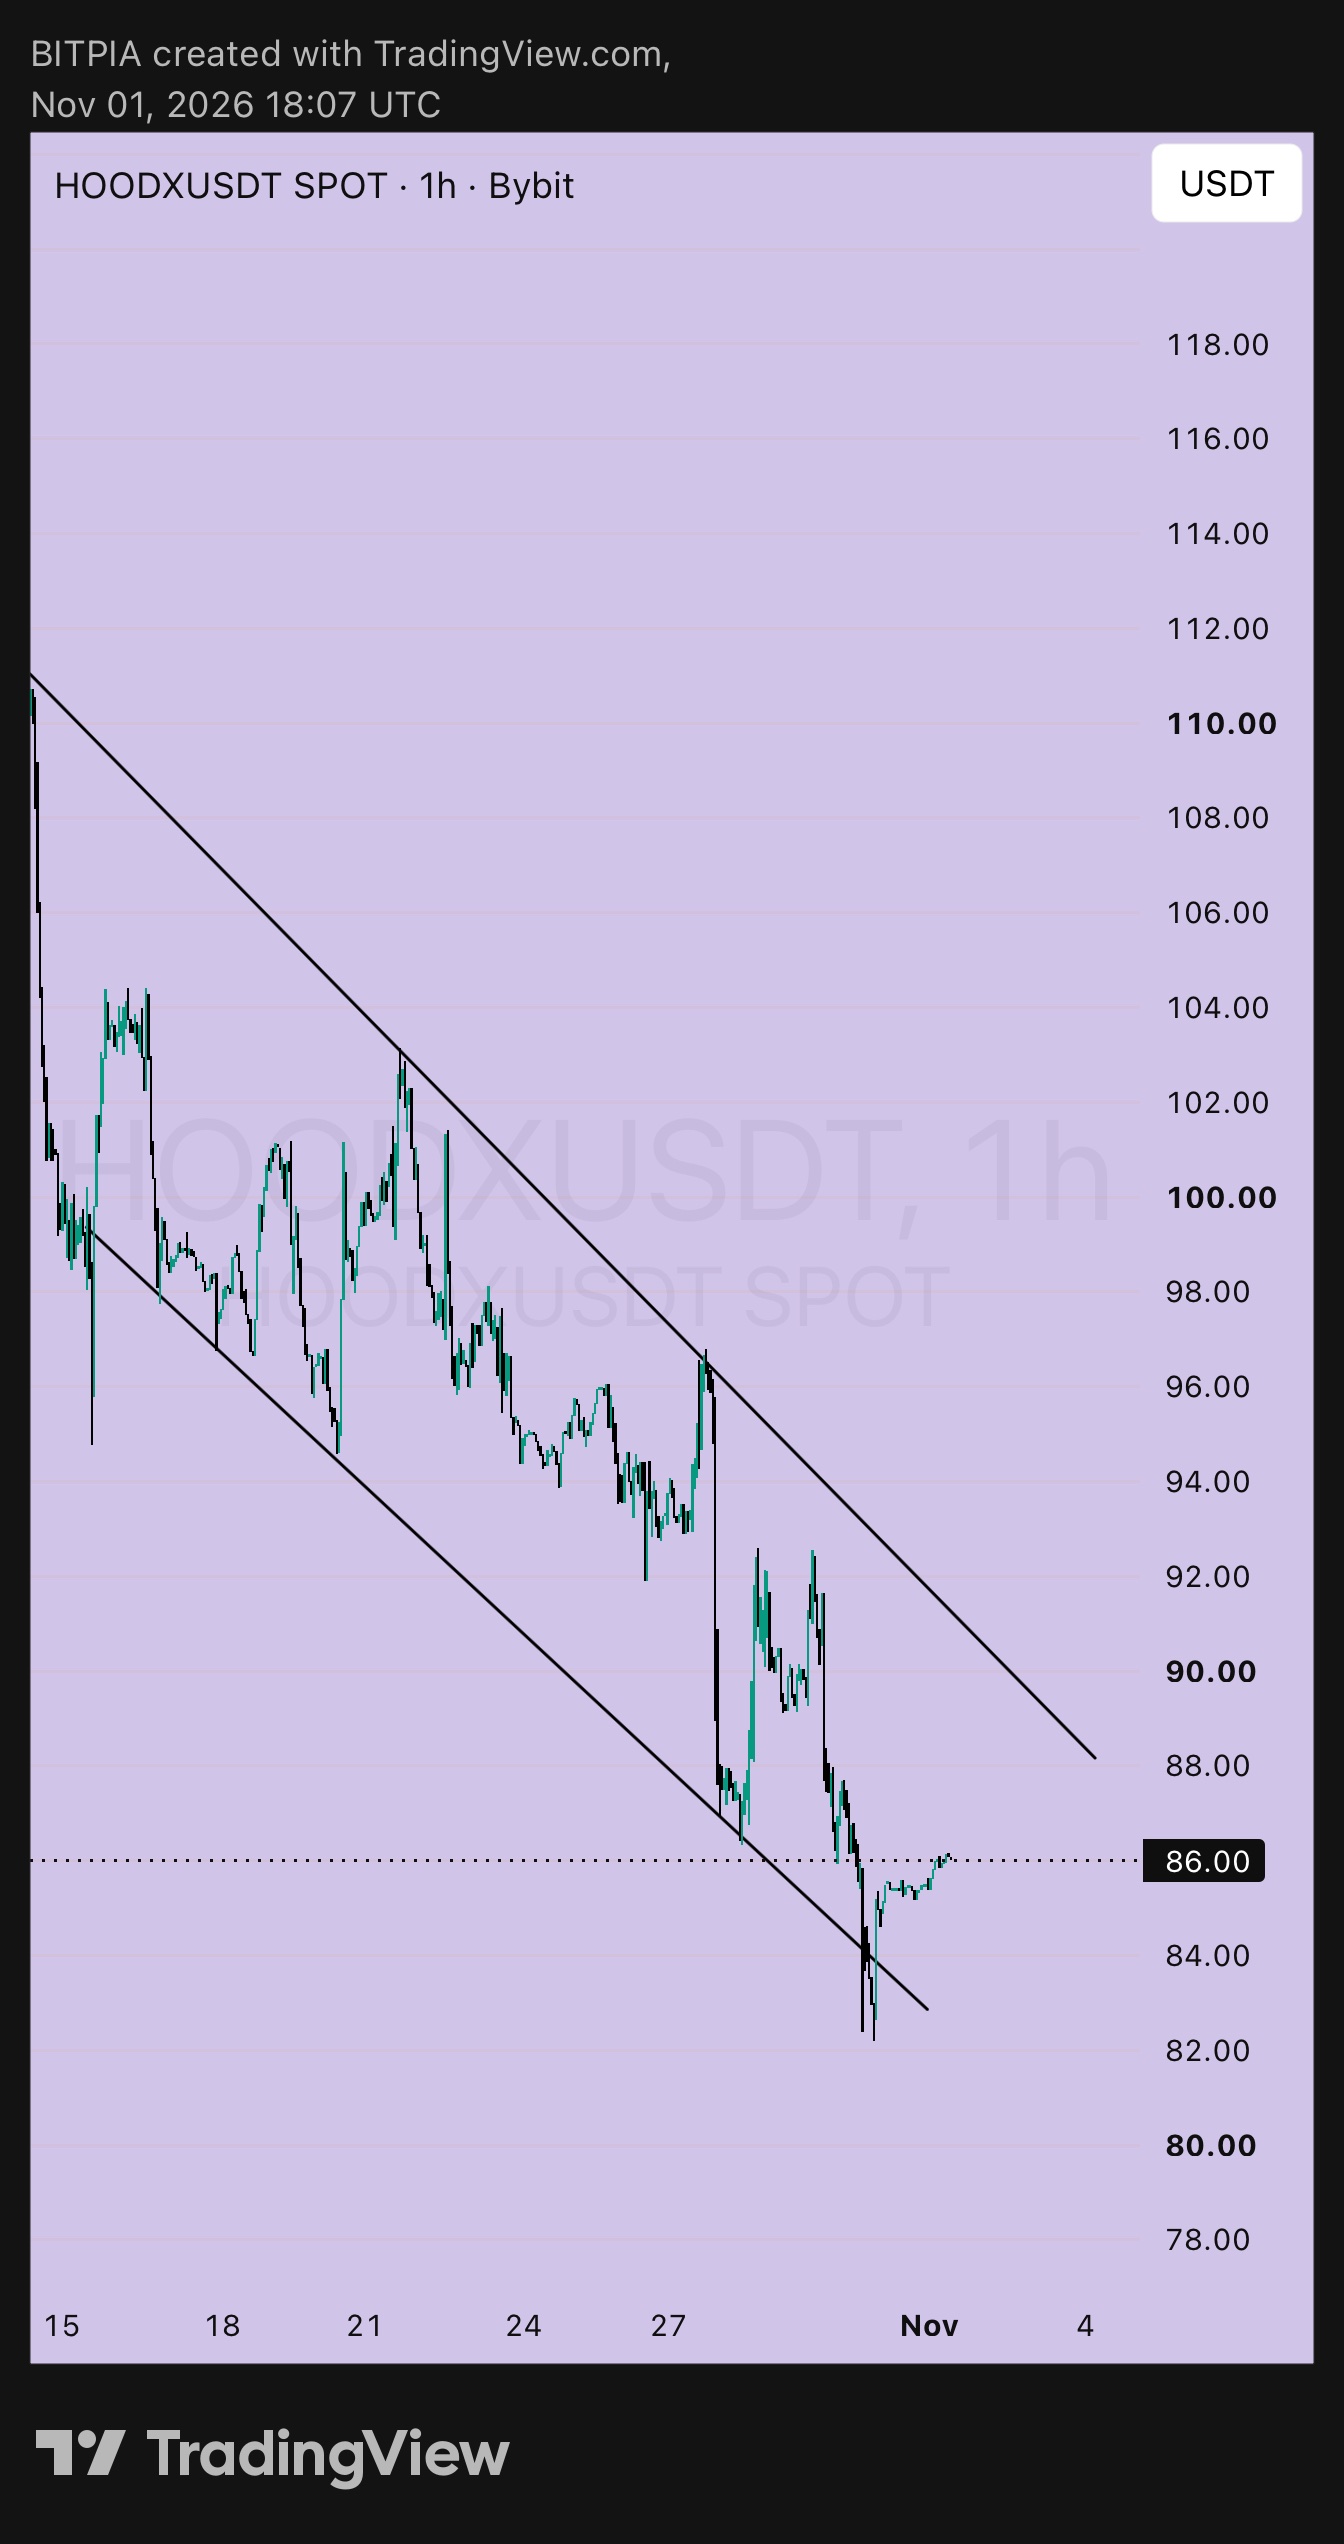
$HOODXUSDT did exactly what I said was the good case on Oct 30, and it's now sitting on the level that decides what happens next. Here's the timeline since my last post: ▸ Oct 30: price was 83.87, slightly under the channel's lower line. I said a 1h close back above 85.5 to 86 would turn it into a washout, and a close under 82 would be a real breakdown. ▸ Last 24 hours: price wicked to about 82.2, which is right at the lower channel line, and never closed below 82. Buyers stepped in almost immediately. ▸ Now: price is 86.00, back inside the channel, with small higher lows building since the wick. So the breakdown didn't confirm. It's still a downtrend, though. The channel is intact, the highs keep stepping down (96.8, then 92.5), and 86 is only the first reclaim, not a trend change. Levels: ▸ Support: 82.2 to 83, the wick low and lower channel line ▸ Invalidation: a 1h close below 82 ▸ Right now: 85.5 to 86, the reclaim zone ▸ Resistance: 88 to 88.5, then 92.5 ▸ Channel top: about 91, which keeps sliding lower How I'd trade it: ➤ Buying here at 86.00 with a stop at 81.8 risks about 4.9% to gain about 6.2% at 91.3. That's roughly 1.3 to 1, which I'll pass on. ➤ A dip toward 84.5 with the same stop risks about 3.2% for about 8% to 91.3 or about 9.5% to 92.5. That's roughly 2.5 to 1 and 3 to 1. ➤ A breakout entry on a 1h close above 88.5 and a retest that holds, stop at 86, risks about 2.8% for about 9% to 96.5, close to 3.2 to 1. What's still bugging me is that every bounce in this channel has died at the upper line. Until that line breaks, I treat rallies as chances to sell or wait, not to chase. HOODX tracks a stock, so it can gap around US market open and close. Keep your size small and your stop honest. Not financial advice, just how I'm reading it. DYOR and only risk what you can afford to lose. #IMPACTbyTrade #WSOT2026 #ByXIMPACT
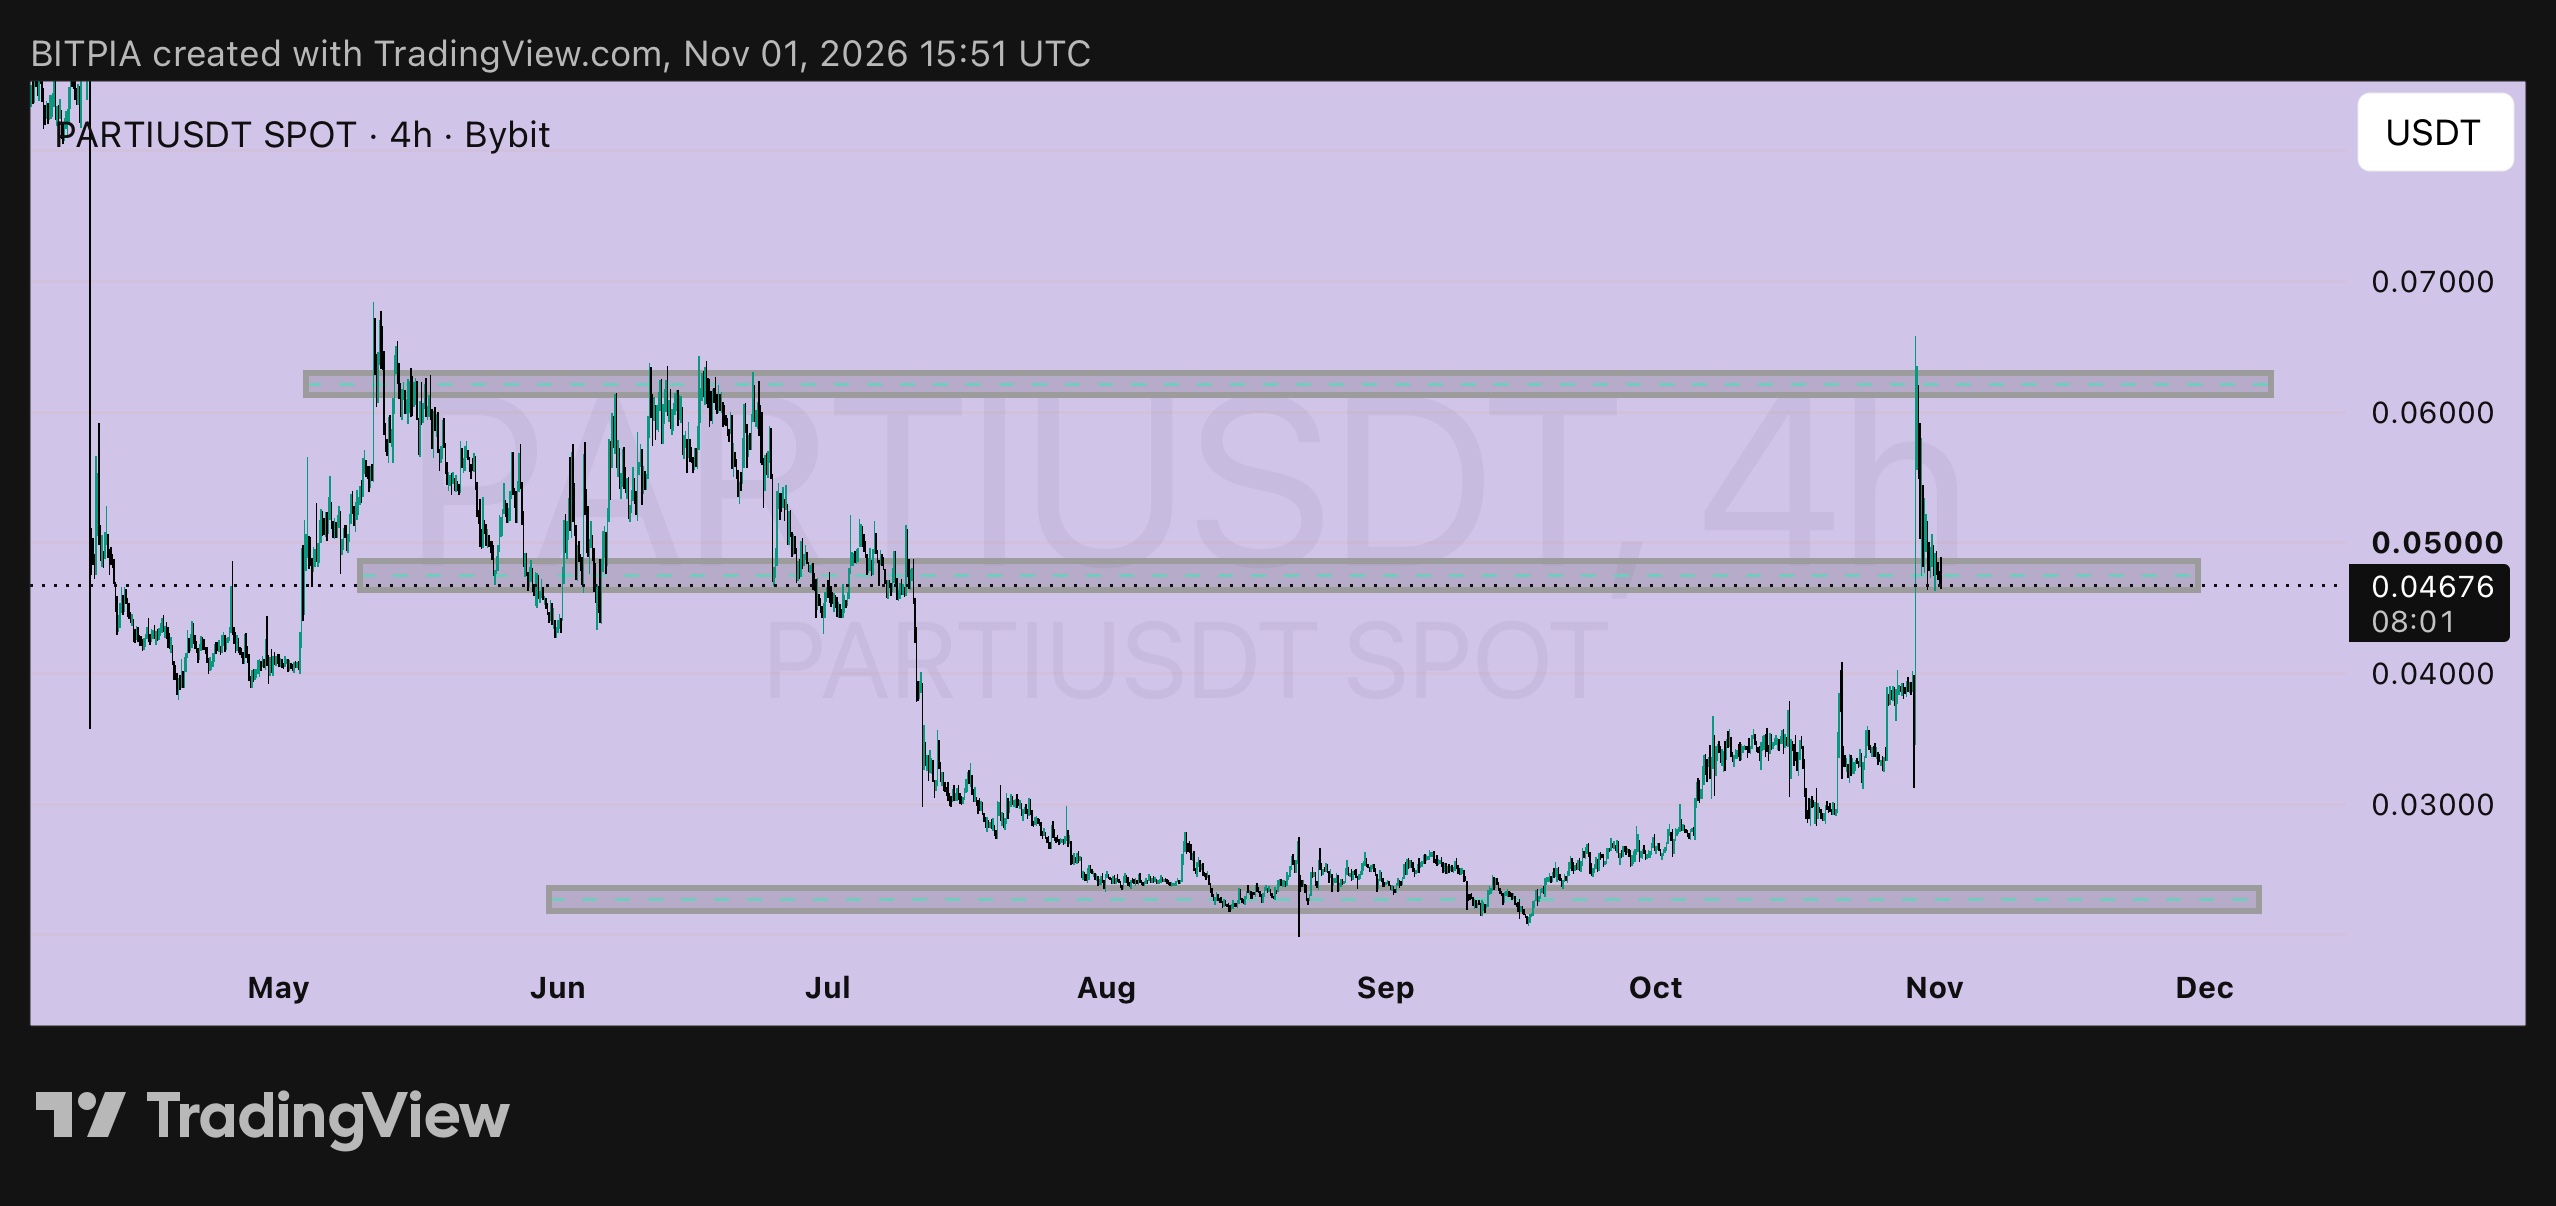
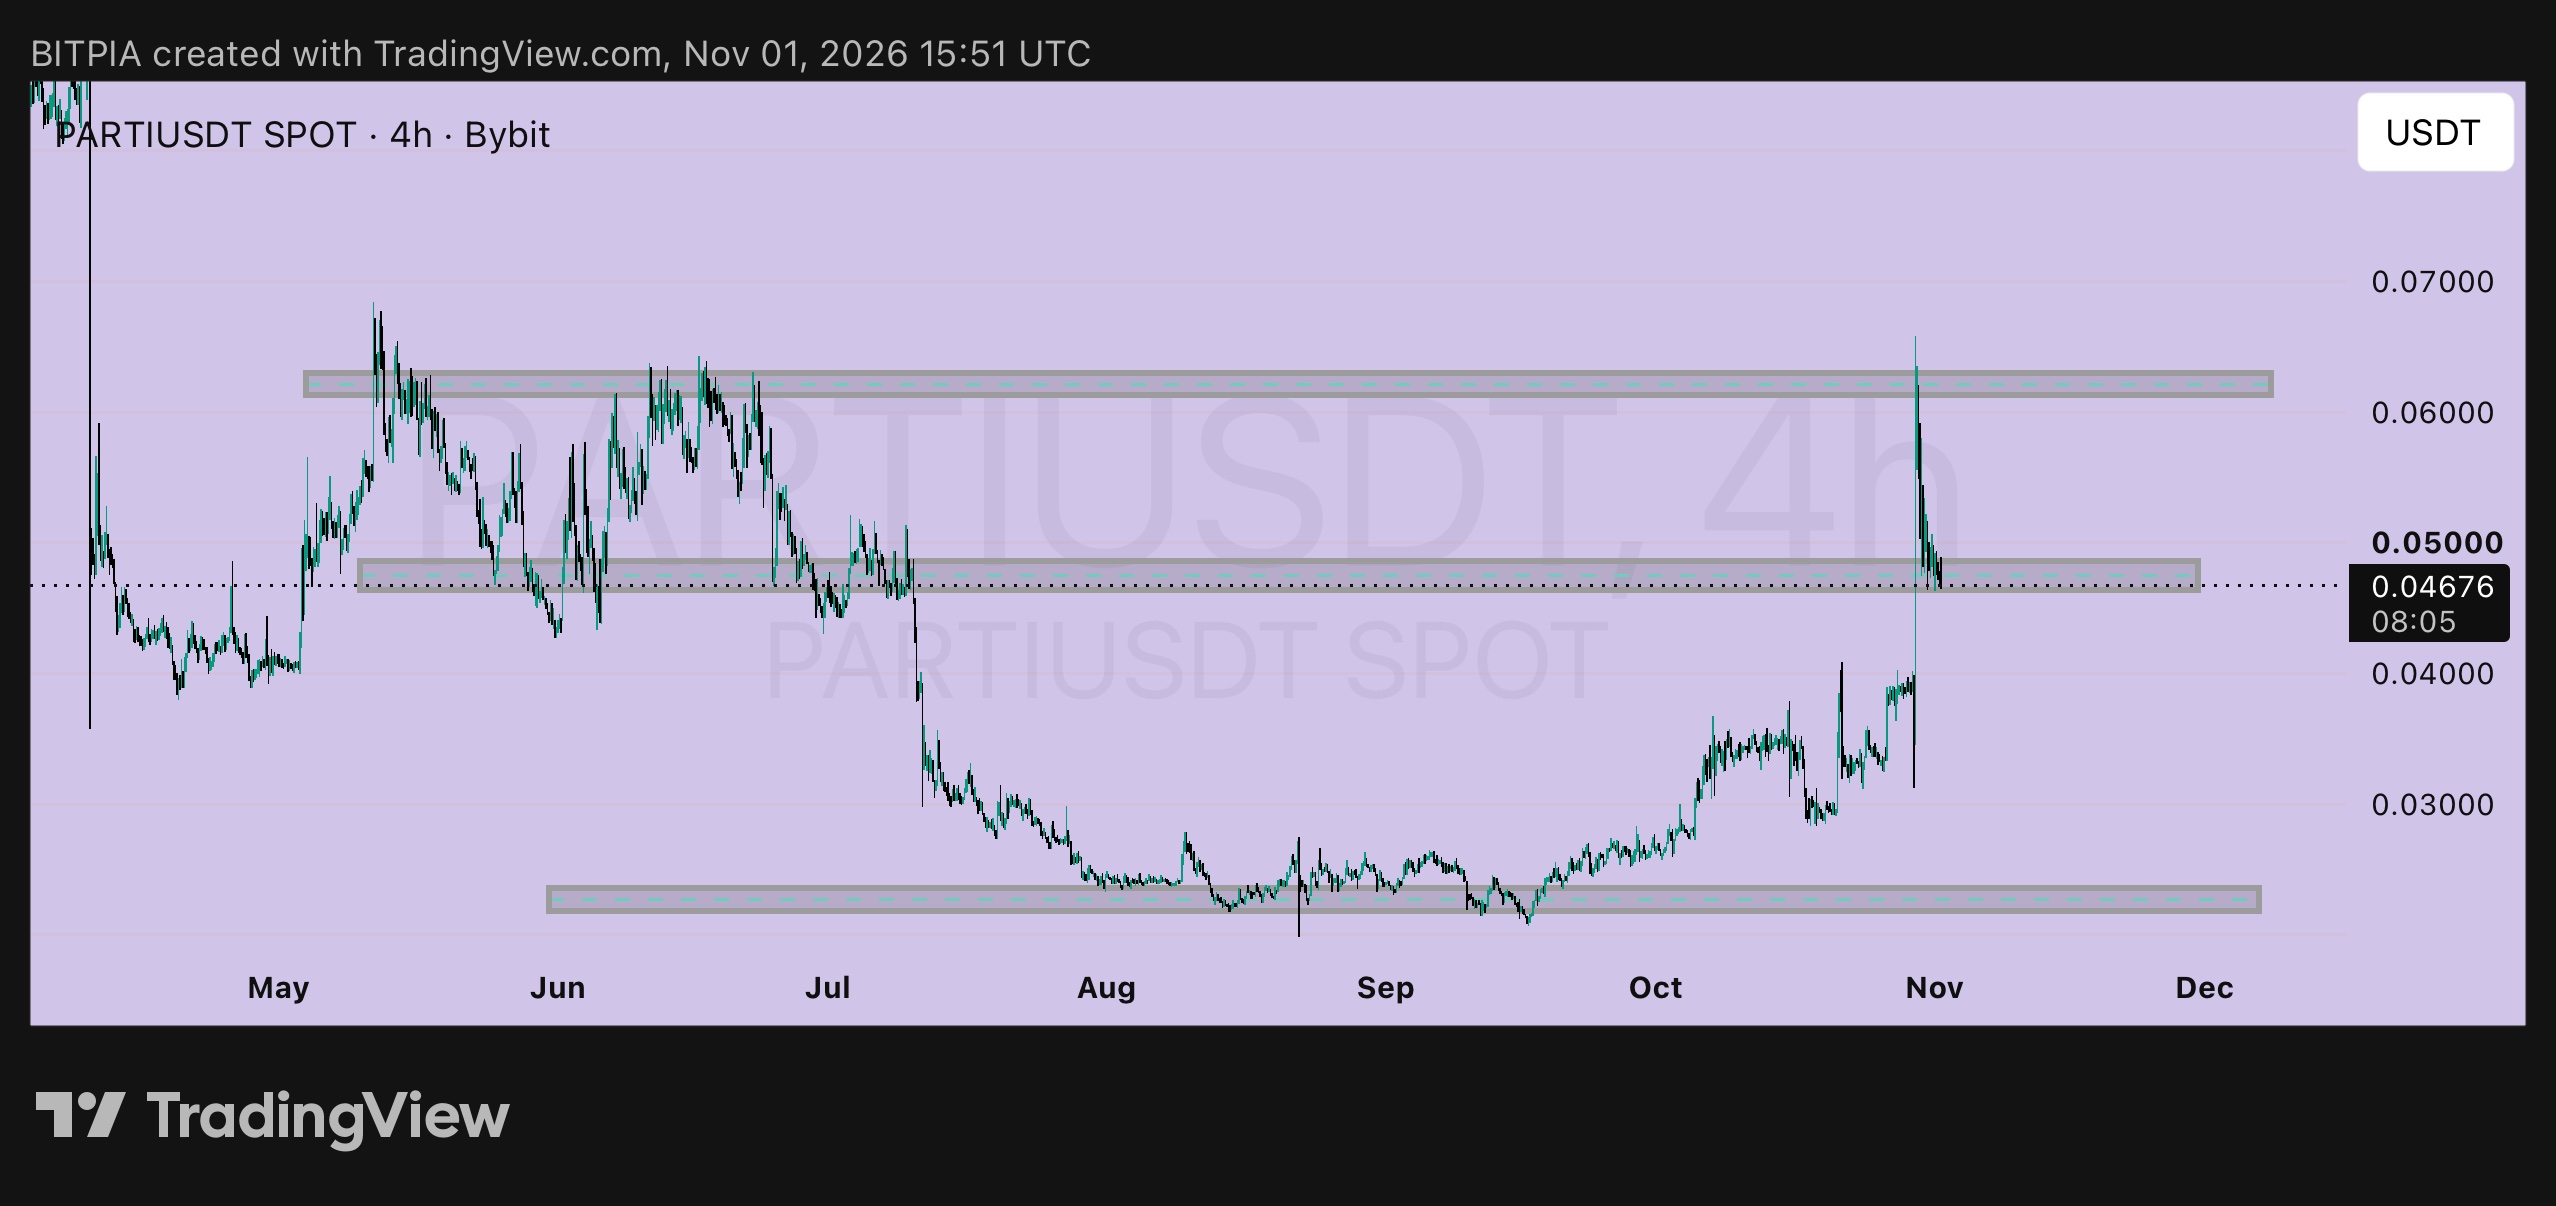
$PARTIUSDT just did what I told you to wait for, and now comes the hard part: actually having a plan for it. On Oct 30 price was 0.0529, and I said the only entry I'd care about was a retest of the 0.0465 to 0.0485 zone, with a stop under 0.0440. Today it dropped from the 0.0657 spike straight into that zone and is sitting at 0.04676, right on the bottom edge of it. A 4h candle is about to close there, so what it does next matters more than the drop itself. Here's my if/then playbook: If the 4h closes back above 0.0485, the zone is holding as support and the retest is working. That's my green light for a small position, with 0.0605 to 0.063 as the first target. If price chops between 0.0465 and 0.0500 for a day or two, that's the market digesting a huge move. It's a healthy pause, so I'd wait. If a 4h candle closes below 0.0440, the breakout is failing. I'd be out, and the next areas to watch are 0.0395 to 0.0410, then the 0.0313 wick low. Levels: ▸ Retest zone: 0.0465 to 0.0485 ▸ Invalidation: a 4h close below 0.0440 ▸ Resistance: 0.0605 to 0.063 ▸ Spike high: about 0.0657, then 0.068 ▸ Base far below: 0.0215 to 0.0235 The numbers have finally become reasonable. Entering around 0.0468 with a stop at 0.0440 risks about 6% to gain about 29% at 0.0605, roughly 5 to 1, or about 40% at 0.0657, near 6.8 to 1. That's a very different trade from the 0.0605 chase I warned about on Oct 29. What's still bugging me: it dropped about 29% from the spike high in a couple of days, and the selling was fast. Fast drops can overshoot support, so I'd rather size small and let the 4h close confirm than go all in on a wick touch. PARTI moves hard in both directions, so keep leverage low and let the stop do its job. Not financial advice, just how I'm reading it. DYOR and only risk what you can afford to lose. #ByXIMPACT #WSOT2026 #IMPACTbyTrade
$PARTIUSDT gave back a big chunk of that daily spike, and it's now heading toward the level I said I'd actually want to trade. Yesterday I flagged the 0.0605 to 0.063 supply zone and said a candle that big usually gets retested. The spike to about 0.0657 got sold, and price is now at 0.05291, roughly 13% below where I posted it. Nothing broken yet, but the move is cooling off fast. What I'm doing ▸ Watching the 0.0465 to 0.0485 zone, the old resistance that the breakout ran through ▸ Waiting for price to come to it, then looking for a daily candle that holds it ▸ Keeping the stop under 0.0440 What I'm not doing ▸ Buying at 0.0529. A stop at 0.0440 risks about 16.8% to gain about 14.4% at 0.0605, which is a bad trade ▸ Calling the breakout failed. A pullback into old resistance is normal ▸ Ignoring the base. If 0.0465 breaks, the next real support is way down at 0.0215 to 0.0235 The numbers if it gets there Entry near 0.0475, stop at 0.0440. That risks about 7.4% for about 27% to the supply zone at 0.0605, and about 43% to 0.068. Roughly 3.7 to 1 and 5.8 to 1. Same chart as yesterday, but a much better price. What changes my mind ➤ A daily close below 0.0440 means the breakout was a blow-off, and I'm out ➤ A daily close back above 0.063 means buyers absorbed the supply, and the plan shifts to looking for pullbacks toward 0.068 and higher ➤ A choppy hold between 0.050 and 0.056 just means the market is deciding The lesson from this one is simple: the candle that makes you want to buy is almost never the candle you should buy. Let the retest come, and if it doesn't, there will be another chart. Not financial advice, just how I'm reading it. DYOR and only risk what you can afford to lose. #IMPACTbyTrade #WSOT2026
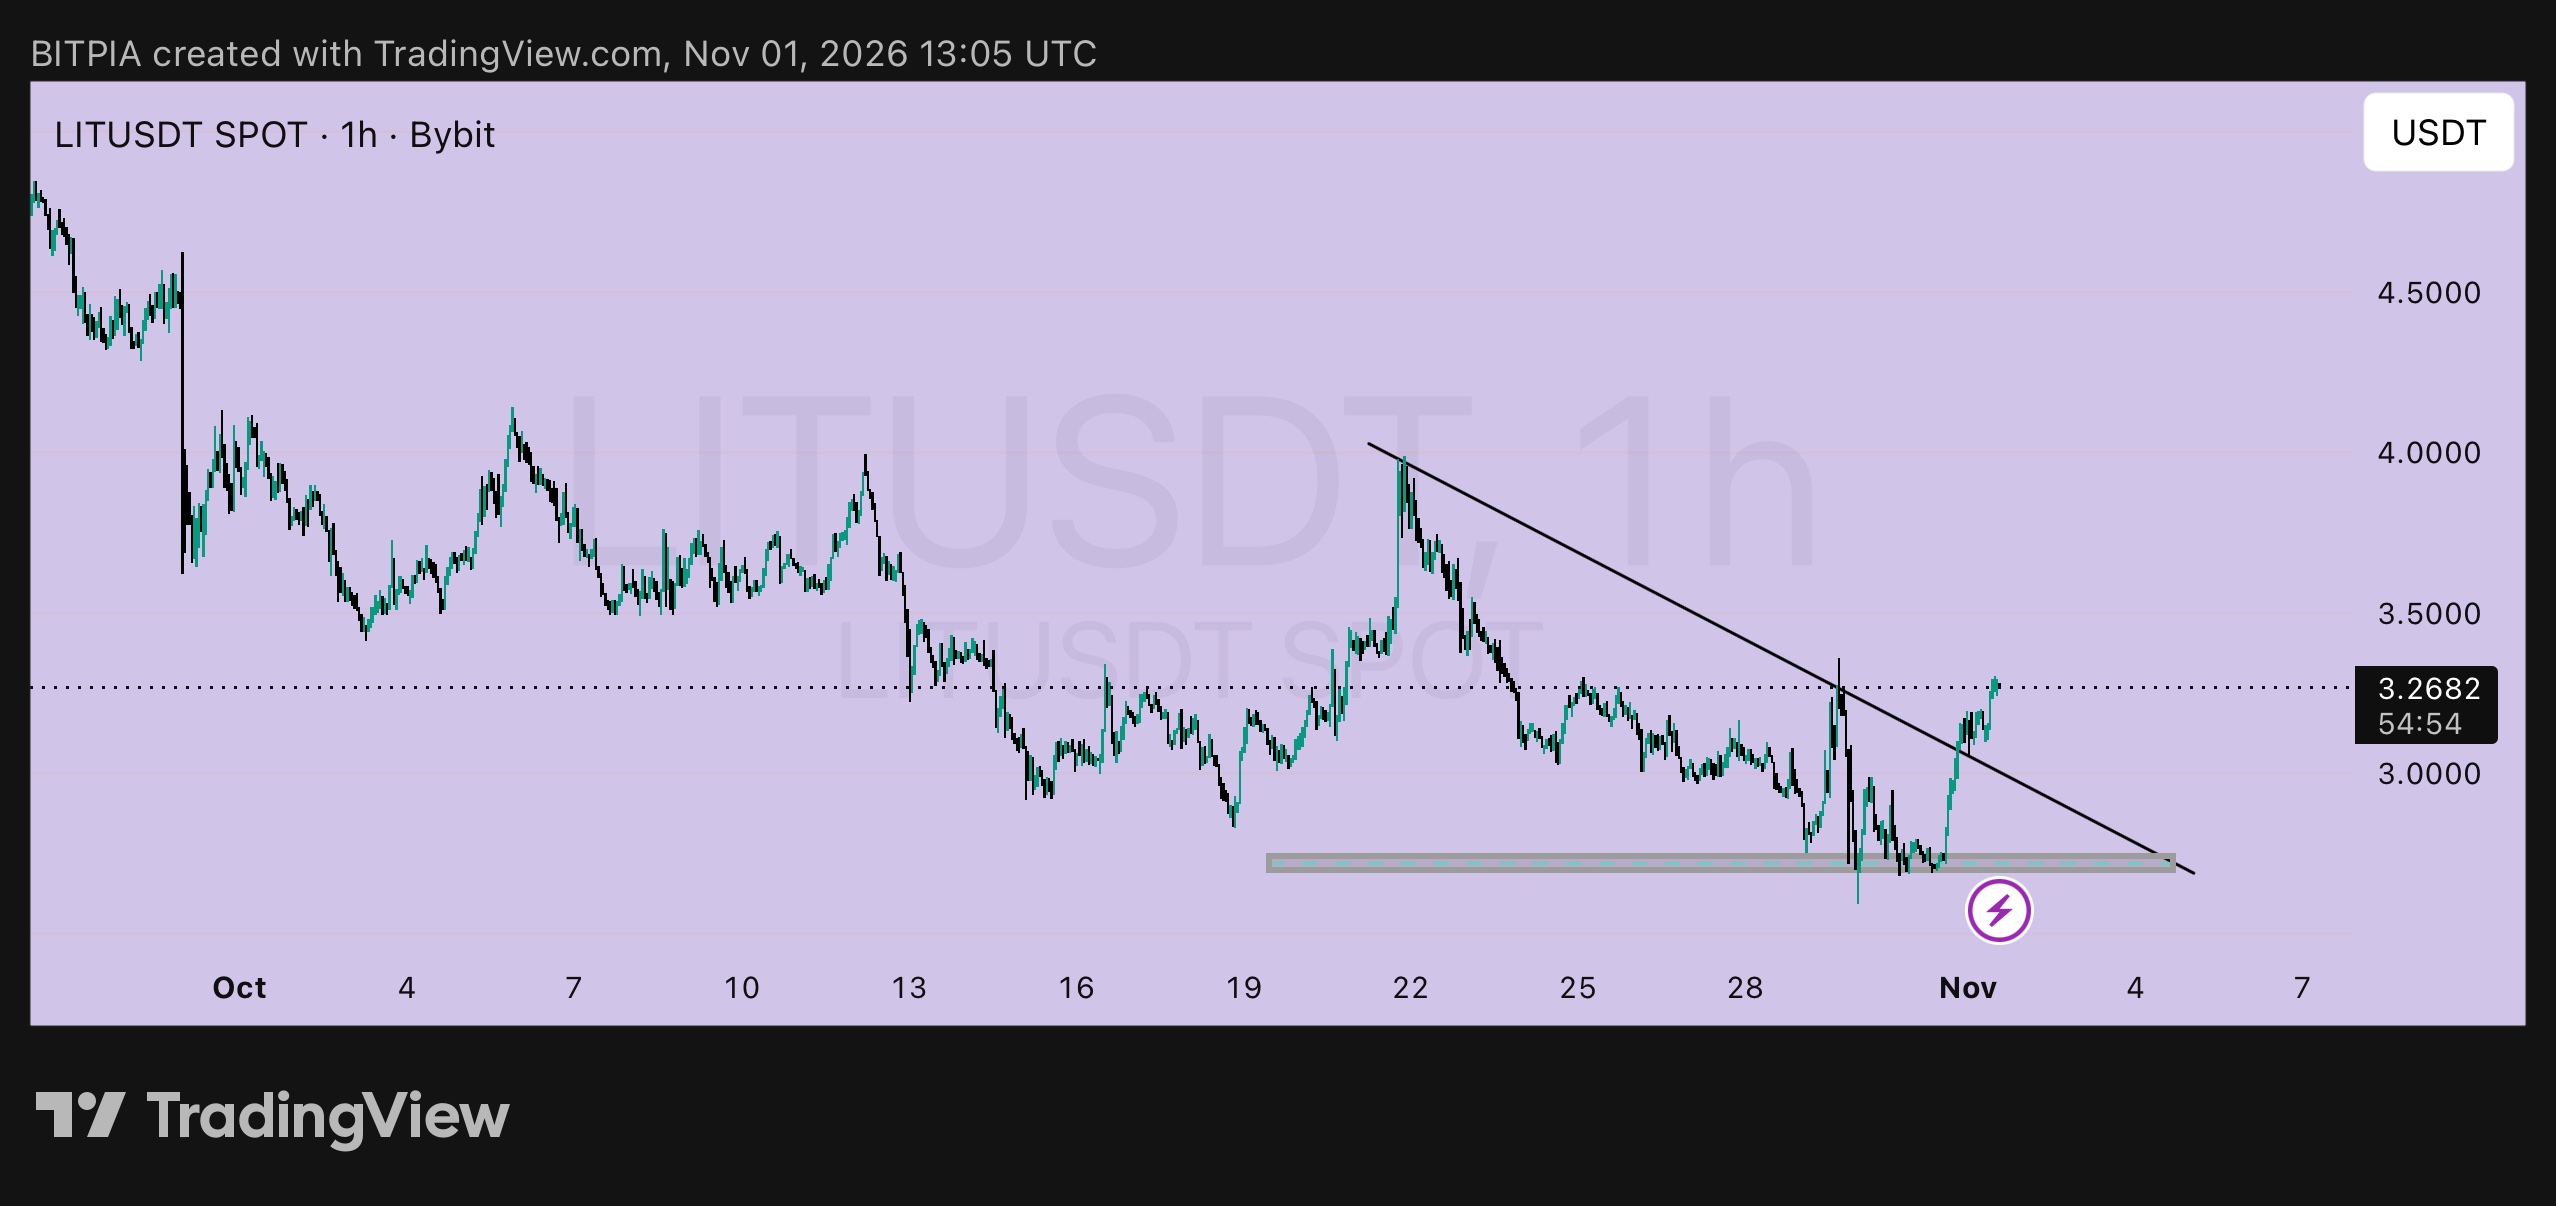
Someone asked me if it's too late to buy $LIT after this bounce. Here's the honest answer, one question at a time. What happened? $LITUSDT has been in a downtrend since early October, sliding from around 4.6 to the mid 2s with lower highs along the way. It finally tagged the 2.70 to 2.76 floor, wicked to about 2.58 on Oct 30, and got bought right back. From there it ripped through the falling trendline and now sits at 3.2682, roughly 20% off the base. Is the breakout real? It's a good start. The line is broken and price is holding above it. But 3.30 to 3.35 is the first real test, since that's where the Oct 24 and Oct 30 rallies got sold. A 1h close above 3.35 would tell me buyers mean it. Until then it's a bounce that's still proving itself. Where would I look to buy? Not here. The trendline it just broke sits around 3.05 to 3.12, and a retest of that area is the entry I'd want. Chasing 3.2682 with a stop at 2.95 risks about 9.7% to gain about 7.1% at 3.50, and that's under 1 to 1. Buying a retest near 3.08 with the same stop risks about 4.2% for about 13.6% to 3.50 or about 30% to 4.0. That's roughly 3.2 to 1 and 7.1 to 1. Levels I'm watching ▸ Retest zone: 3.05 to 3.12 ▸ Invalidation: a 1h close below 2.95 ▸ First resistance: 3.30 to 3.35 ▸ Next: 3.50, then 4.0 ▸ Base: 2.70 to 2.76 What if it never comes back? Then I miss it. That's fine. A trade you skip costs nothing, and a bad entry on a bounce inside a bigger downtrend costs real money. The big picture still shows lower highs from 4.13 and 4.0, so I'd want a close above 4.0 before calling the trend changed. If price loses 2.95 and closes back under the trendline, the breakout failed and I'm out. Keep size small, because a coin this far down can swing hard. Not financial advice, just how I'm reading it. DYOR and only risk what you can afford to lose. #IMPACTbyTrade #WSOT2026 #ByXIMPACT
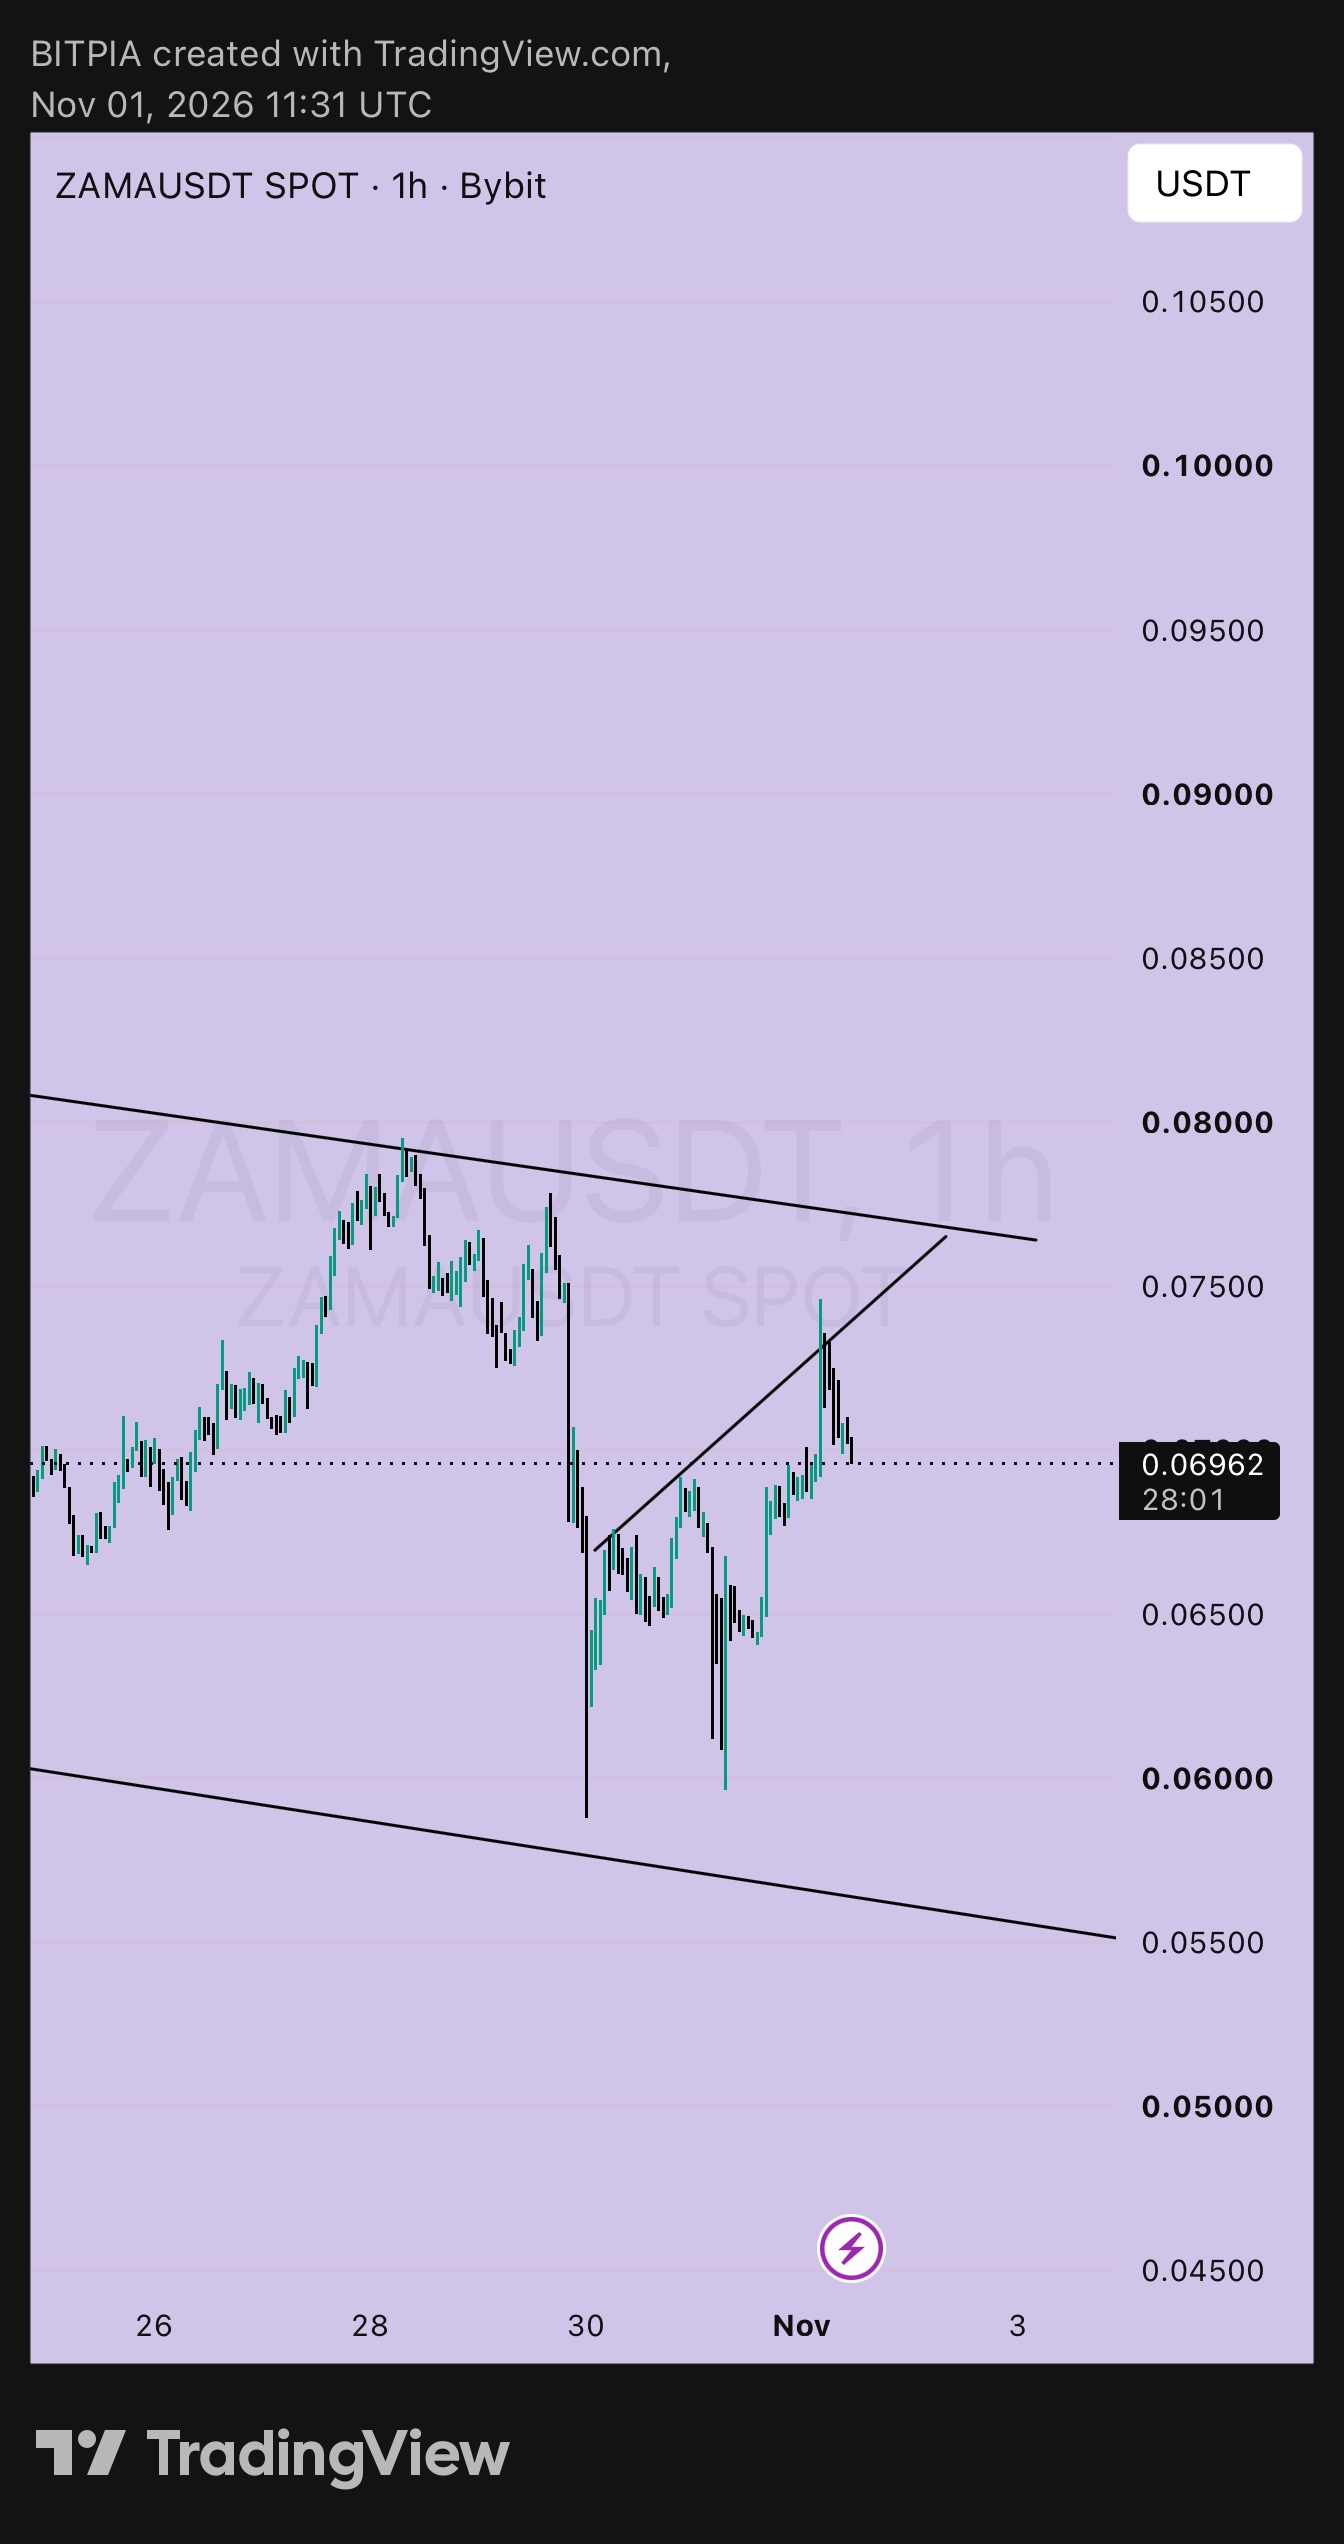
$ZAMAUSDT post-mortem: the cup and handle I was tracking is dead, so here's what I got wrong and what the chart looks like now. What I said on Oct 29 The handle needed to hold 0.0720 to 0.0740, and a 1h close below 0.0715 would kill the cup. Price was 0.07364. That close below 0.0715 happened, and ZAMA flushed to about 0.0588 on Oct 30. From my 0.0736 reference, taking the stop would have cost around 3 to 3.5%. That's what the stop was for, and I'm not going to defend the pattern after it broke. What I got wrong I treated the handle as a normal pullback. The rejection at the rim was bigger than it looked, and the dip kept going instead of bouncing at the first support. The old 0.0905 measured target is off the table until the rim at 0.0785 to 0.0795 gets reclaimed. What the chart shows now ➤ A falling channel, with the upper line near 0.0765 to 0.0770 and the lower line around 0.056 to 0.0575 ➤ Two lows, 0.0588 and 0.0598, so the second one barely held above the first ➤ A bounce up to about 0.0732 that hit a small rising line and got rejected, and price is now at 0.06962 Levels I'm watching ▸ Support: 0.0588 to 0.0598 ▸ Invalidation: a 1h close below 0.0585 ▸ Resistance: 0.0732 to 0.0735 ▸ Channel top: 0.0765 to 0.0770 ▸ Rim: 0.0785 to 0.0795 The numbers Buying now at 0.06962 with a stop at 0.0585 risks about 16% to make about 10% at the channel top. That's a bad trade. A dip to 0.0615 with a stop at 0.0580 risks about 5.7% for about 19.5% to 0.0735 or about 24% to 0.0765, roughly 3.4 to 1 and 4.2 to 1. Same chart, and the entry does all the work. What would turn me bullish again A 1h close above 0.0735, then a close above 0.0770. That breaks the channel and puts the rim back in play. Until then I'm treating ZAMA as a downtrend with bounces, so no chasing and small size. Not financial advice, just how I'm reading it. DYOR and only risk what you can afford to lose. #IMPACTbyTrade #WSOT2026 #ByXIMPACT
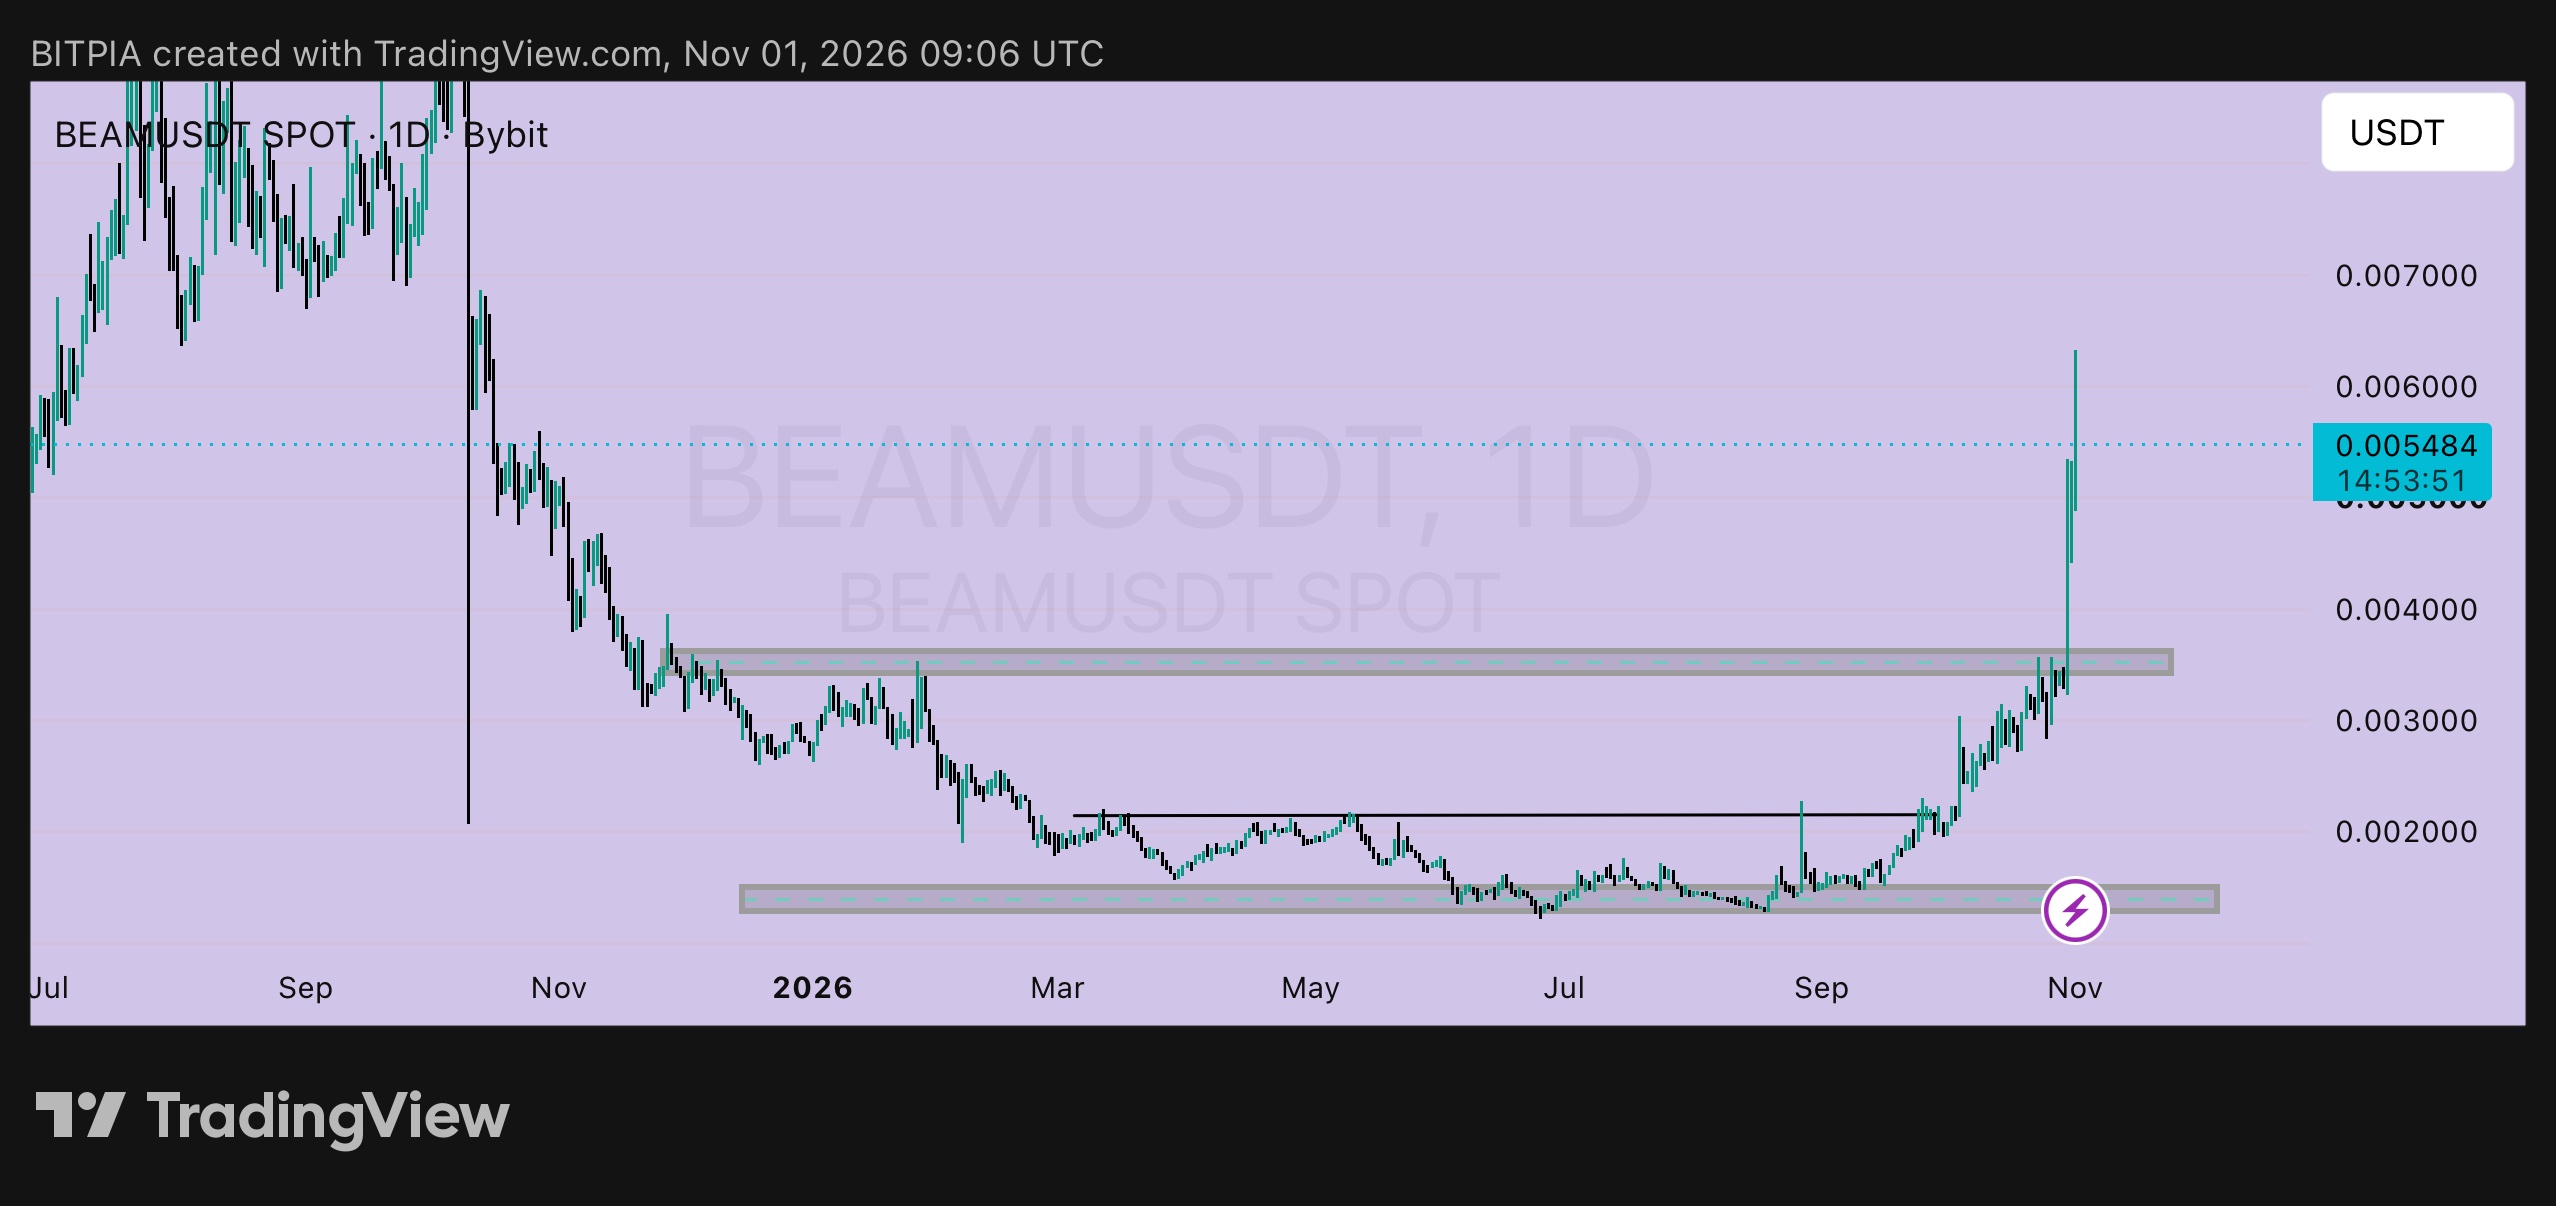
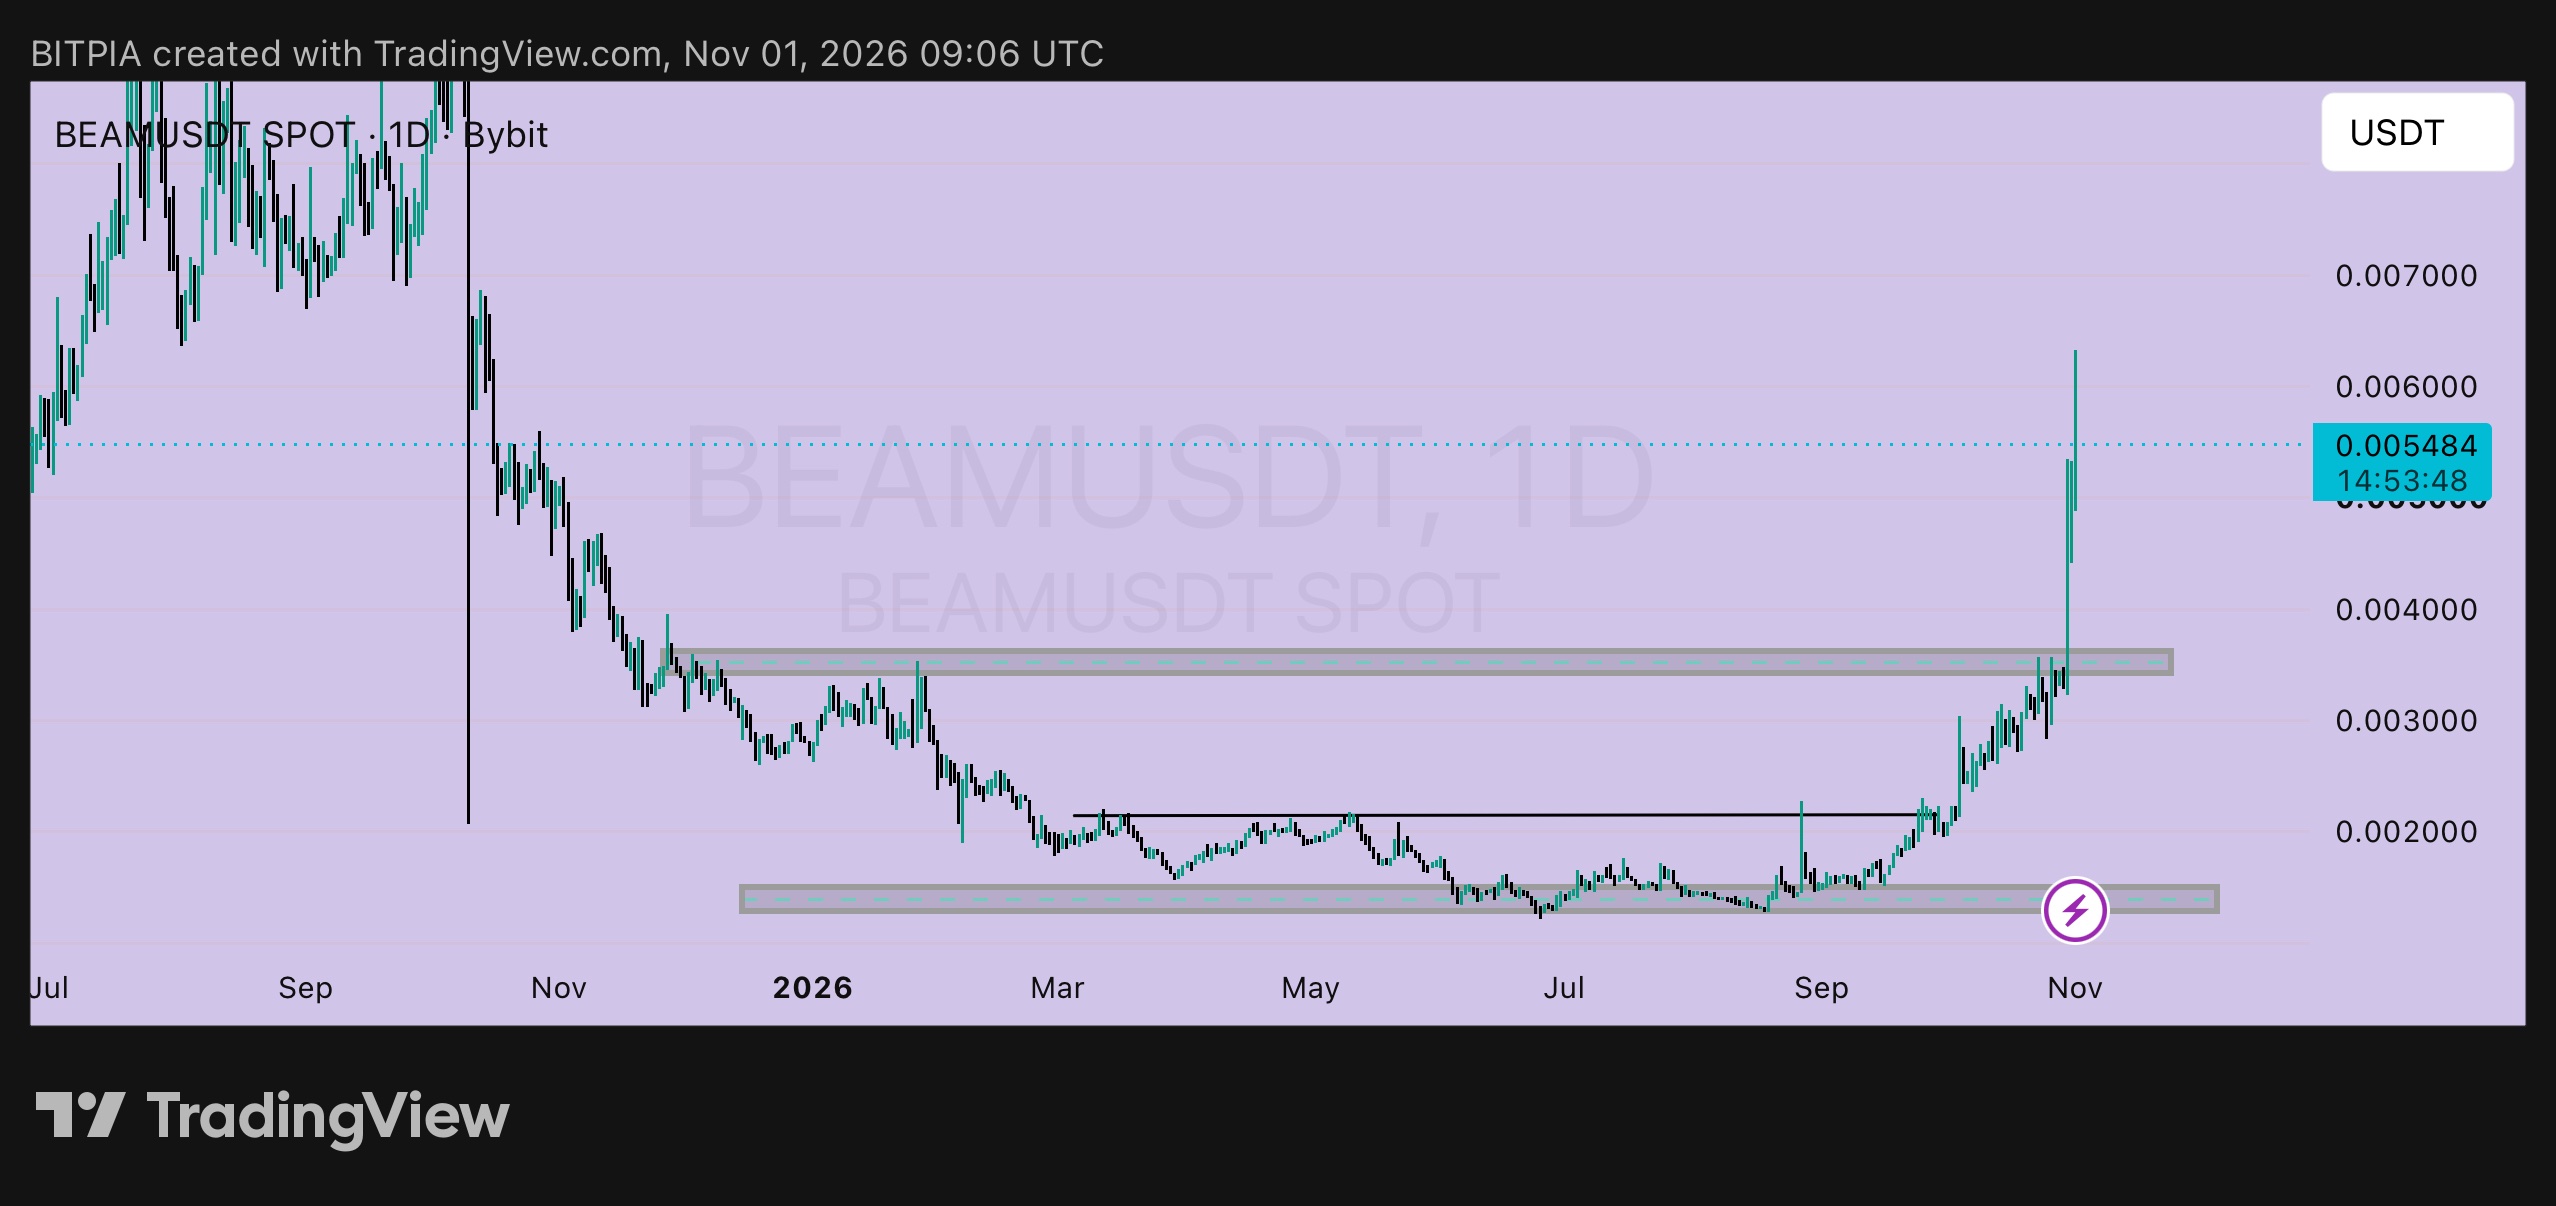
$BEAMUSDT is up nearly 4x from its main support, and the chart is a good lesson in what not to do with a candle like this. Reading it left to right: The crash. Last October BEAM flushed hard, with a wick all the way down to about 0.0021, and then bled lower for months. The base. From March to September it built a long floor around 0.0014 to 0.0016, with a flat ceiling near 0.0021 to 0.0022. Nothing exciting, which is exactly what bases look like. The grind. In September price broke that ceiling and climbed steadily into the 0.0034 to 0.0036 zone, which was the old resistance from the downtrend. Today. A single daily candle took it from about 0.0033 straight through that zone to a high of 0.0063, and it's now sitting at 0.005484 with roughly 15 hours left before the close. That's about 66% in one day, and the upper wick shows sellers already showed up near 0.006. Levels I'm watching ▸ Support: 0.0034 to 0.0036, the zone it just exploded through ▸ Invalidation: a daily close below 0.0034 ▸ Resistance: 0.0060 to 0.0063, today's wick area ▸ Bigger resistance: 0.0068 to 0.0070, the top of last October's bounce What I'm thinking A breakout this violent usually comes back to test where it started. That's not bearish, it's just how these moves breathe. Buying here at 0.005484 with a stop at 0.0033 risks about 40% to make about 15% at 0.0063, and that's not a trade, that's a lottery ticket. A pullback into 0.0037 with a stop at 0.0032 risks about 13.5% for about 70% to 0.0063, and about 86% to 0.0069. That's roughly 5 to 1 and 6.4 to 1. Same coin, same chart, completely different bet. What would change my mind If it holds above 0.0055 on the daily close and keeps building there instead of dropping, I'd respect that and look for a smaller pullback entry. If it closes back under 0.0045, the spike was probably a blow-off and I'd wait for the old zone. BEAM is a thin, fast coin, so give it room and keep your size small. Moves like this can reverse just as quickly as they rise. Not financial advice, just how I'm reading it. DYOR and only risk what you can afford to lose. #WSOT2026 #IMPACTbyTrade #ByXIMPACT
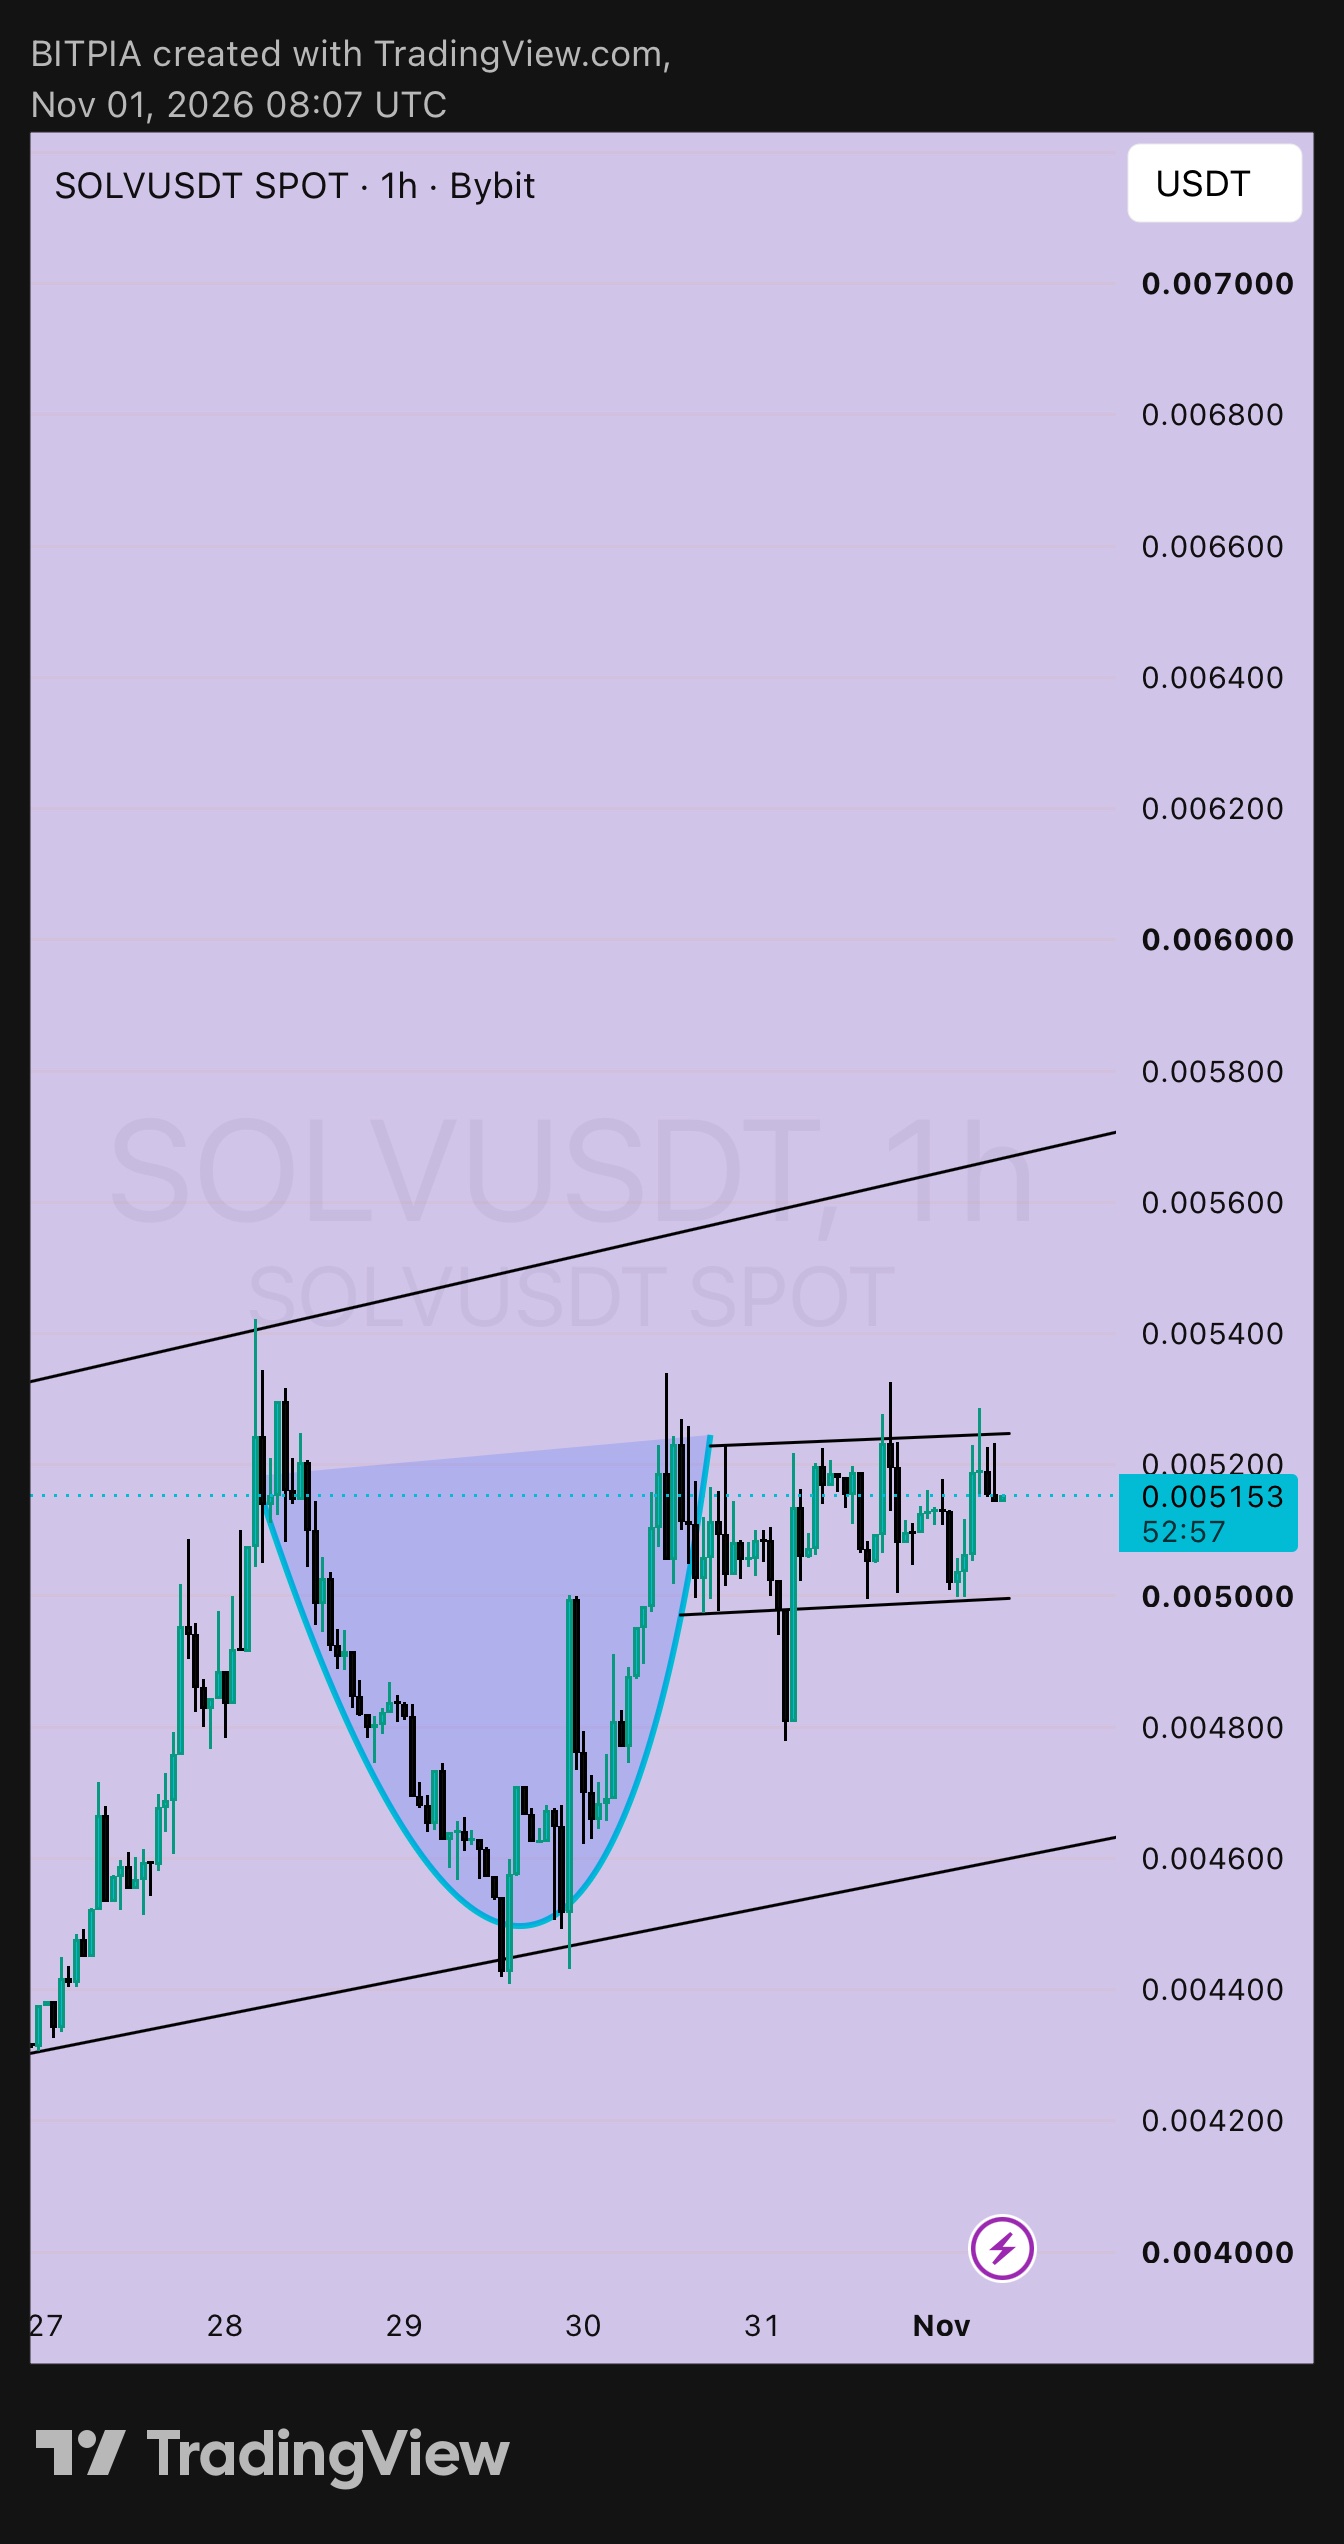
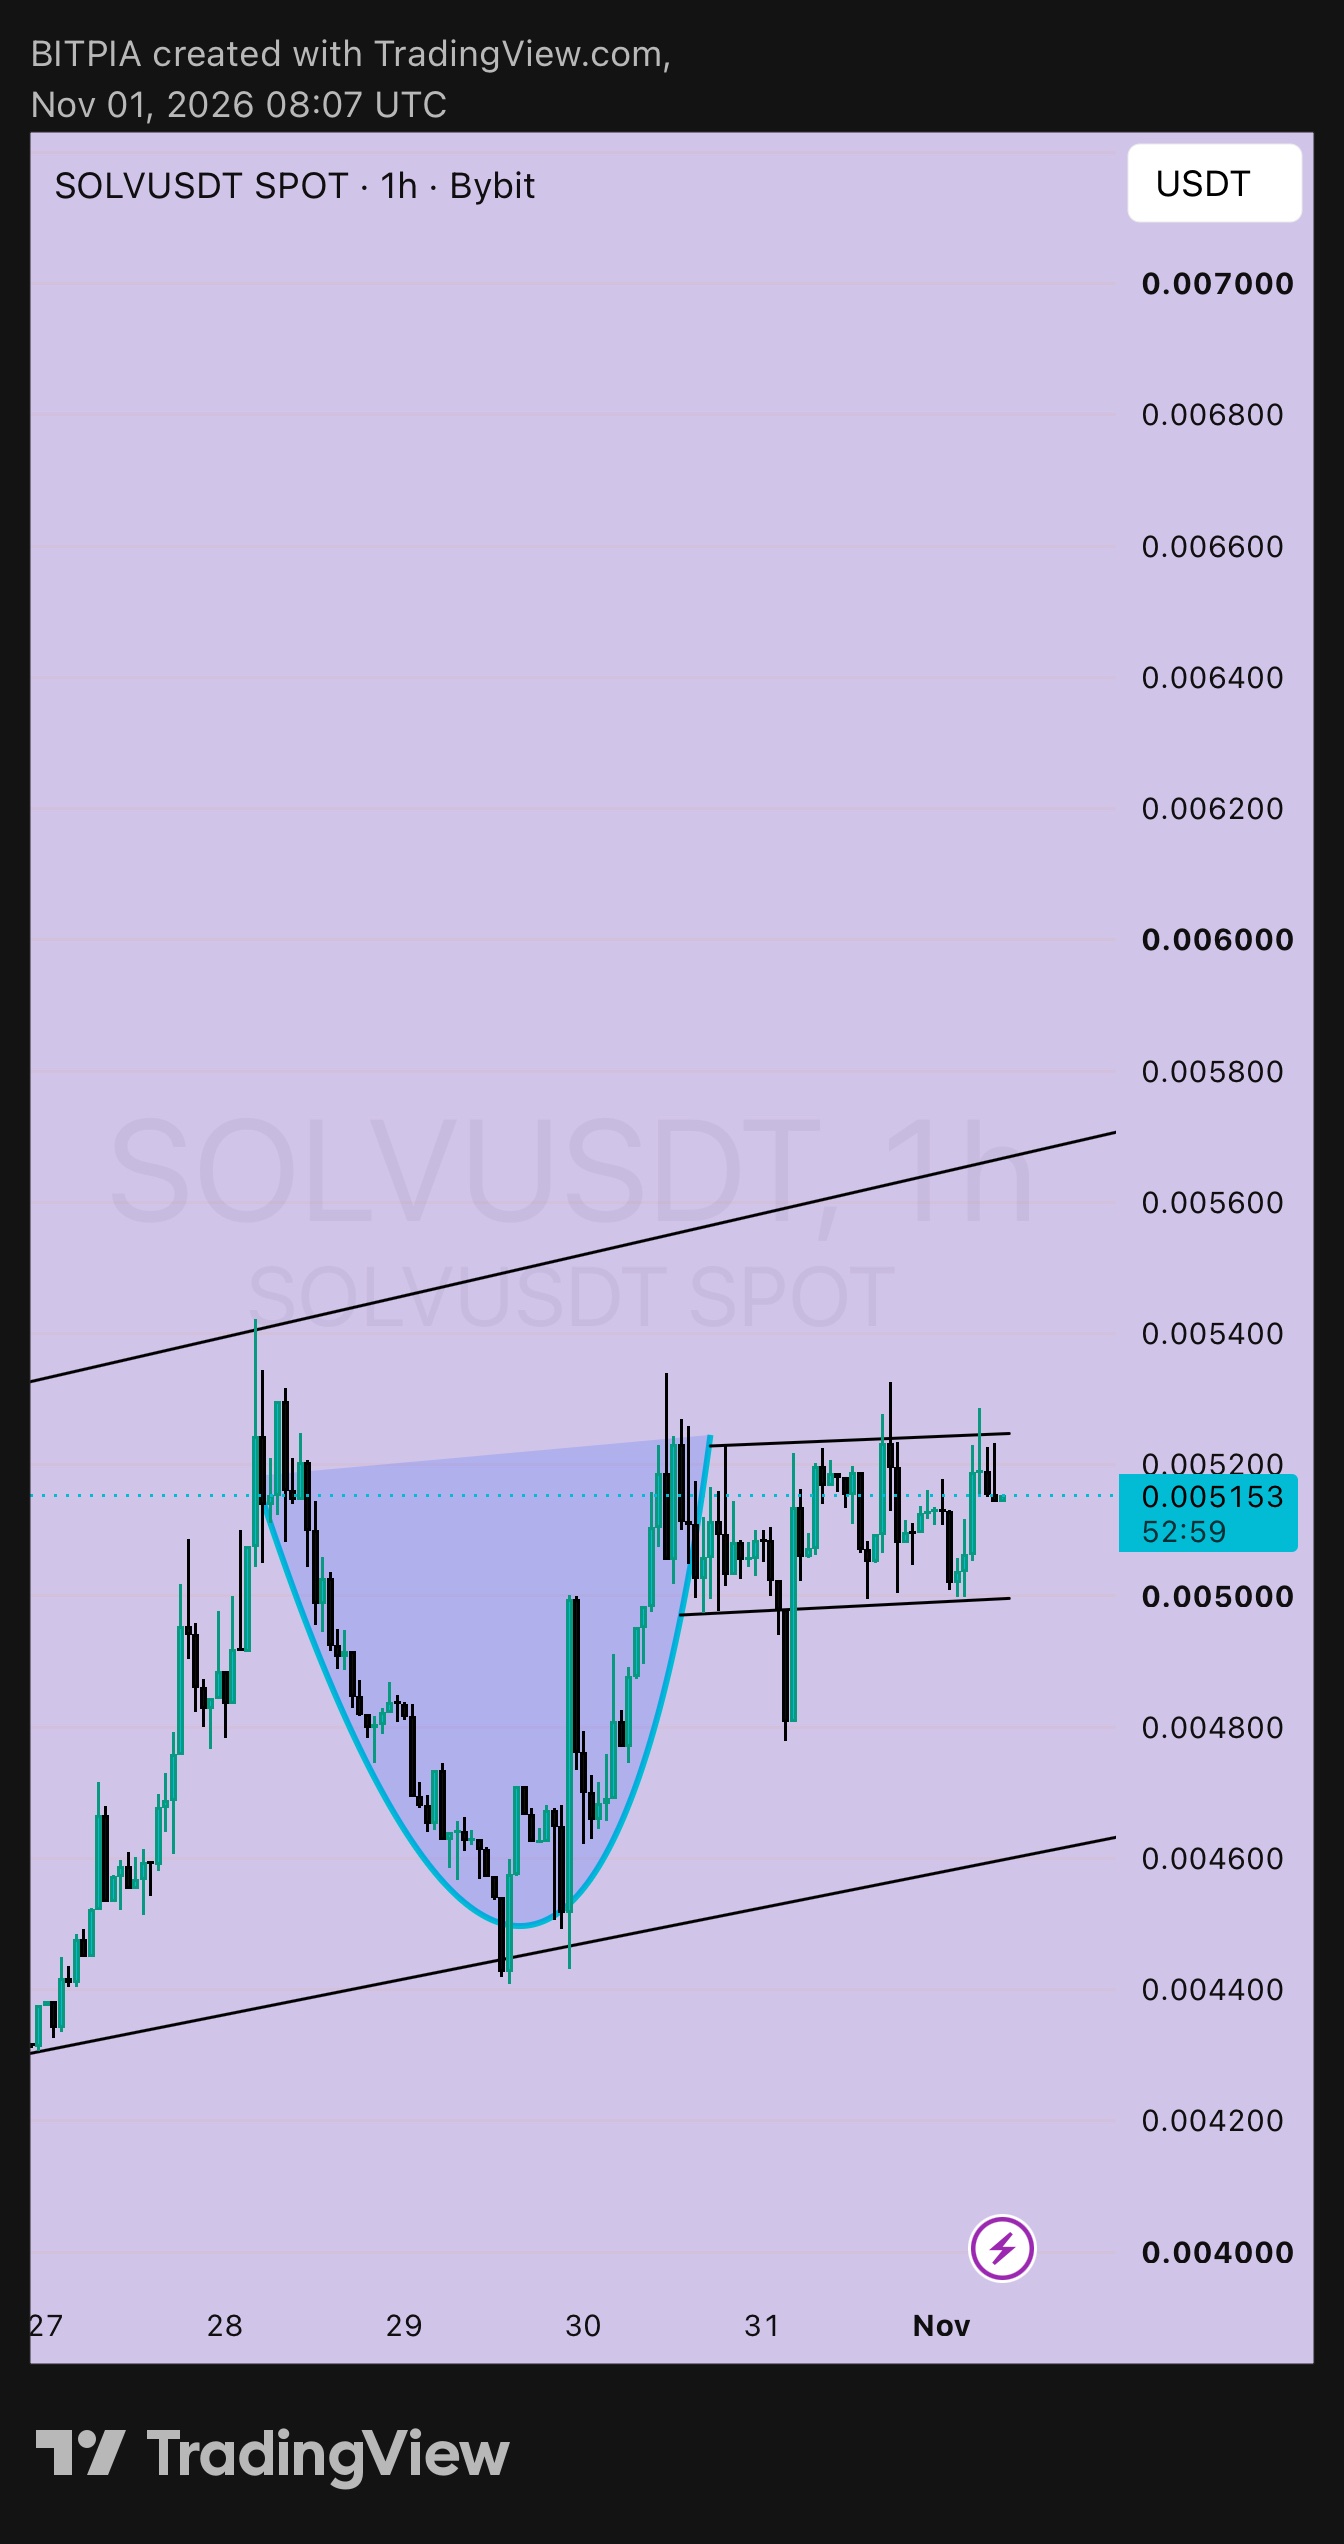
$SOLVUSDT is coiling right under its breakout level, and my checklist says it's close but not ready yet. The picture on the 1h: price dipped to about 0.00443 on Oct 29, curved back up into a cup, and has been moving sideways just under the rim ever since. That sideways stretch is the handle, a tight box between roughly 0.00500 and 0.00525. It's now at 0.005153, in the middle of it. There's also a wider rising channel around everything, and the lower line of it has held on every dip. Before I'd put money on it, I want these boxes ticked: ▸ Cup structure: done. Clean curve, rim around 0.00525. ▸ Handle that holds: done so far. A wick to 0.00478 on Oct 31 got bought, and the 0.00500 floor keeps catching dips. ▸ Rim break: not yet. Price has poked above 0.00525 twice, up to about 0.00541, and both times it closed back inside the box. Wicks don't count. ▸ Retest after the break: not yet. If it closes above 0.00530, I want to see 0.00525 hold as support. Levels: ▸ Handle floor: 0.00498 to 0.00500 ▸ Wick low: 0.00478 ▸ Rim: 0.00525 to 0.00530 ▸ Recent highs: 0.00541, then 0.00545 ▸ Measured target: about 0.00607, which is the cup depth added to the rim, and it lines up with the 0.006 round number ▸ Invalidation: a 1h close below 0.00485 The numbers decide how I'd play it. Buying right here at 0.005153 with a stop at 0.00495 risks about 3.9% to make about 5.8% at 0.00545, roughly 1.5 to 1. Not great. A dip to 0.00502 with a stop at 0.00485 risks about 3.4% for about 21% to 0.00607, closer to 6 to 1. And a breakout entry on the retest near 0.00527 with a stop at 0.00502 risks about 4.7% for about 15% to the same target, around 3.2 to 1. So I'm leaning toward patience. I'd rather let it come to the floor of the box or prove the breakout than buy the middle and hope. One more thing: SOLV is a low-priced coin, so a few ticks looks like a big percentage. Keep the position small, and don't trust stops placed right on top of the box lines. Not financial advice, just how I'm reading it. DYOR and only risk what you can afford to lose. #WSOT2026 #IMPACTbyTrade
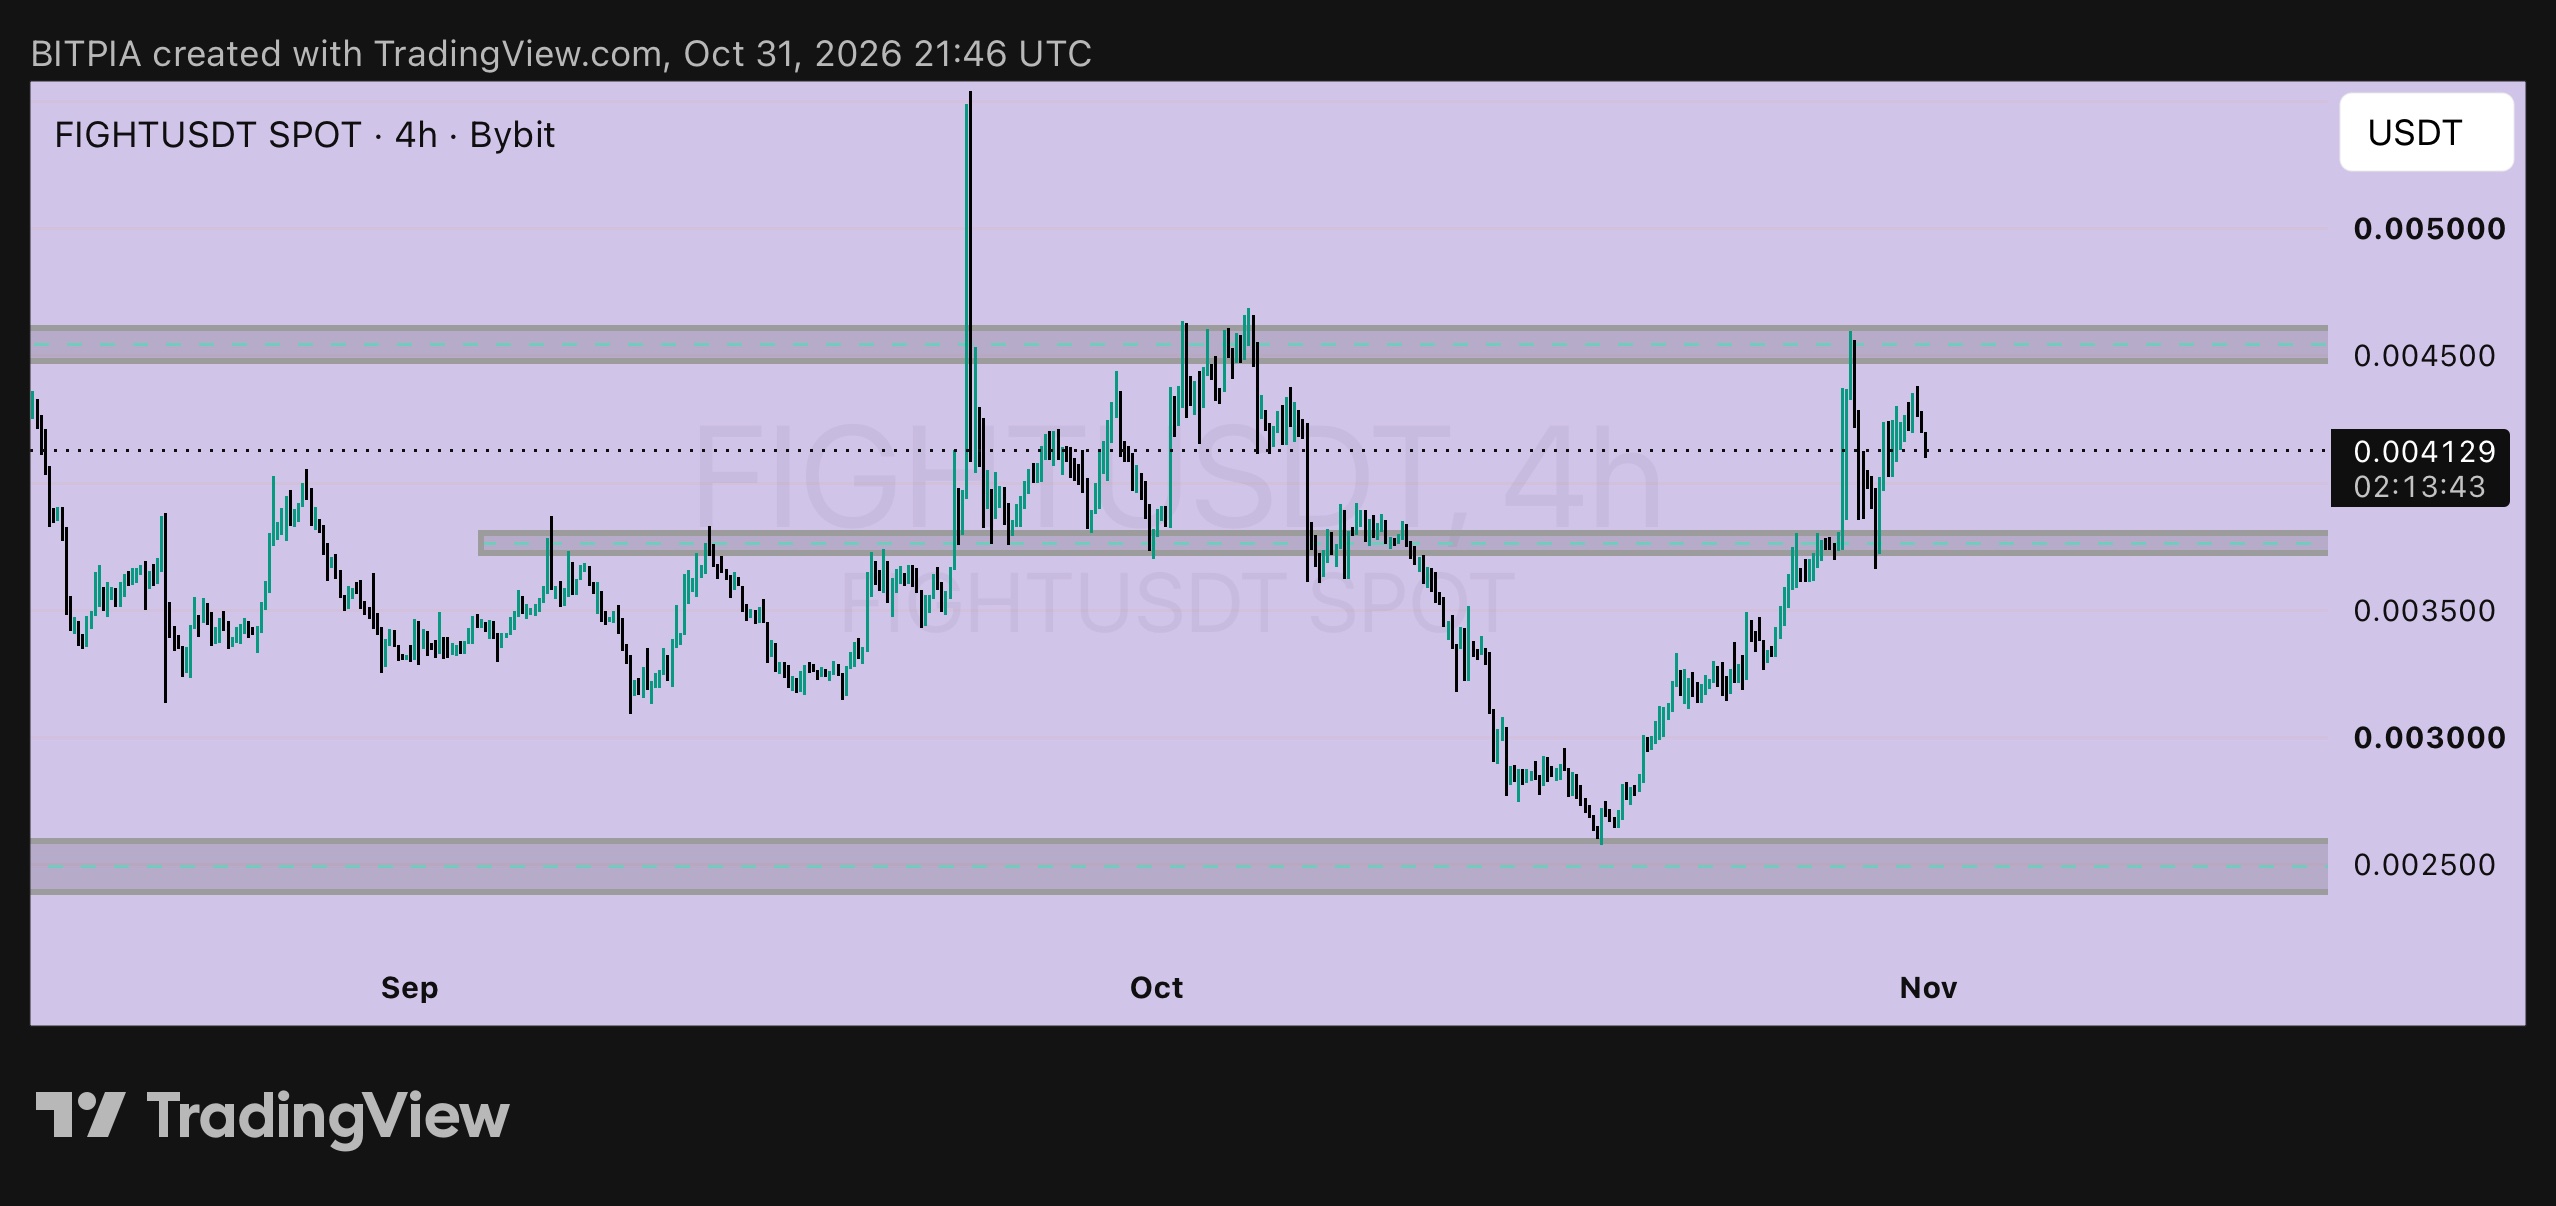
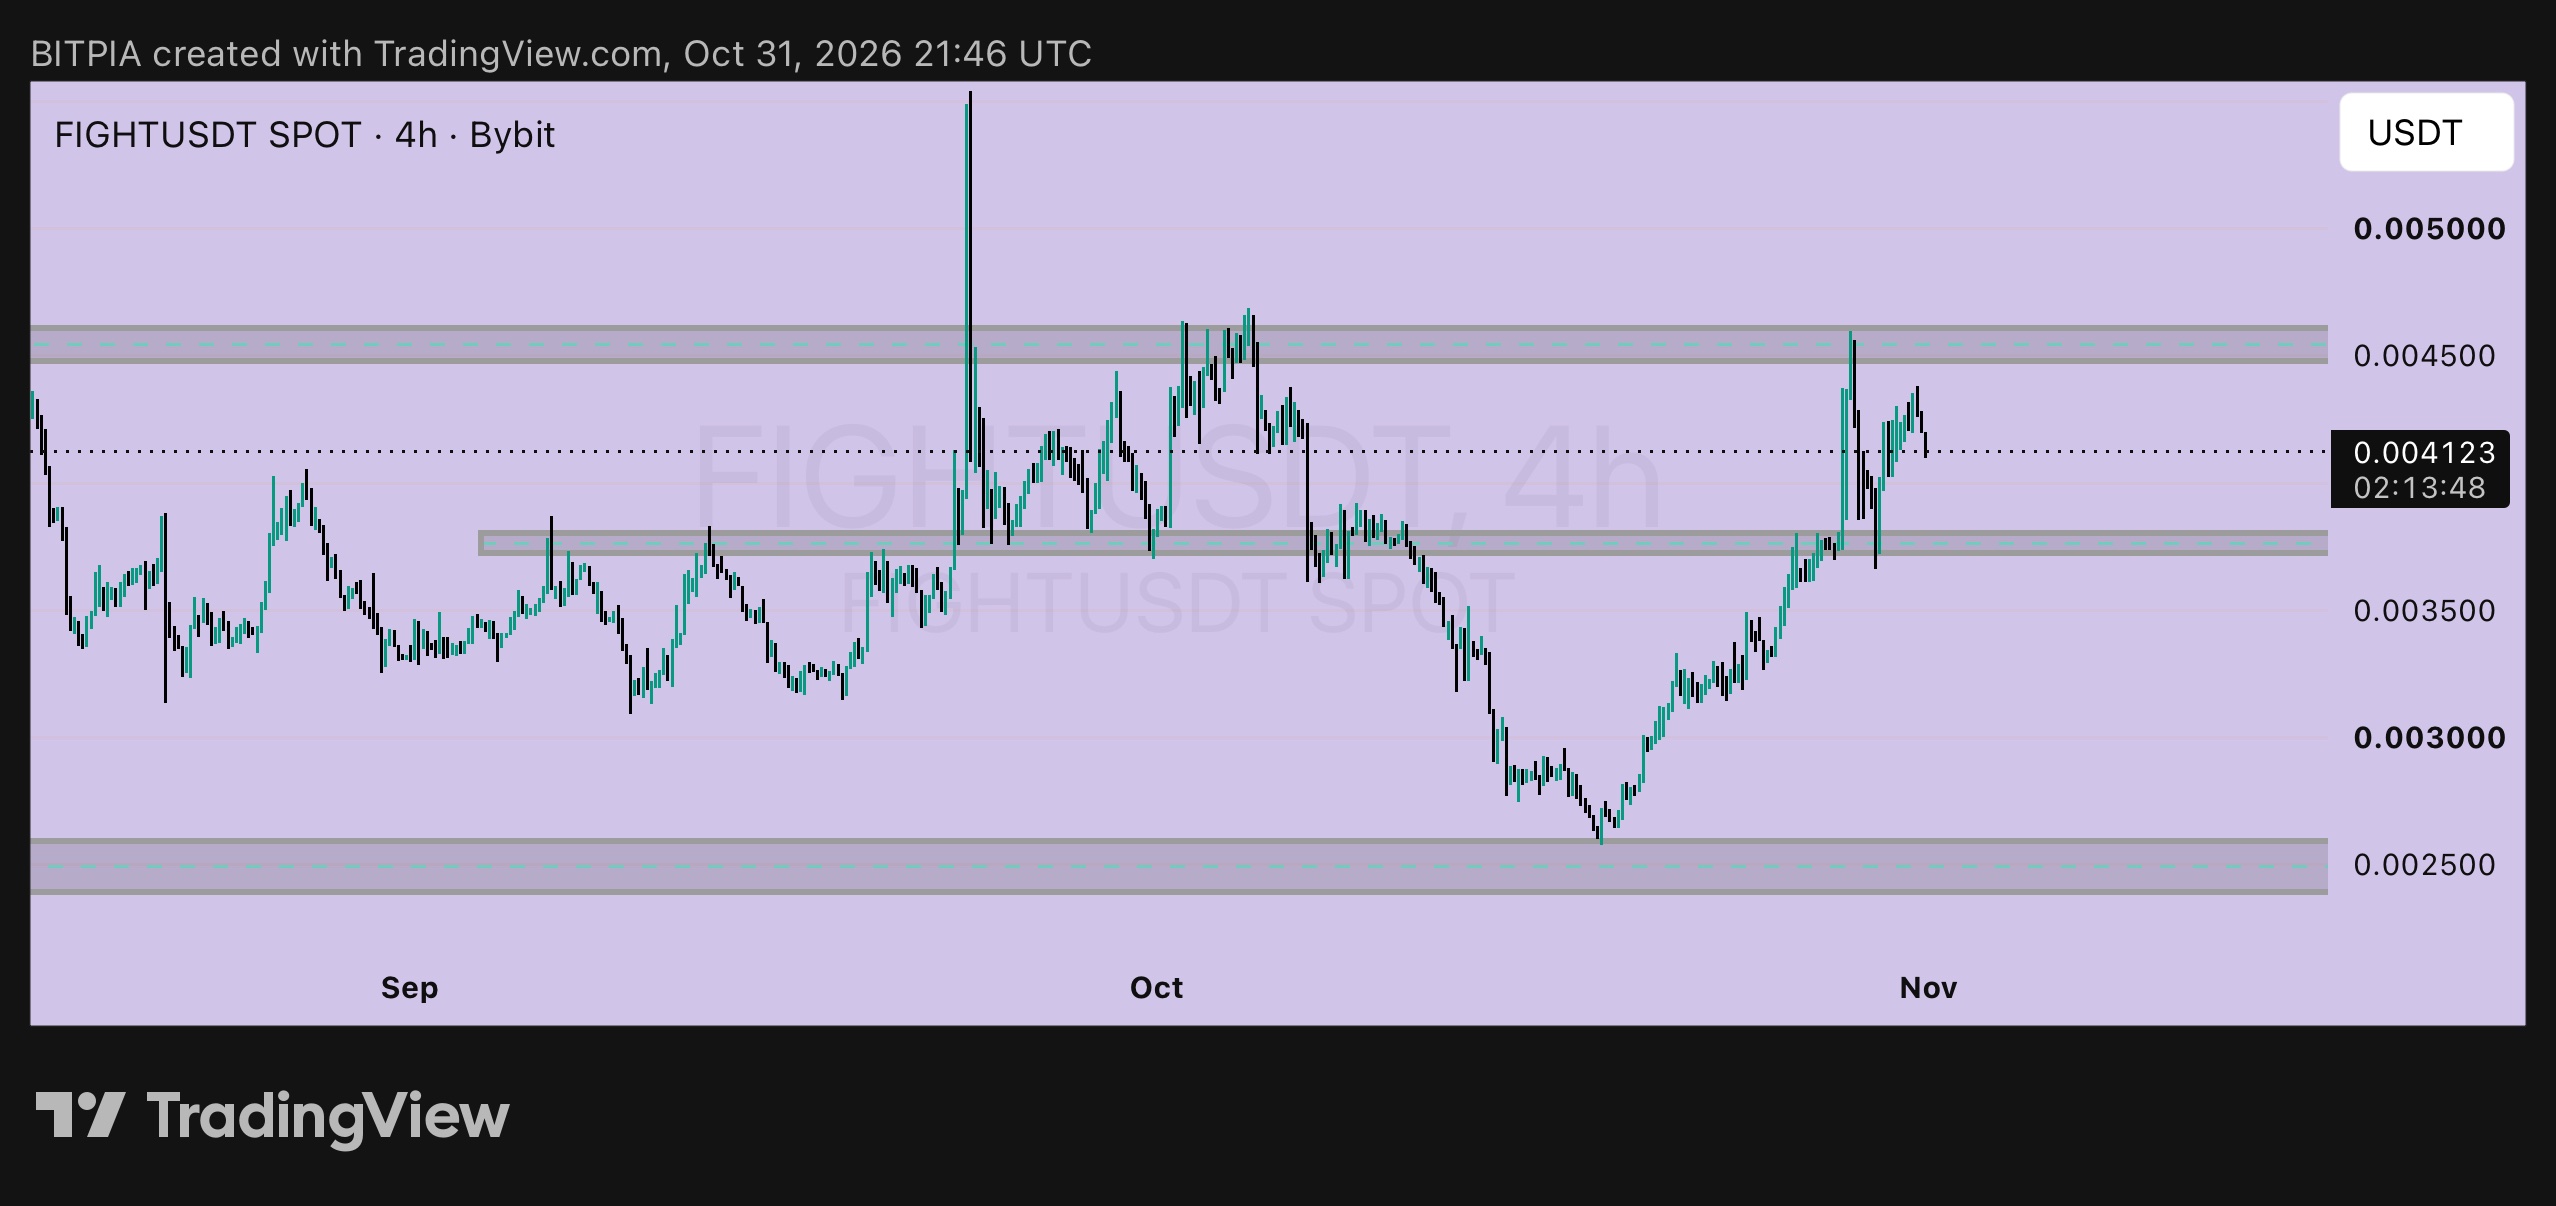
$FIGHTUSDT trade ticket, written the way I'd log it before touching anything. Context: on Oct 30 I said 0.0045 to 0.0046 was the ceiling and that I wasn't buying the middle of the range. Since then, price dipped to about 0.00368, bounced hard to 0.00438, and is now at 0.004129. That dip landed right on the mid-range zone I flagged, a bit higher than I expected, and buyers showed up. Setup: range trade inside a months-long box Bias: neutral until a close above the ceiling Current price: 0.004129 (the middle again, so no entry) Zones on the 4h ▸ Ceiling: 0.00450 to 0.00465, rejected again at about 0.00460 ▸ Mid-range support: 0.00370 to 0.00380, just defended ▸ Floor: 0.00250 to 0.00260, the October low Entry options ➤ Pullback: 0.00385, if price comes back and holds the mid-range zone ➤ Breakout retest: 0.00465, only after a close above 0.0047 and a retest that holds ➤ Right now: skip it Stops ▸ Pullback trade: 0.00358, below the mid-range zone and the wick low ▸ Breakout trade: 0.00435, back inside the range Targets ▸ First: 0.0045, the ceiling ▸ Second: 0.0055 ▸ Third: about 0.0067, the full measured move from the range Risk and reward Pullback entry risks about 7% for about 17% to the ceiling and about 43% to 0.0055, so roughly 2.4 to 1 and 6.1 to 1. Breakout retest risks about 6.5% for about 18% to 0.0055 and about 44% to 0.0067, so roughly 2.8 to 1 and 6.8 to 1. Buying at 0.004129 with a stop at 0.00358 risks about 13% to make about 9% at the ceiling, which is a no from me. Cancel conditions A 4h close below 0.00358 kills the pullback idea, and a rejection at the ceiling with a close back under 0.0040 says the range is still in charge. Notes to self: FIGHT wicks hard, so the stops sit beyond the wicks, not on top of them, and size stays small. Not financial advice, just how I'm reading it. DYOR and only risk what you can afford to lose. #WSOT2026 #IMPACTbyTrade
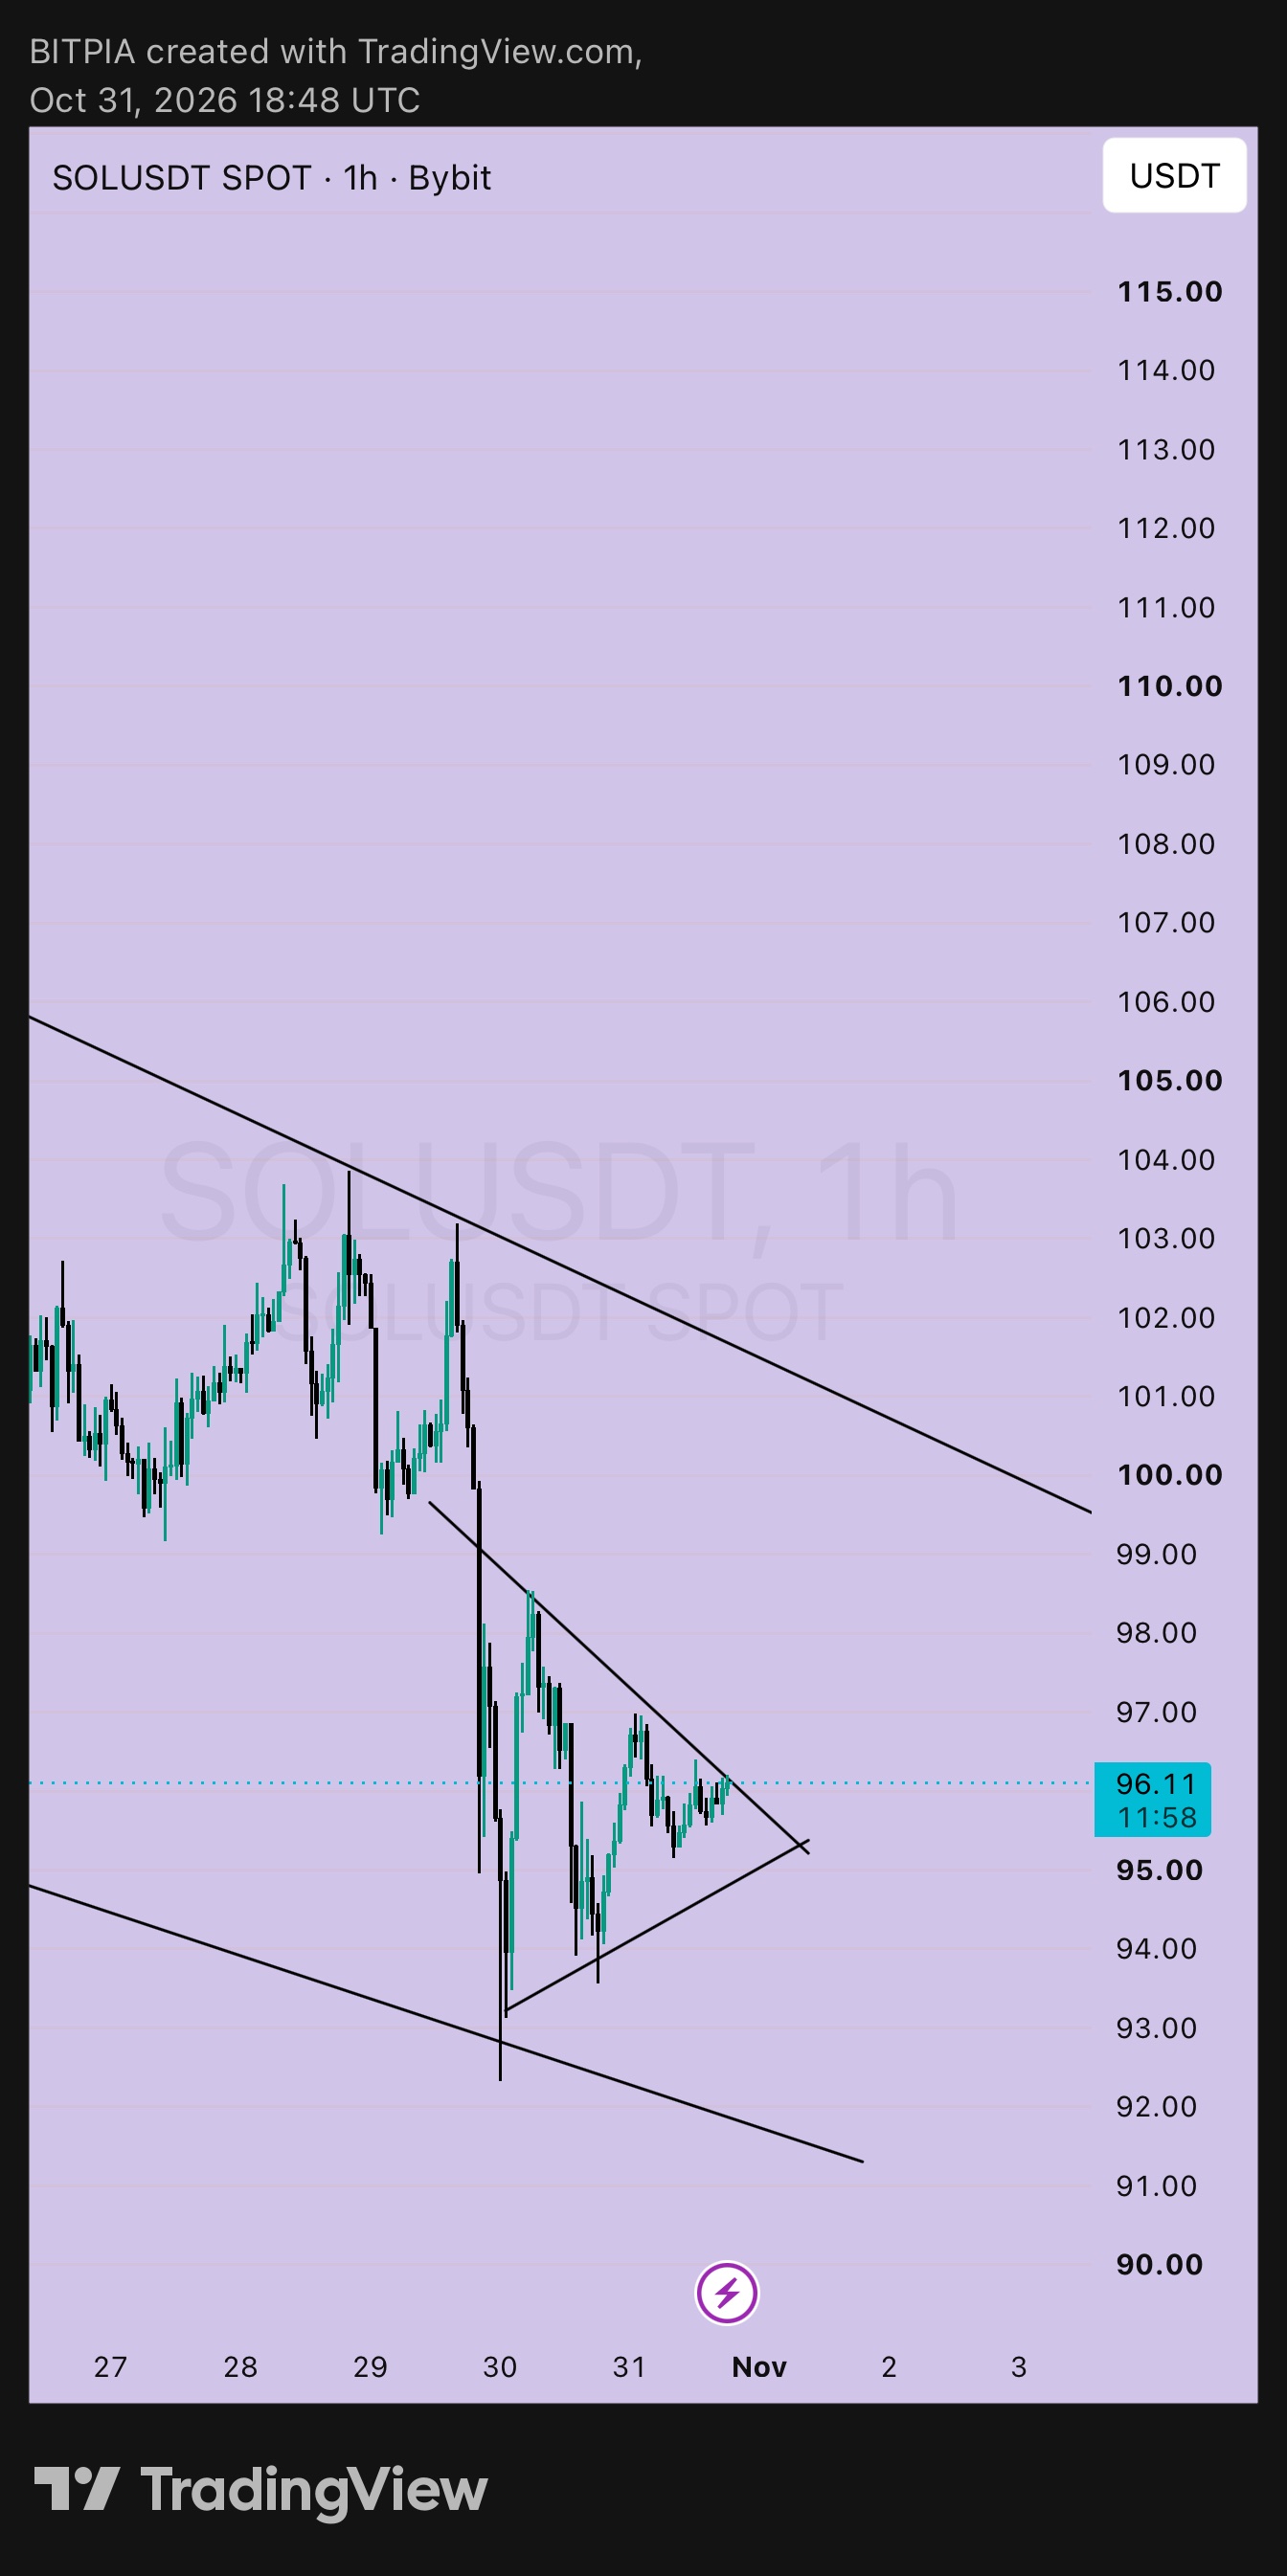
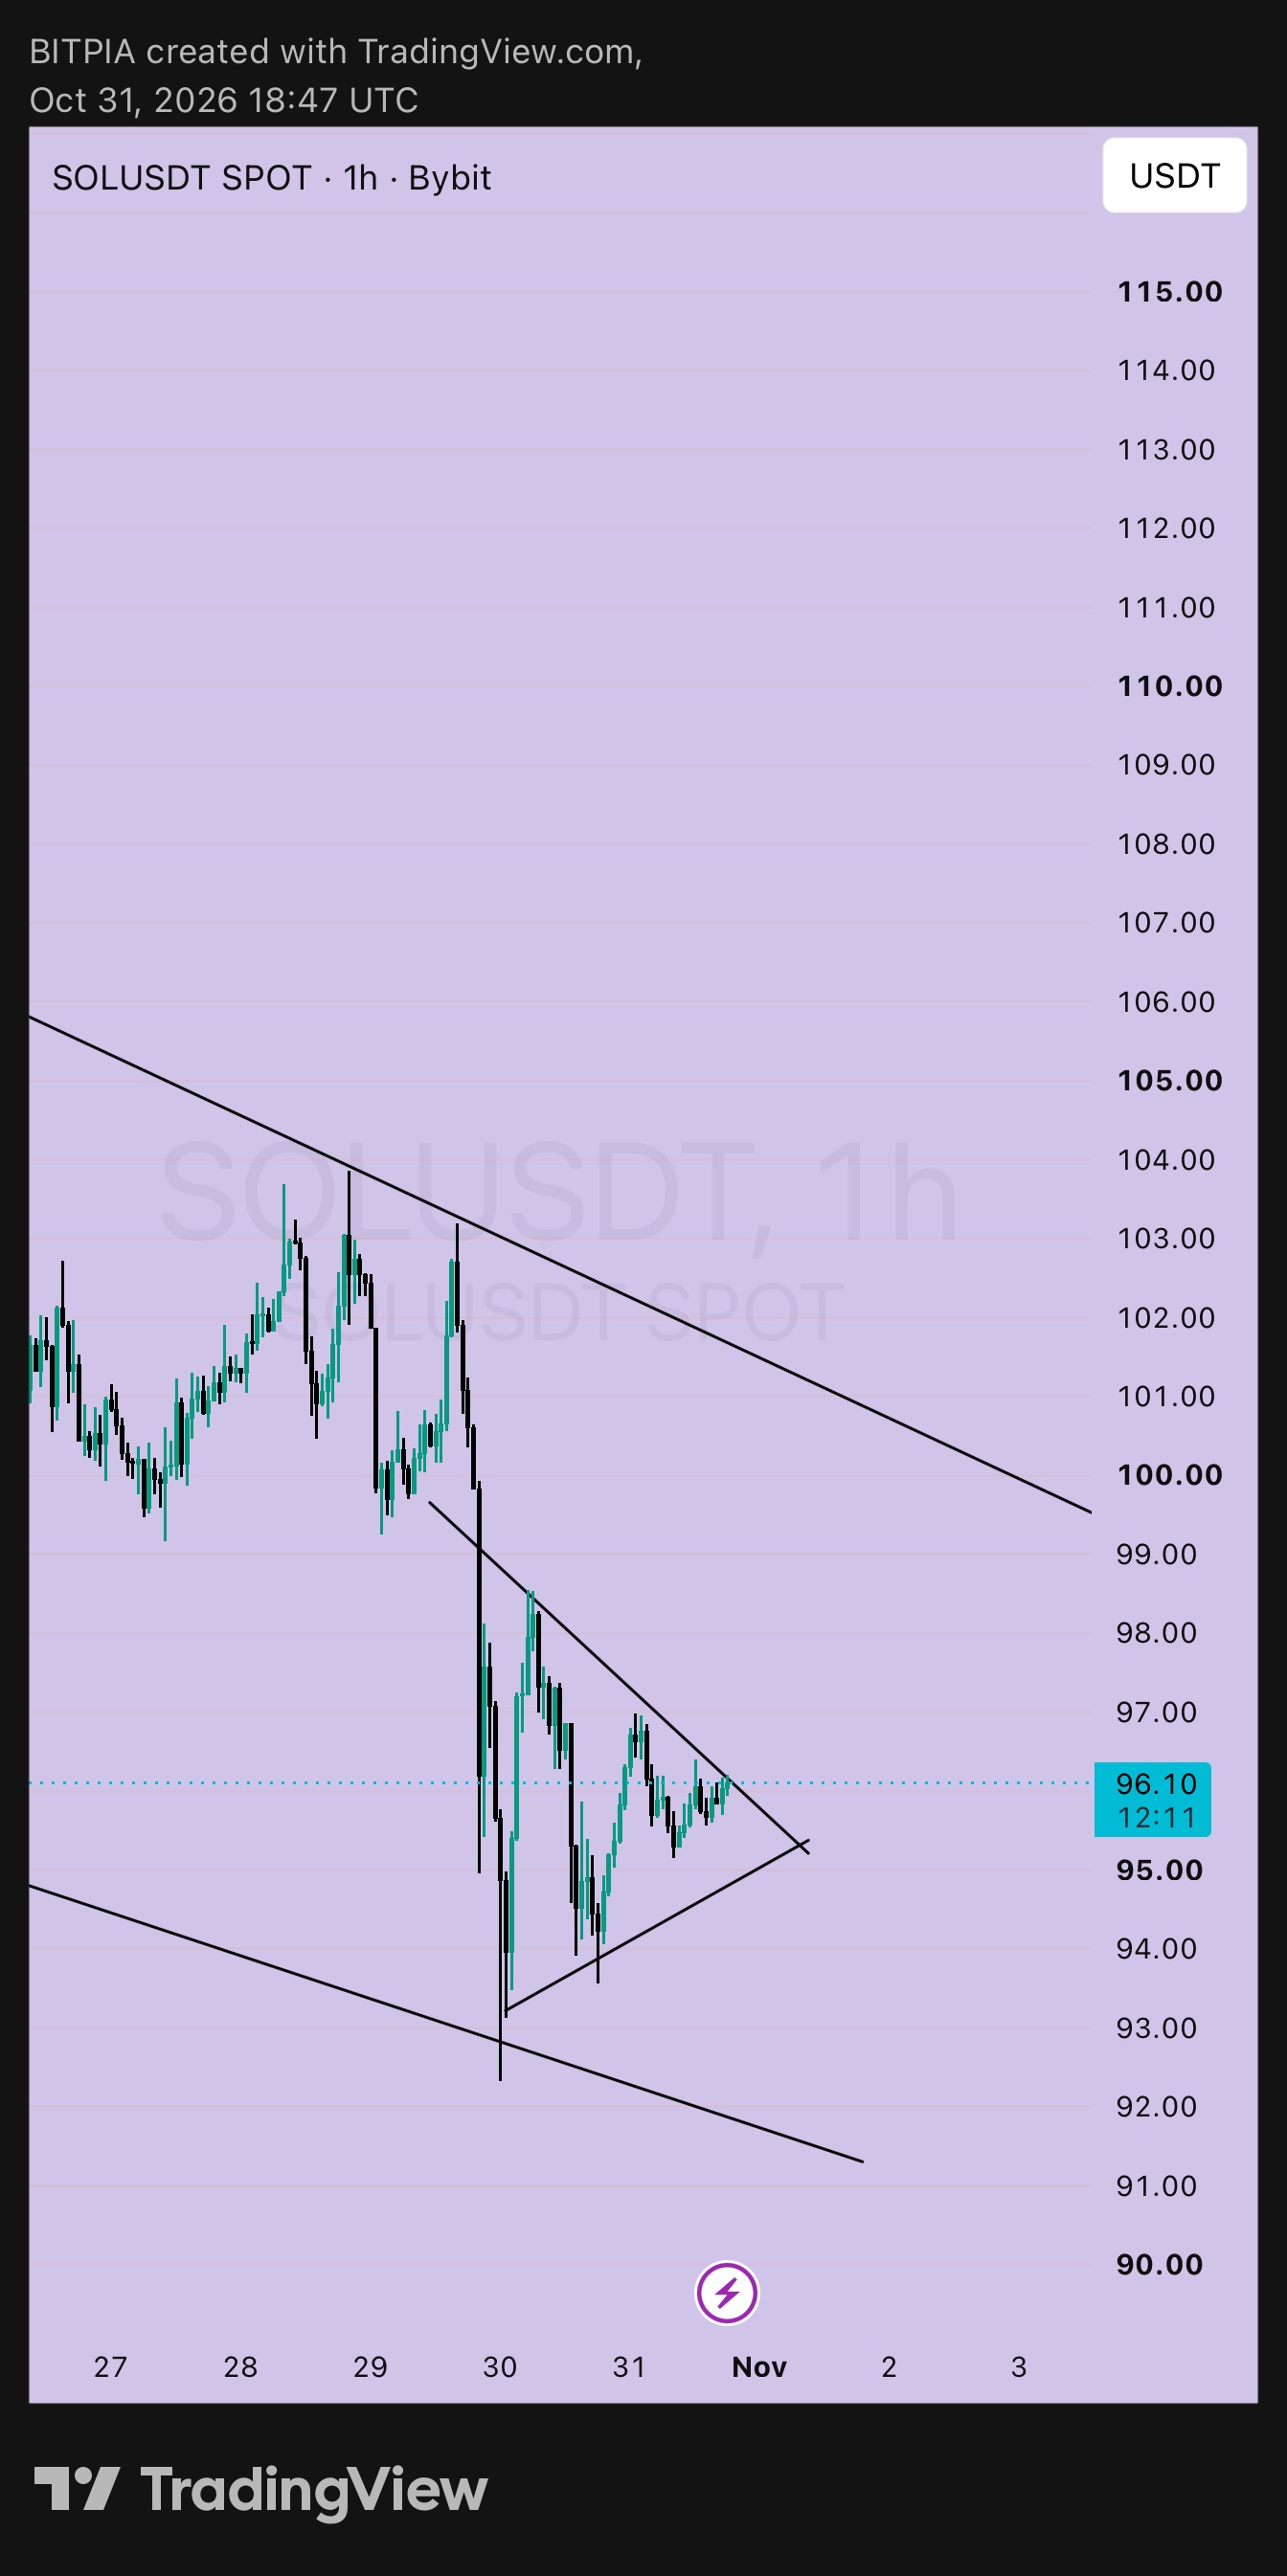
$SOLUSDT is squeezing into the tip of a triangle, and that triangle sits inside a bigger falling channel. Two patterns, one question: which one wins? The setup SOL dumped from about 103 to a wick low near 92.3, then started building a small triangle with lower highs (98.5, then 97.0) and higher lows (93.7, then 94.8). Price is now at 96.11, pressing the upper line, and there isn't much room left before the lines meet. Why I care Compression like this doesn't last. The tighter it gets, the more likely a decent move follows. The catch is the bigger picture: the channel is still pointing down, so the bias leans bearish until buyers prove otherwise. If it breaks up ▸ Trigger: a 1h close above 97.5 ▸ Confirmation: a retest of 97.0 that holds ▸ Target: about 102.3 (the triangle's height added to the breakout) ▸ Watch out: 100 to 101 is where the channel's upper line meets old support, so expect sellers there If it breaks down ▸ Trigger: a 1h close below 93.7 ▸ Target: about 88.9 ▸ Then: the channel's lower line near 91 to 92 is the first place buyers might show up The numbers A long on the retest at 97.0 with a stop at 95.0 risks about 2.1% for about 5.5% at 102.3, roughly 2.6 to 1. A short on a breakdown at 93.5 with a stop at 95.2 risks about 1.8% for about 4.9% at 88.9, roughly 2.7 to 1. Buying right now at 96.11 with a stop at 93.5 risks about 2.7% for about 2.5% to 98.5, which is a worse trade than either. My rule for this one Let a candle close decide. Triangles love to fake out one side before going the other way, so I'd rather pay a little extra for confirmation than guess the direction. If you're trading a perp, keep leverage low. A squeeze like this can release fast. Not financial advice, just how I'm reading it. DYOR and only risk what you can afford to lose. #WSOT2026 #IMPACTbyTrade
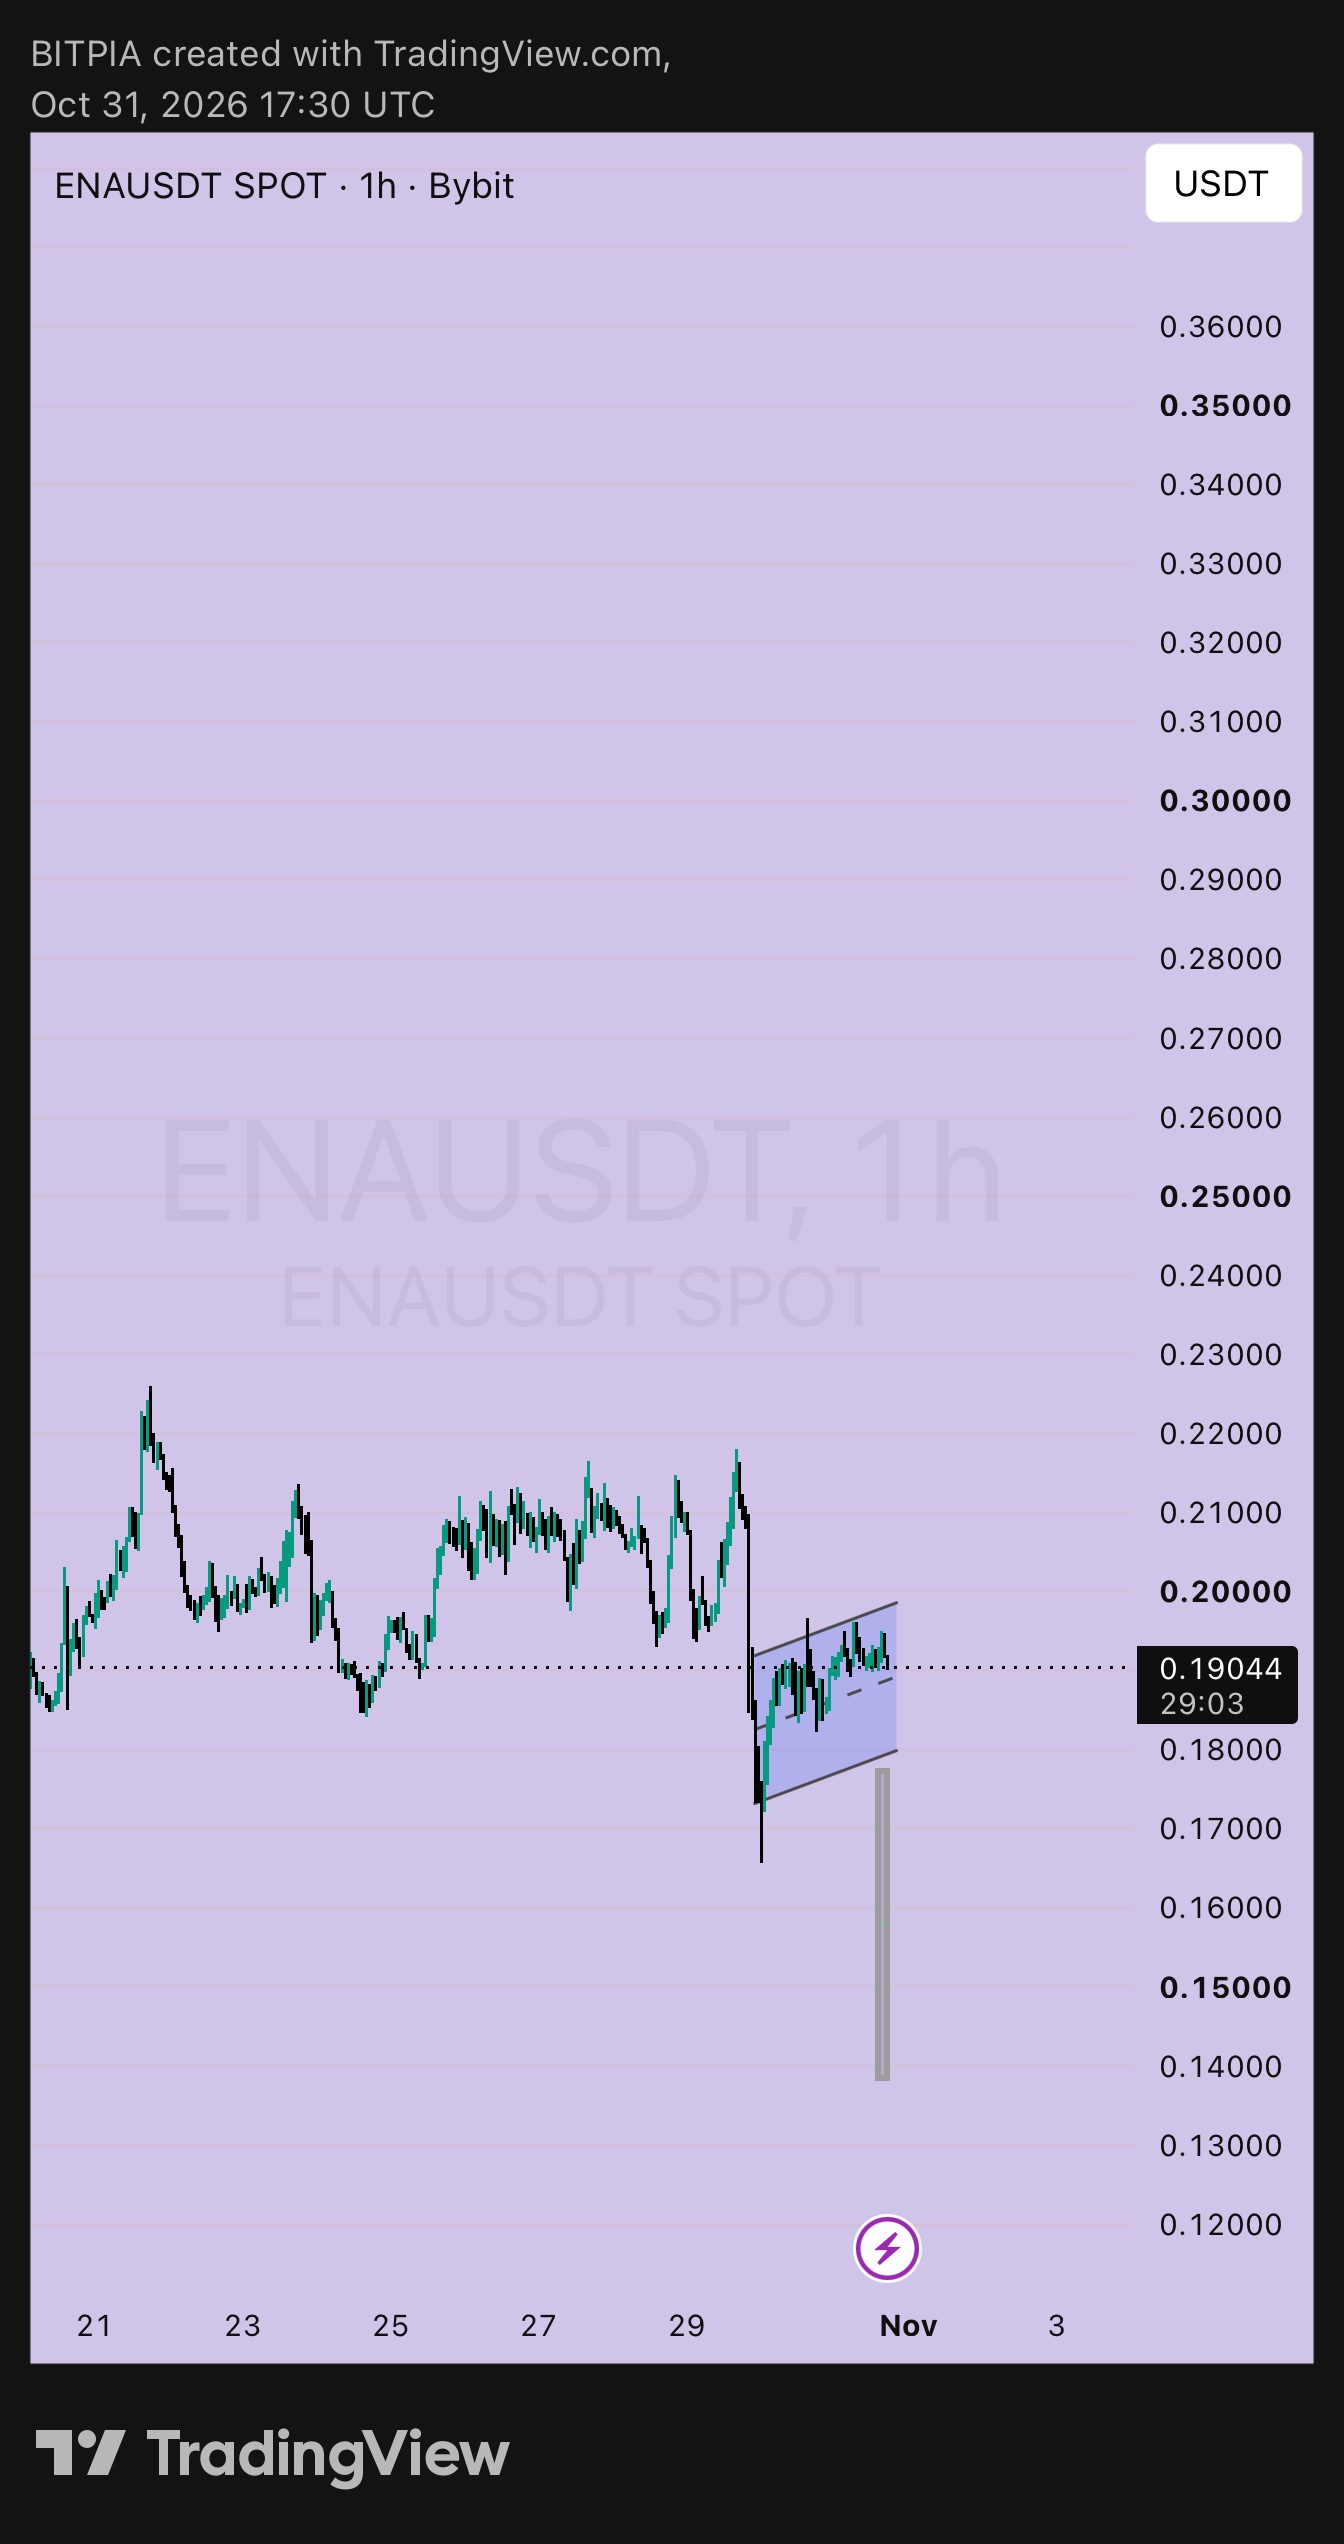
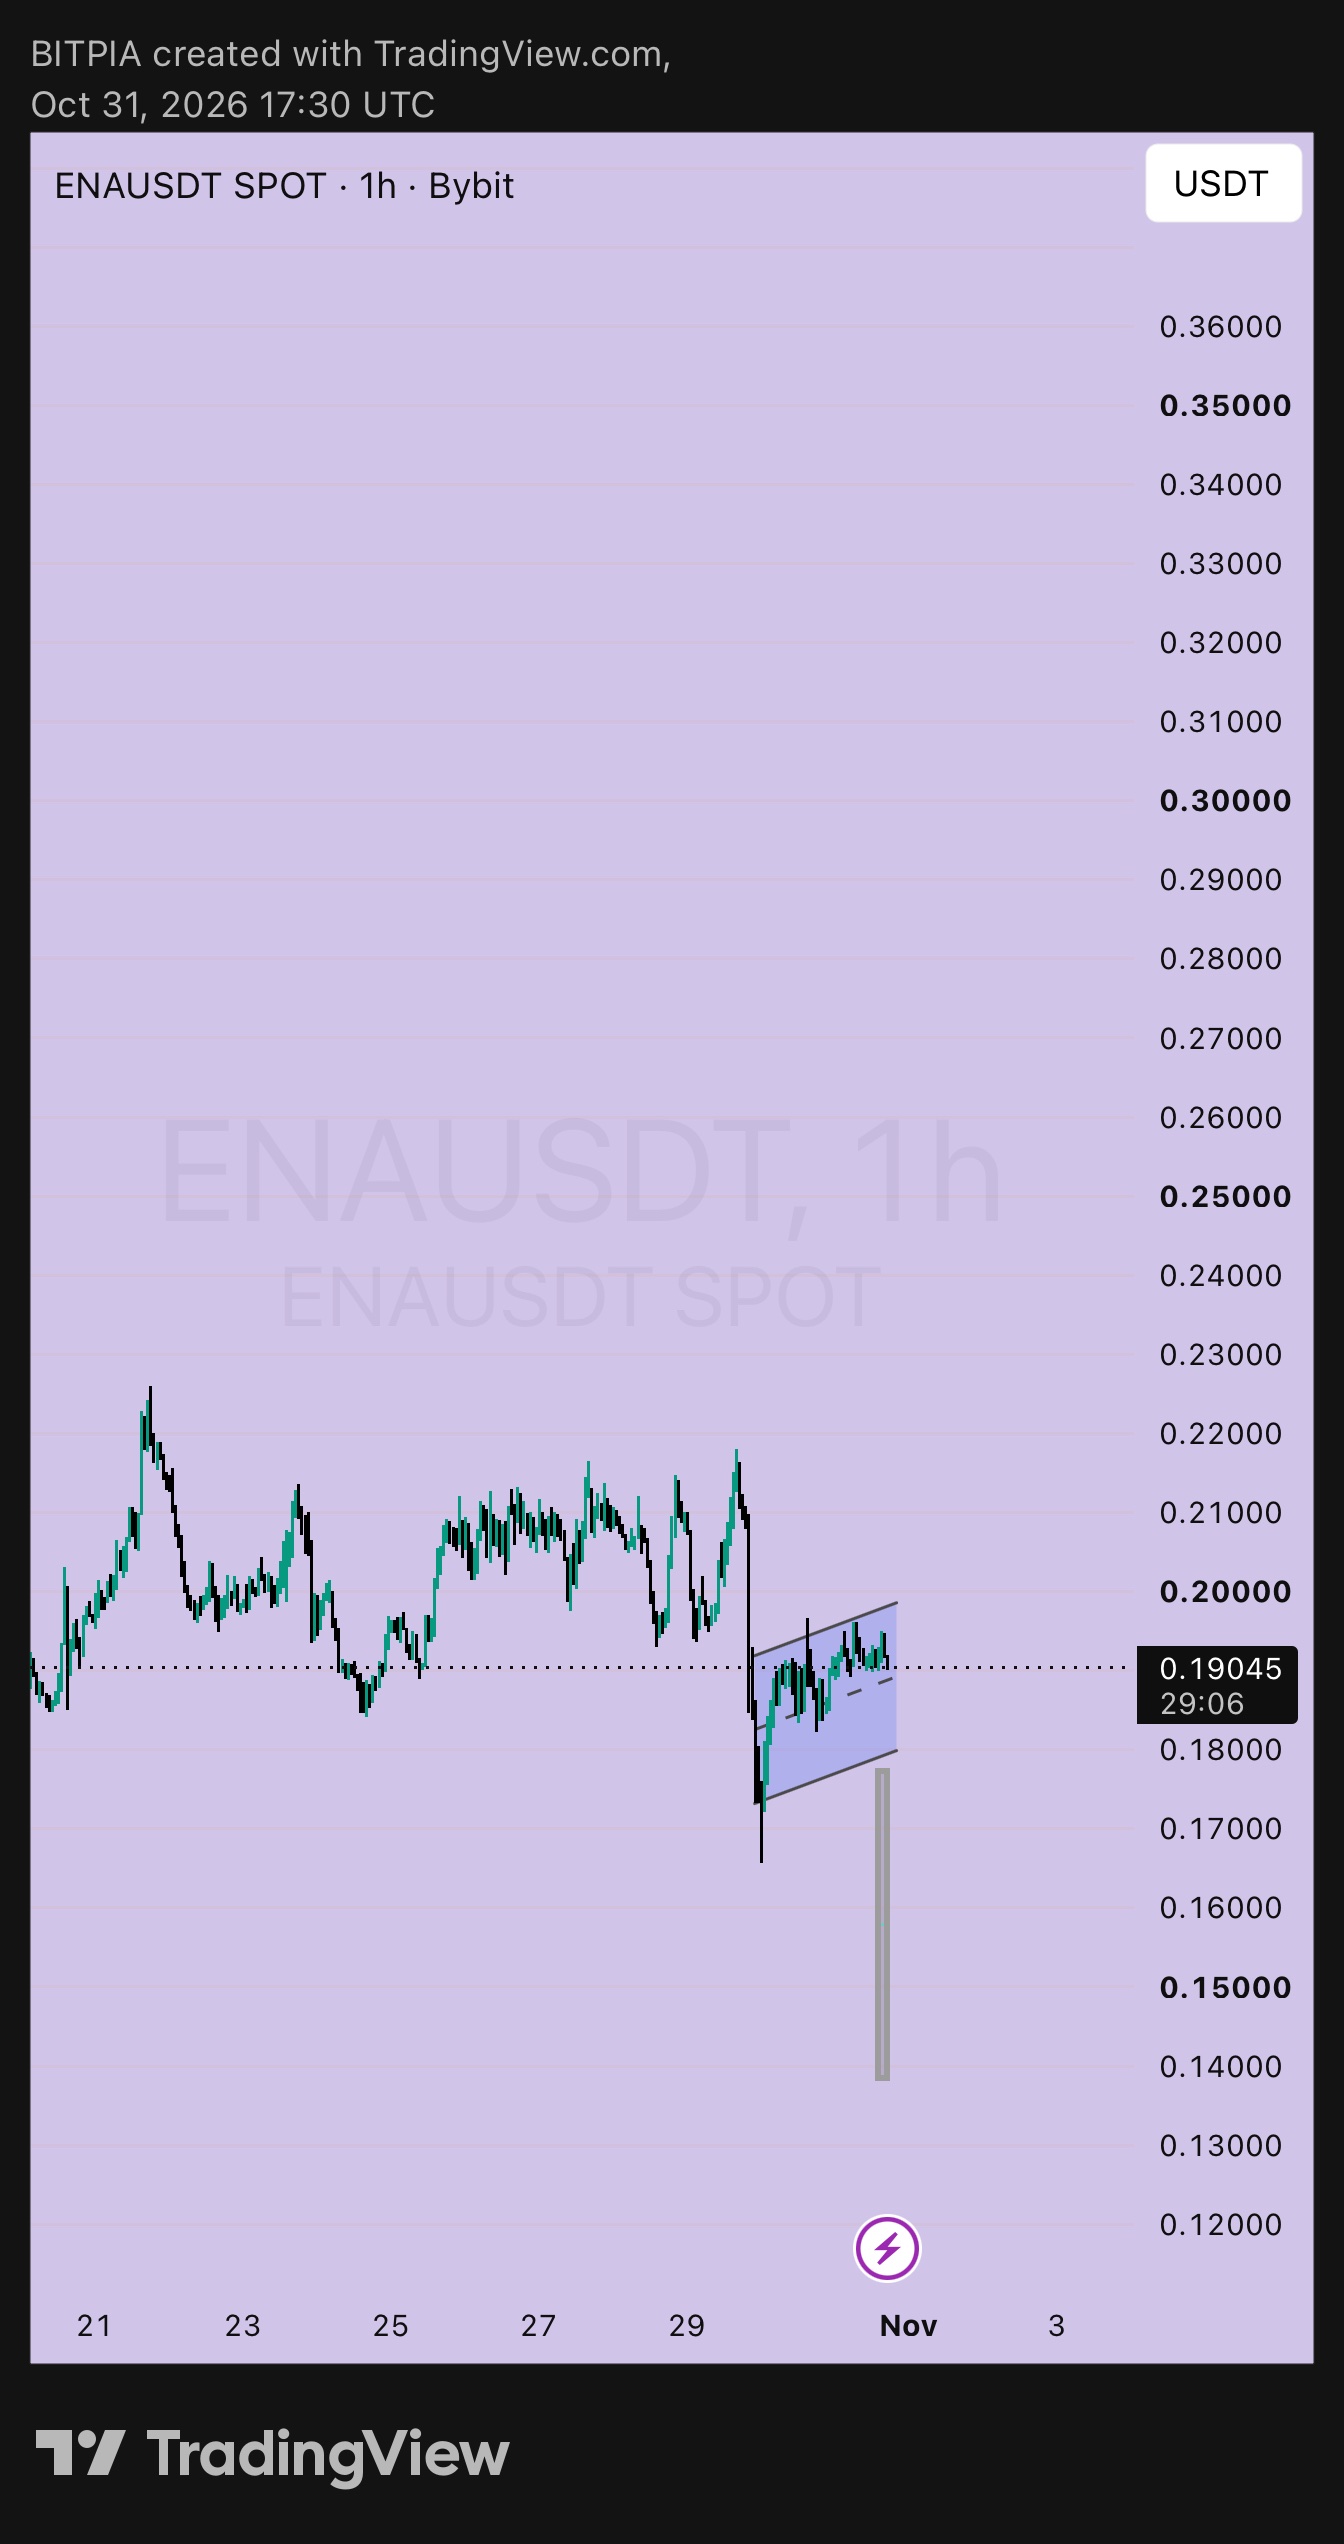
After my Oct 29 post, $ENAUSDT did what I said it might, then overshot. Price pushed through the 0.1745 low, wicked to about 0.166, and has since climbed back to 0.19044. It's now grinding sideways in a small rising channel, roughly 0.180 to 0.1985. That sideways drift after a sharp drop is the flag, and the drop is the pole. Where I agree ➤ The pole is clean: a vertical drop from about 0.2185 with no real bounces ➤ The flag is drifting up on low-energy candles, which is typical when sellers are just pausing ➤ The projected target near 0.139 is the pole's length measured from the bottom of the flag Where I'd push back ➤ The flag is built after a wick below 0.1745 that got bought straight back, so buyers showed up once already ➤ Price has reclaimed the old 0.178 to 0.184 zone, which was my line for "sellers still in control" ➤ A flag only counts after it breaks. Until then it's a guess Levels ▸ Flag top: about 0.1985 ▸ Flag bottom: about 0.180 ▸ Wick low: about 0.166 ▸ Bear flag invalidation: a 1h close above 0.2035 ▸ Downside target: about 0.139, with 0.150 as a first stop ▸ Bull case needs: a close above 0.2185, the pole's origin The numbers If the flag breaks and you short 0.178 with a stop at 0.187, you risk about 5.1% for about 21% to 0.14, roughly 4.2 to 1. A short from the top of the flag near 0.1975 with a stop at 0.2035 risks about 3% for about 29%, but that needs price to get there first. Long here at 0.19044 with a stop under 0.1735 risks about 8.9% for about 14.7% to 0.2185, only 1.65 to 1. That's the least attractive of the three. My read: the middle of the flag is a no-trade zone for me. I'd wait for a 1h close below 0.180 or a rejection at 0.1985, and if you trade this on a perp, keep leverage low because that wick to 0.166 shows how fast it moves. Not financial advice, just how I'm reading it. DYOR and only risk what you can afford to lose. #WSOT2026 #IMPACTbyTrade
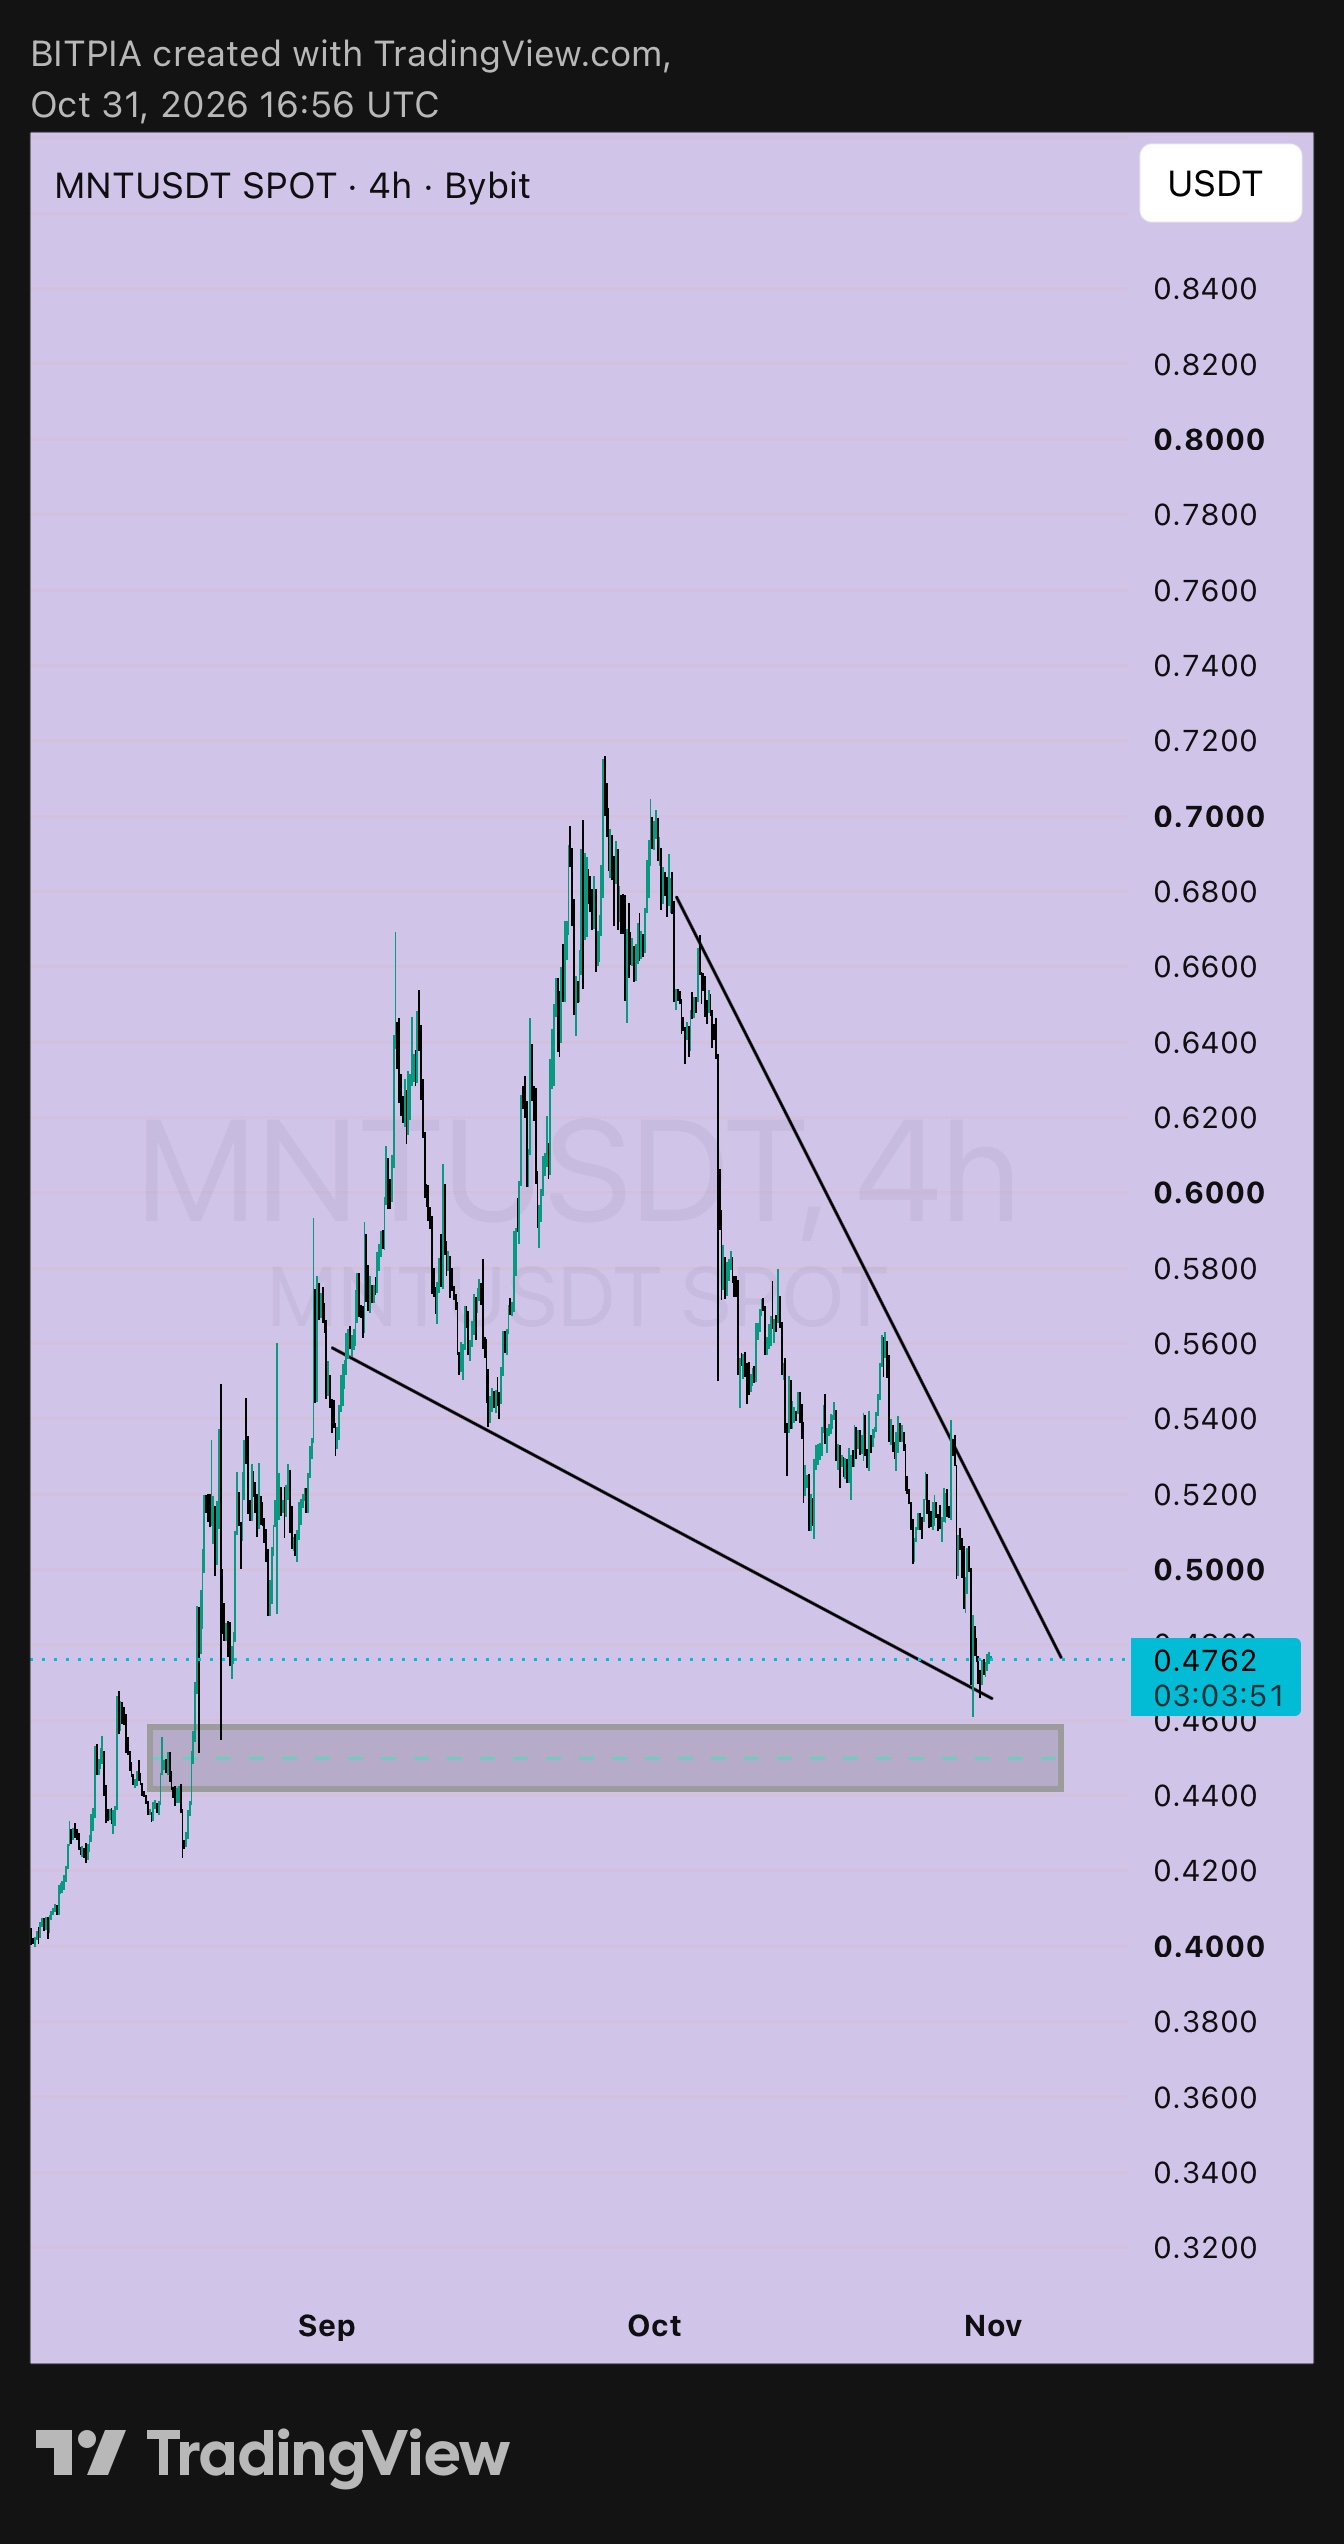
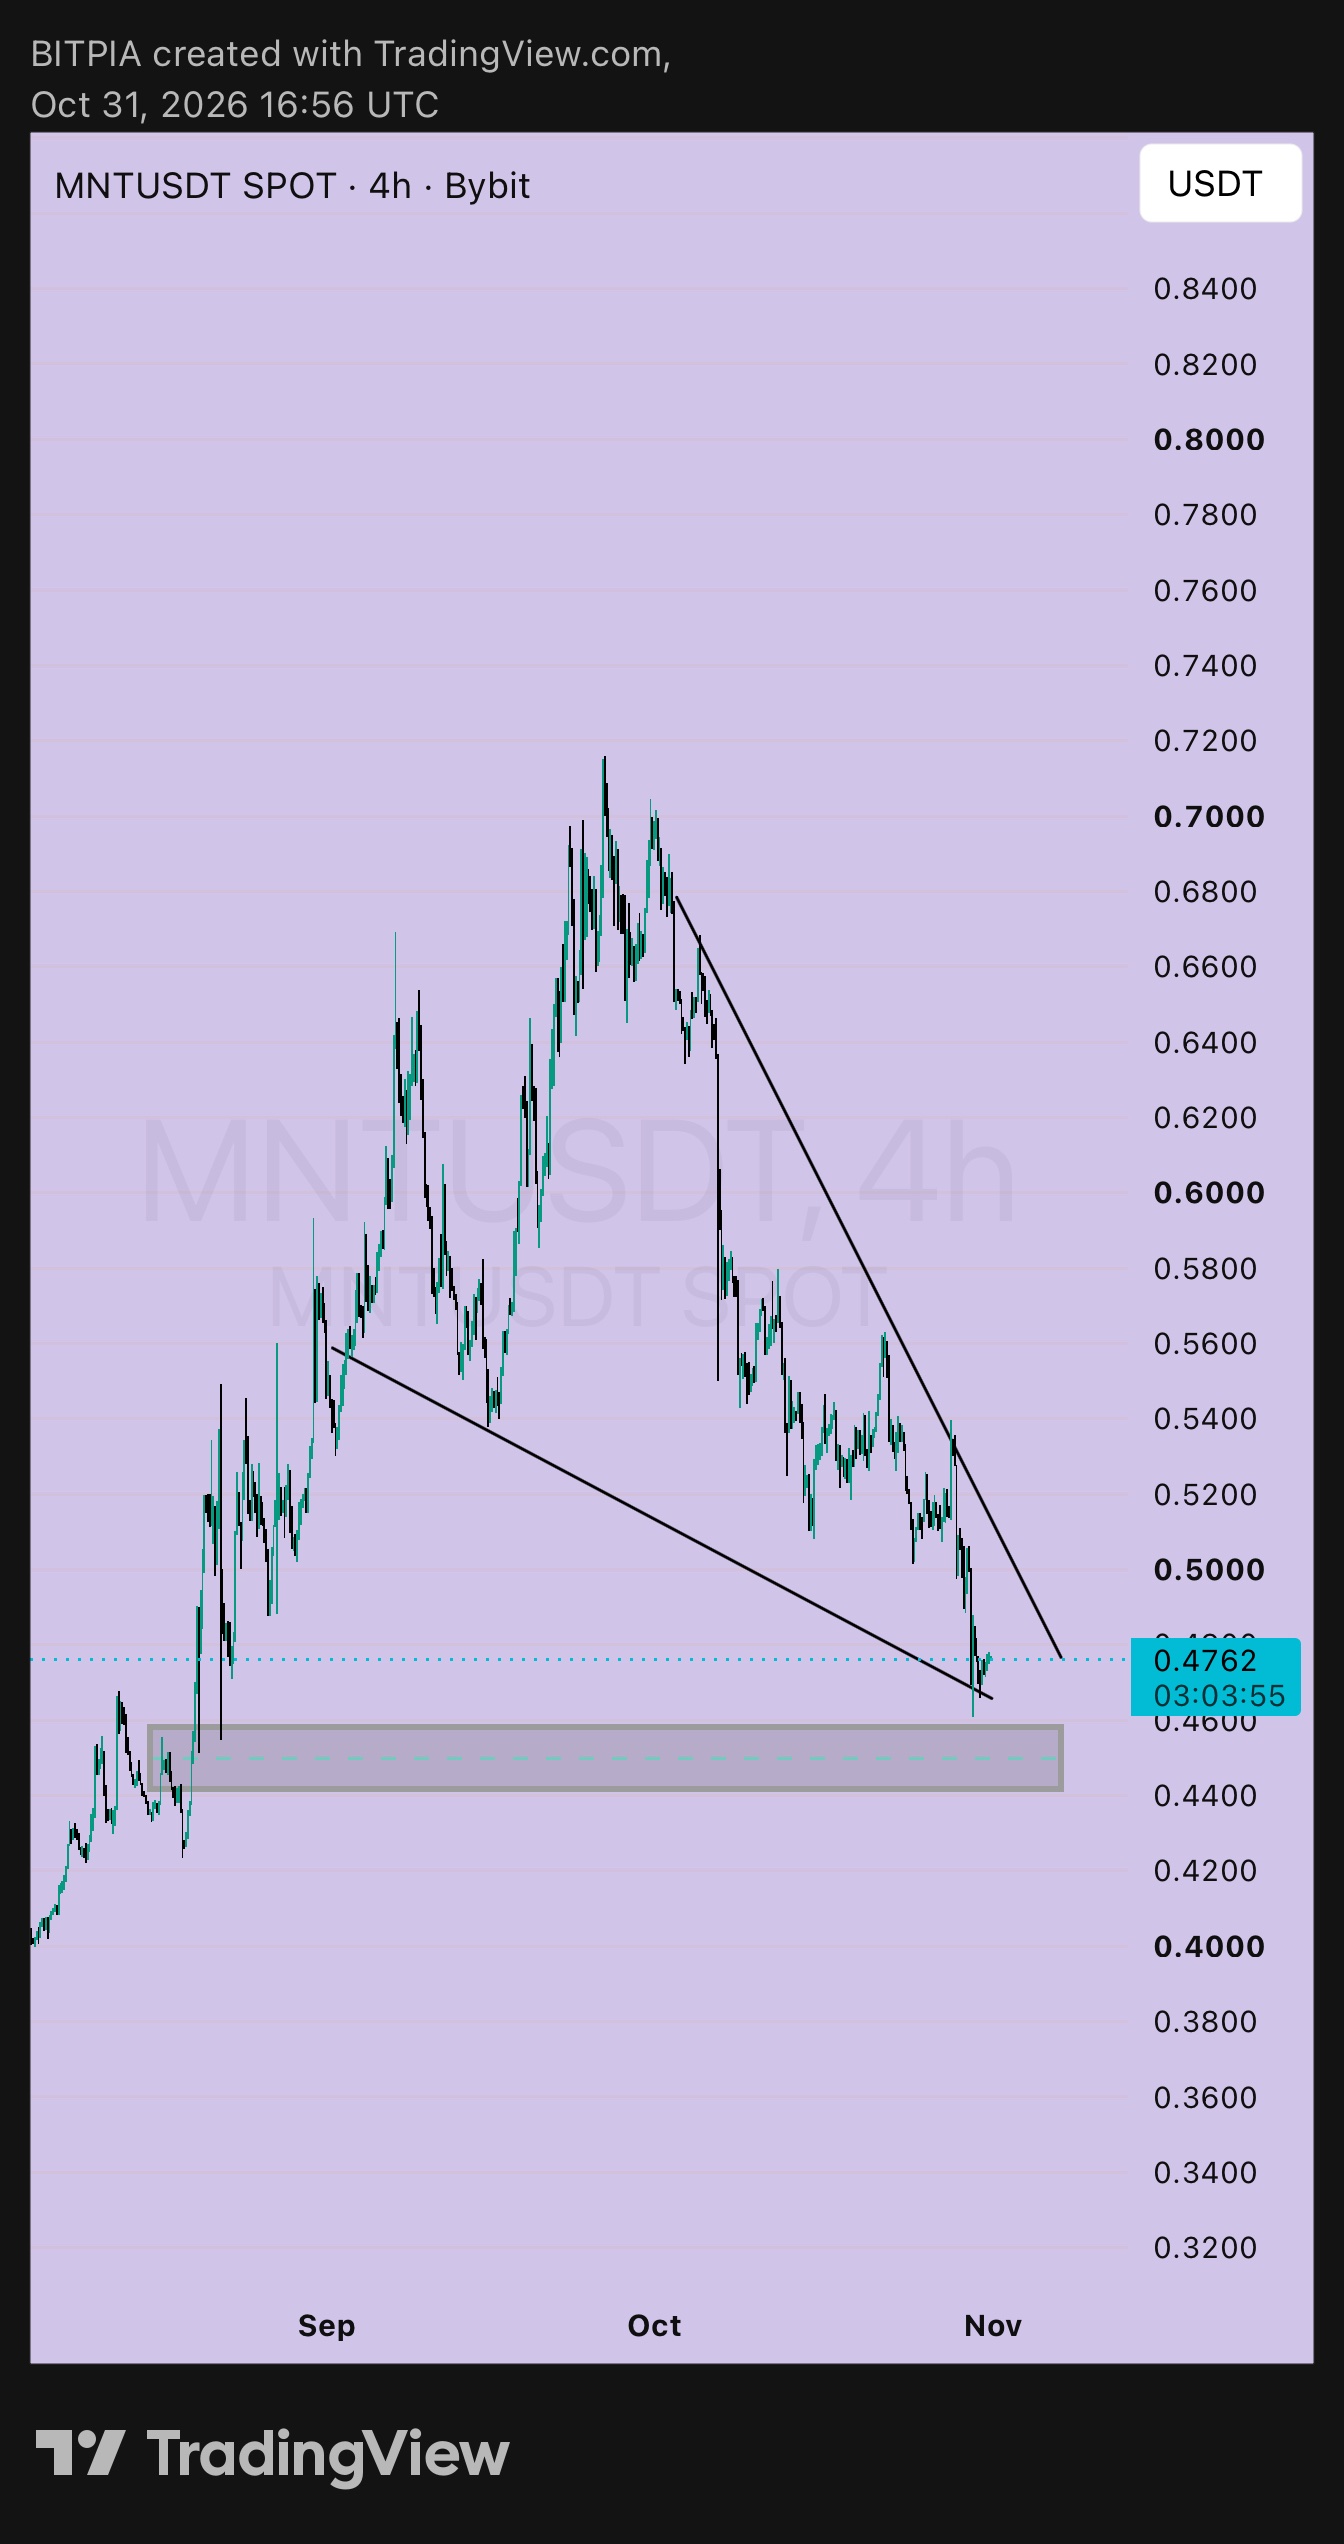
$MNTUSDT held the line I gave yesterday, so the falling wedge is still alive. Here's what changed since Oct 30 and what didn't. What held Yesterday I said a 4h close below 0.440 would kill the idea. Price dipped to about 0.461 today, poked the lower wedge line, and bounced to 0.4762. It never came close to my invalidation. So the setup is intact, but it hasn't done anything yet. What changed ➤ The upper wedge line keeps sliding down. It's now around 0.50 to 0.51 and heading toward 0.48 by early November, so the breakout level is getting easier to reach. ➤ Price is squeezing tighter between the two lines, and wedges don't last forever. Something has to give soon. ➤ The 0.445 to 0.463 support box is right under price and just got its first touch this week. What didn't change It's still a downtrend until the upper line breaks. Falling wedges can break either way, and I don't get to pick. Levels I'm watching ▸ Support: 0.445 to 0.463 ▸ Invalidation: a 4h close below 0.440 ▸ Breakout trigger: a 4h close above the upper wedge line, around 0.505 to 0.51 ▸ Targets: 0.5235 to 0.526, then about 0.56 The math Buying here at 0.4762 with a stop at 0.438 risks about 8% to gain about 9.9% at 0.5235. That's 1.2 to 1, which doesn't excite me. A dip toward 0.465 with the same stop risks about 5.8% for about 12.6% to 0.5235 or about 20.4% to 0.56. That's roughly 2.2 to 1 and 3.5 to 1. Same wedge, and the entry is the whole difference. My plan Small size, no rush. I'd rather buy a touch of the lower line or wait for the breakout close than chase the middle of the squeeze. And if 0.440 goes on a 4h close, I'm out with no arguments. Not financial advice, just how I'm reading it. DYOR and only risk what you can afford to lose. #WSOT2026 #IMPACTbyTrade
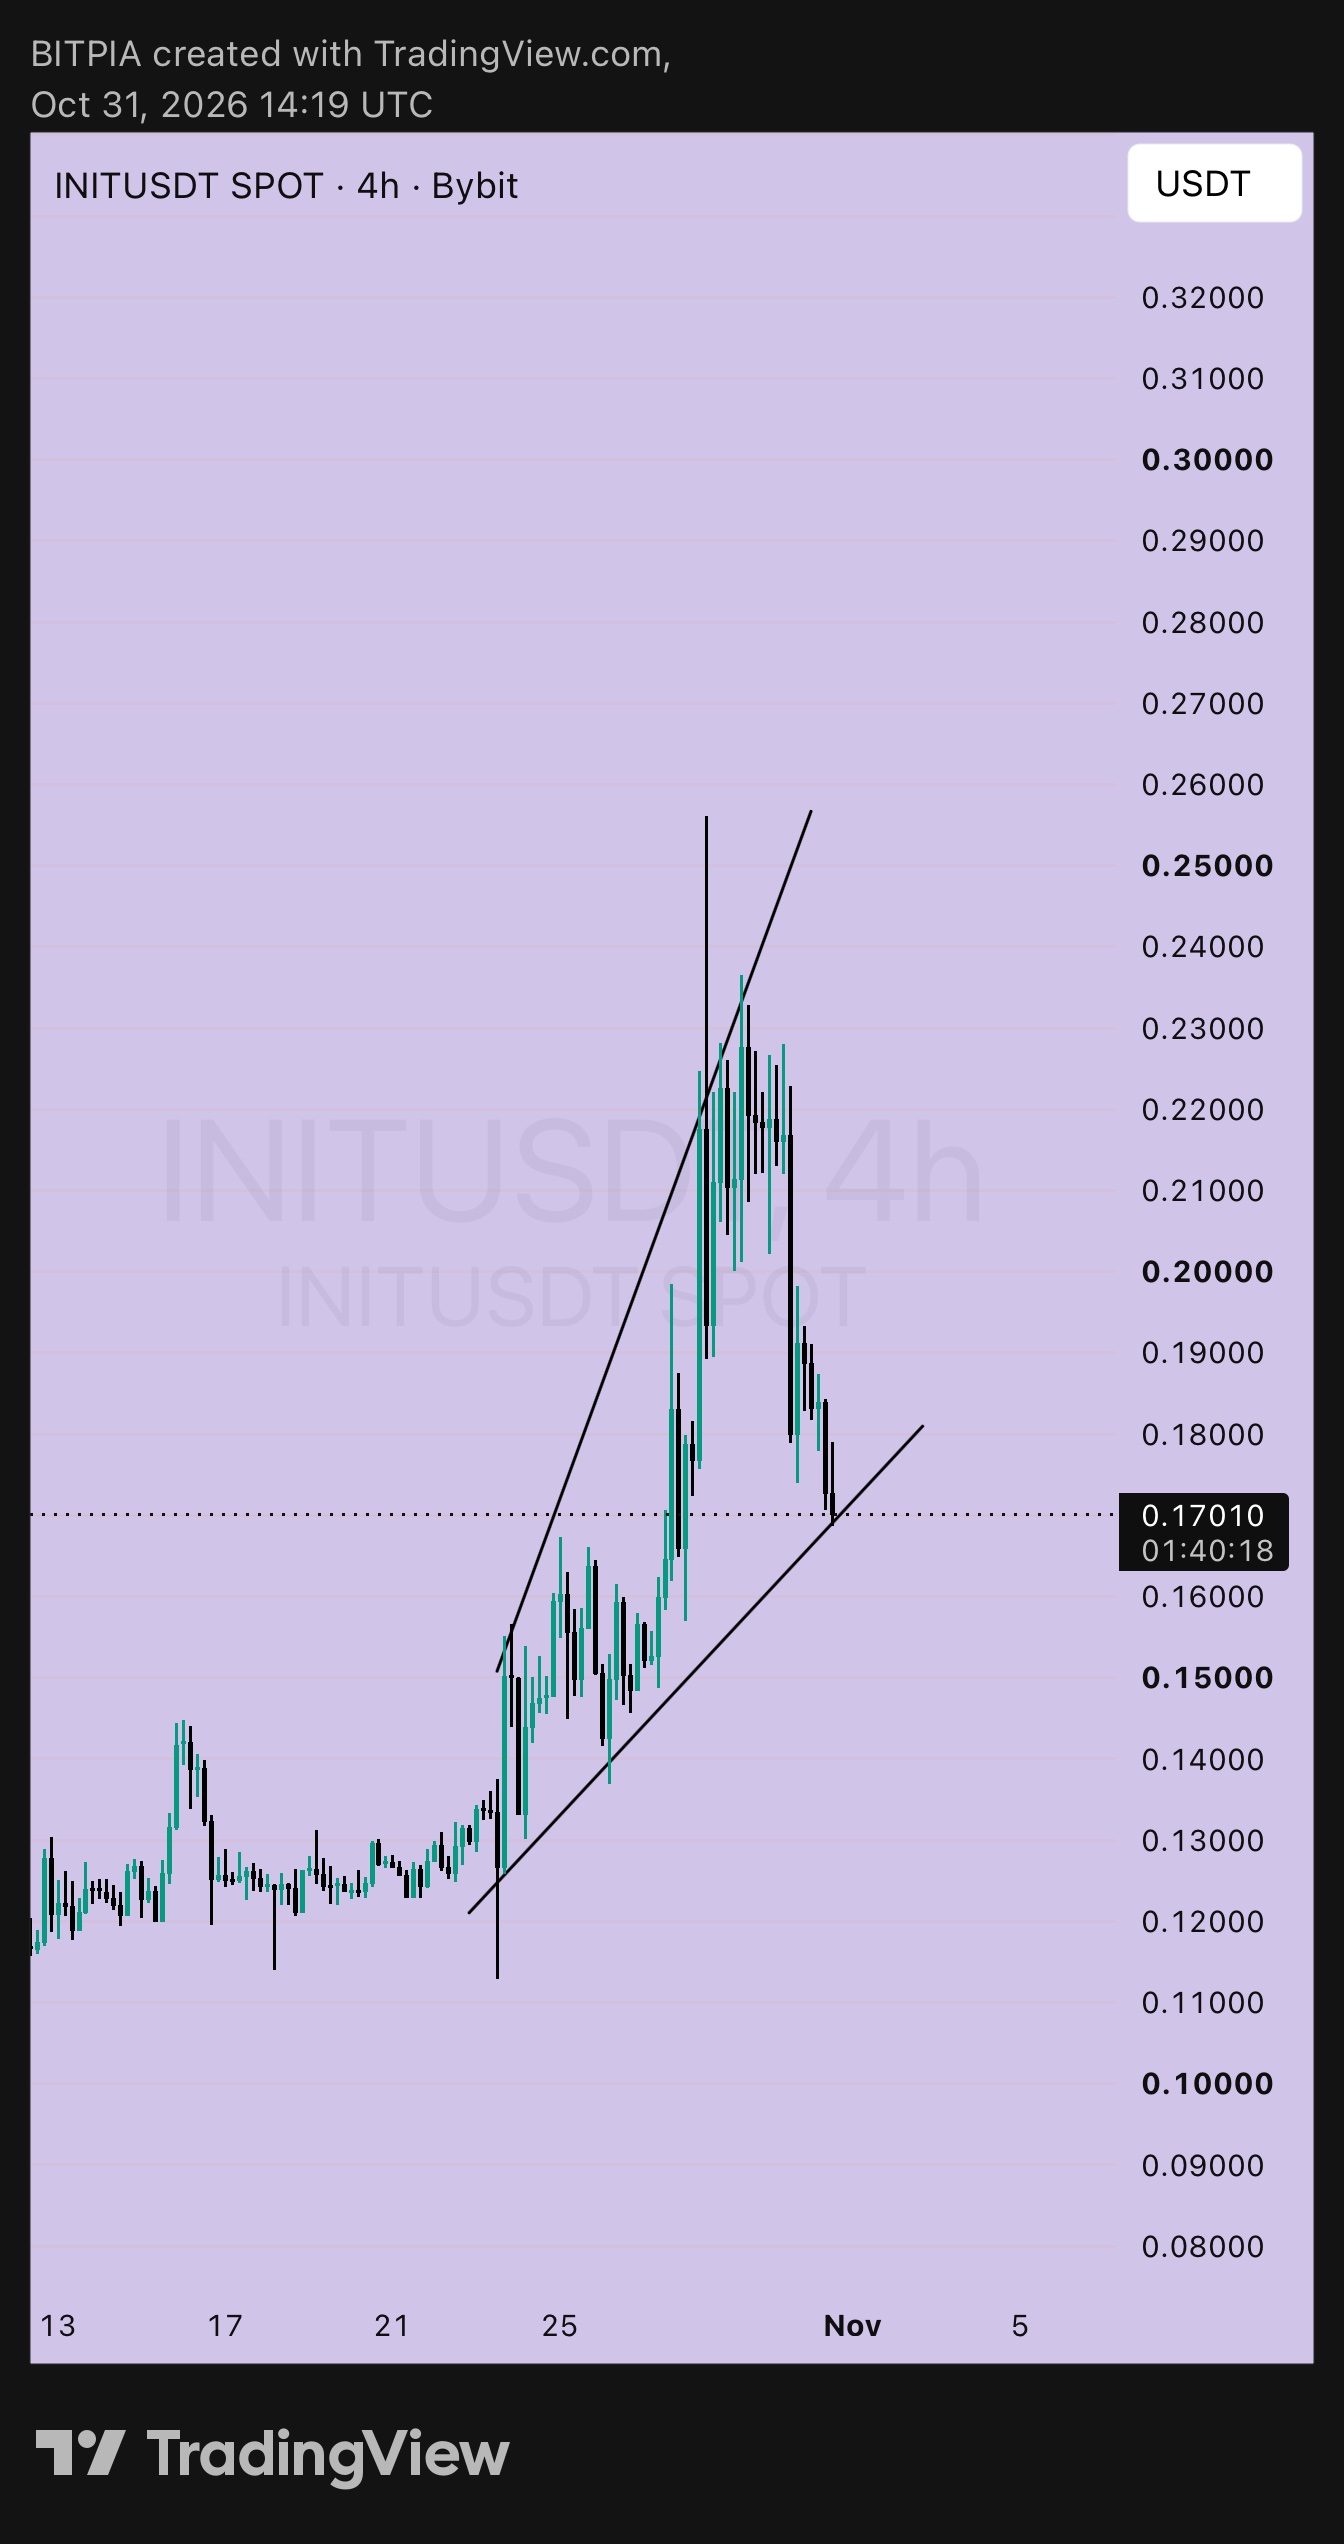
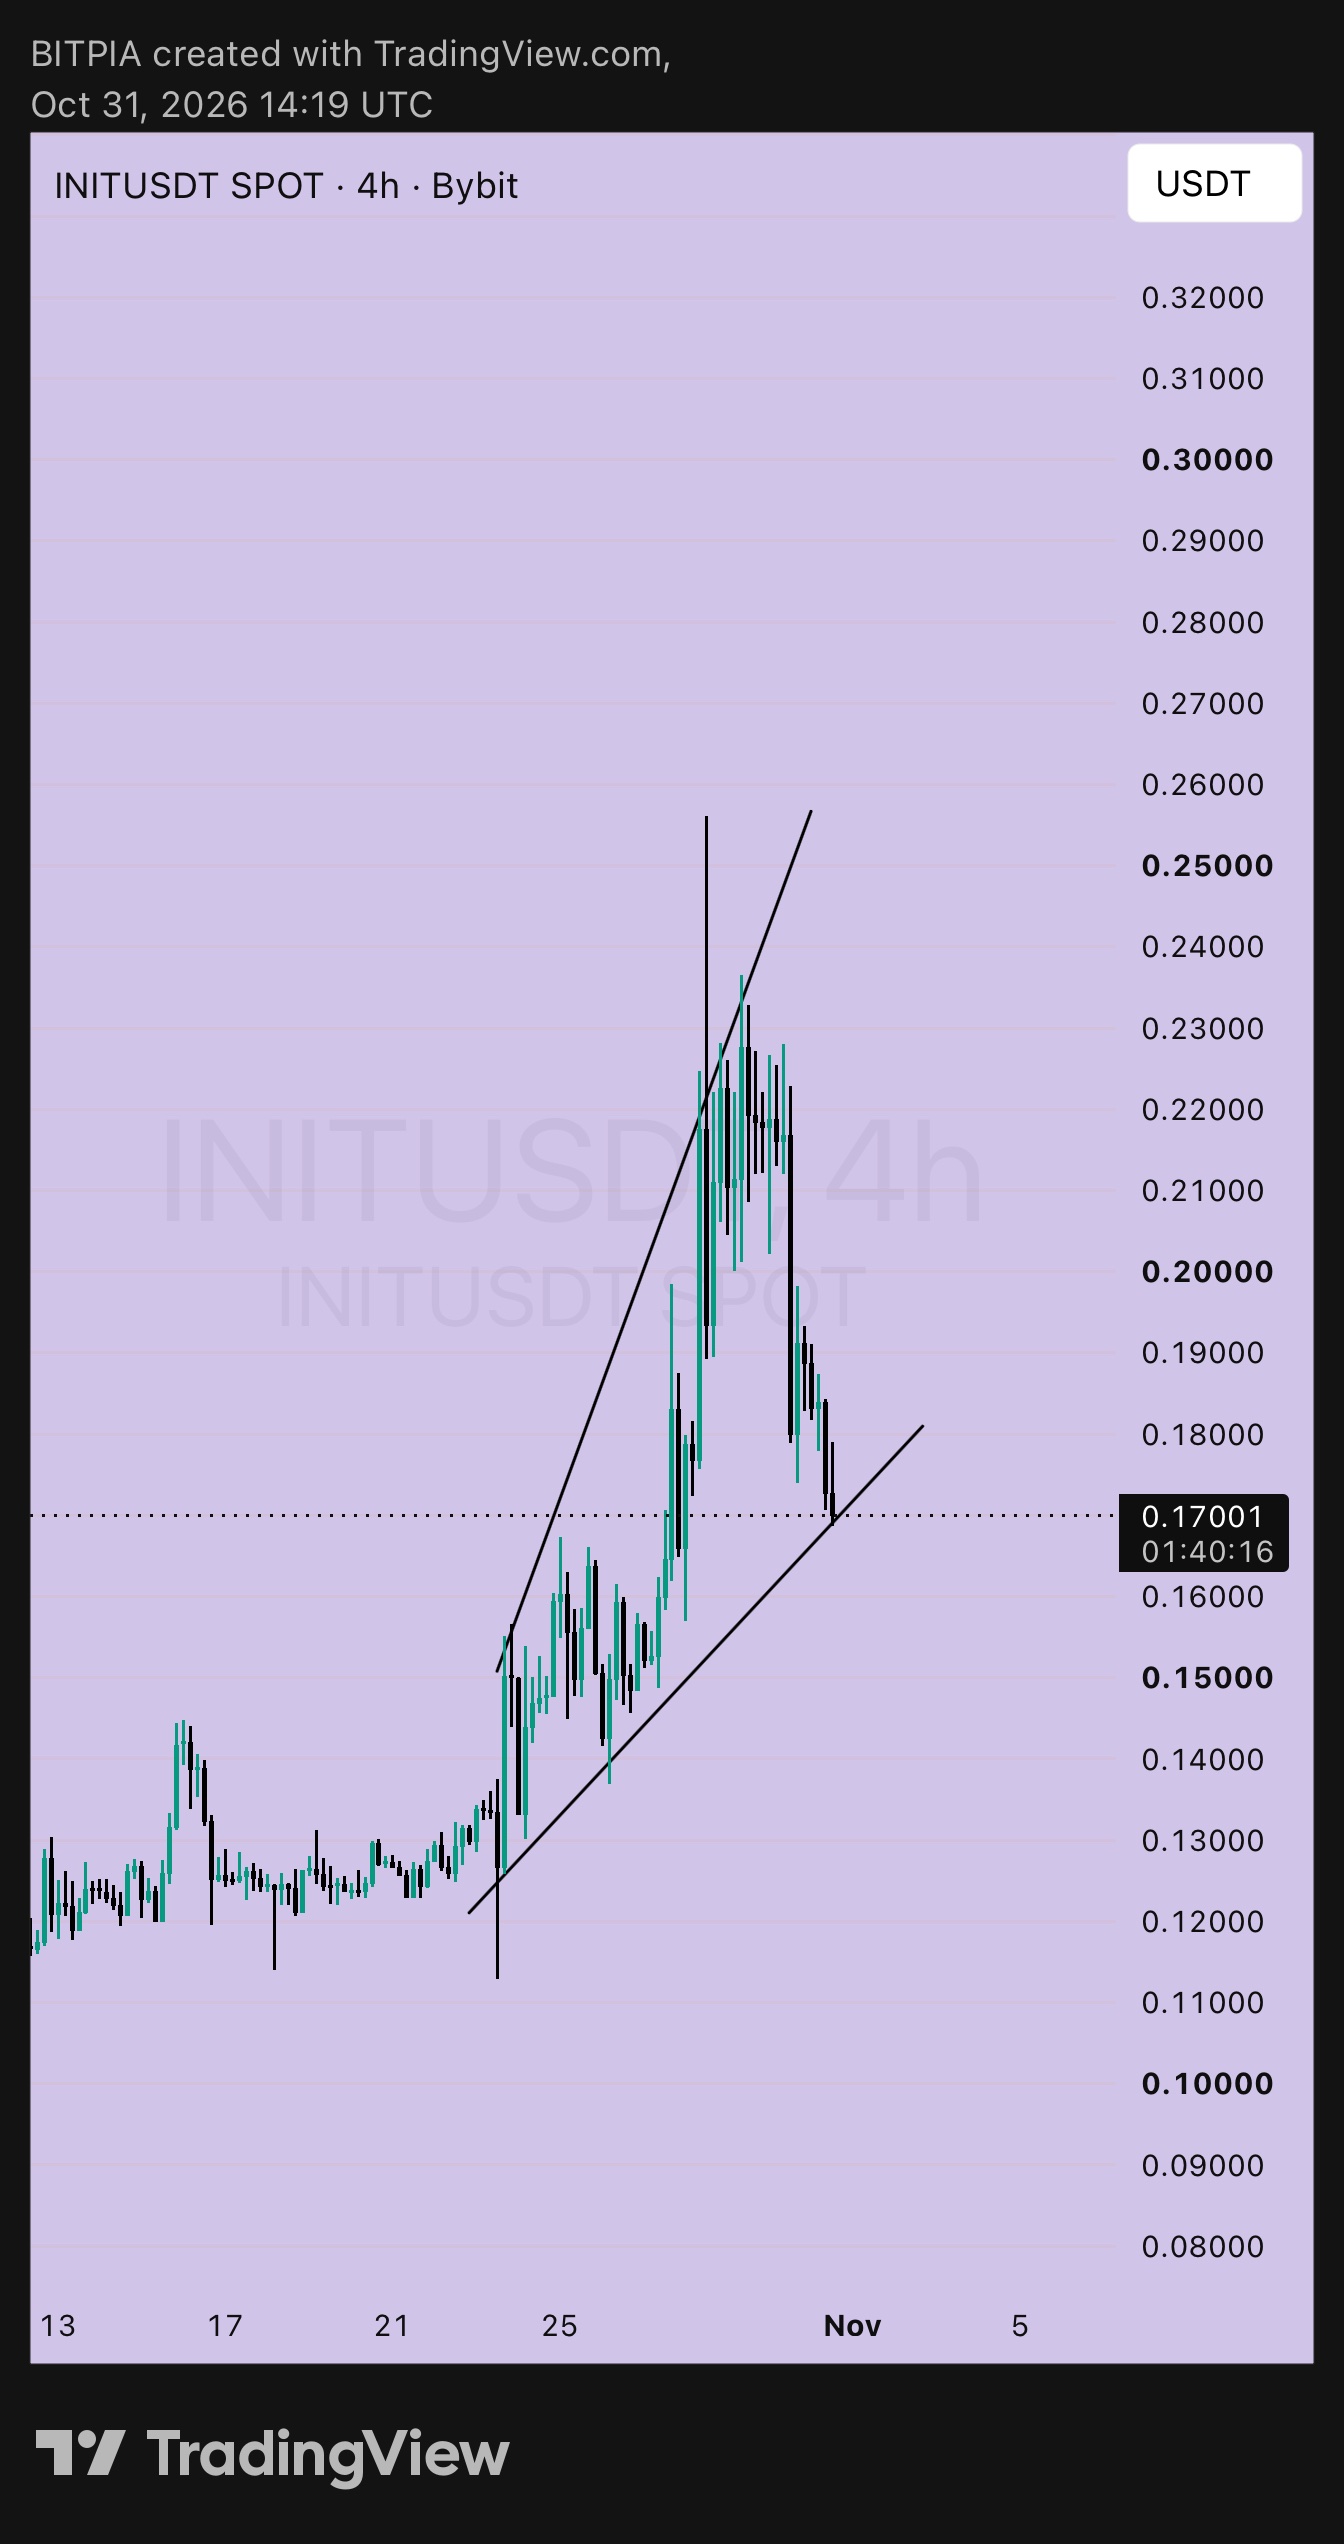
$INITUSDT is sitting on its trendline, and I got the last call wrong, so let me lay out the timeline. Oct 27: price was 0.1855 and I wanted a retest of the broken channel line. Oct 29: price was 0.2109 and I called 0.205 to 0.208 the line to hold, with a 1h close below 0.195 as my invalidation. Today: price is 0.17001. That 0.195 line got taken out, so the idea failed. From the 0.2109 reference, the stop would have cost around 7.5%. That's what stops are for, and I'm not going to pretend otherwise. Here's what the 4h chart shows now. The spike to about 0.256 got sold hard, and price has fallen back more than 33% from the high. It's now sitting right on the rising trendline from the 0.126 base, which is the last real line of defense for the whole October move. The upper line of that steep channel is way behind us. What I see ➤ The trendline is being tested for the first time since the spike, so nothing is confirmed either way ➤ The drop was one-directional with almost no bounces, which usually means sellers are still in control ➤ Below this line, the next real support is the 0.141 to 0.155 area from the Oct 25 and 26 dips Levels I'm watching ▸ Trendline support: 0.168 to 0.170 ▸ Invalidation: a 4h close below 0.162 ▸ Next support: 0.150 to 0.155, then 0.141 ▸ Resistance: 0.185 to 0.190, the area it broke down from ▸ Bigger resistance: 0.205 to 0.211, then 0.2275 Two ways to trade it Catching the bounce at 0.170 with a stop at 0.158 risks about 7.1% to gain about 11.8% at 0.190, roughly 1.7 to 1. It's fine, but not great, and it's a bet on one line holding. The cleaner version is to wait for a 4h close above 0.185 and a retest that holds. A stop at 0.172 risks about 7% for about 23% to 0.2275, close to 3.3 to 1, and you get proof that buyers are back before you pay. My plan is to sit on my hands. A coin that just dropped a third in three days doesn't need me catching it. If the line breaks, I'd look to the 0.150 area, and if it holds, I'd rather pay a bit more for confirmation. Not financial advice, just how I'm reading it. DYOR and only risk what you can afford to lose. #WSOT2026 #IMPACTbyTrade
EVOP Metaverse | Atlantis: A Different Kind of Exploration Not every virtual world needs to look like a modern city. Some are built around the excitement of discovering what lies beneath the surface. That is what makes Atlantis interesting. As one of the eight worlds inside the EVOP Metaverse, it takes users into a deep-sea environment filled with opportunities for exploration and discovery. ➤ An underwater world with its own identity Atlantis features underwater landscapes, submarine highways, and ancient ruins. It creates an environment where exploration goes beyond simply moving from one location to another. ➤ More than just sightseeing The world is designed around activities such as researching, farming, mining, and exploring. These elements give users different ways to engage with the environment and discover what Atlantis has to offer. ➤ A different experience within one ecosystem What stands out to me is how each EVOP world brings a different atmosphere and experience. Elysium offers a floating city, while Atlantis takes a completely different direction with its underwater setting. This variety makes the EVOP Metaverse worth exploring. You are not limited to one type of virtual experience. @EvolveTKN

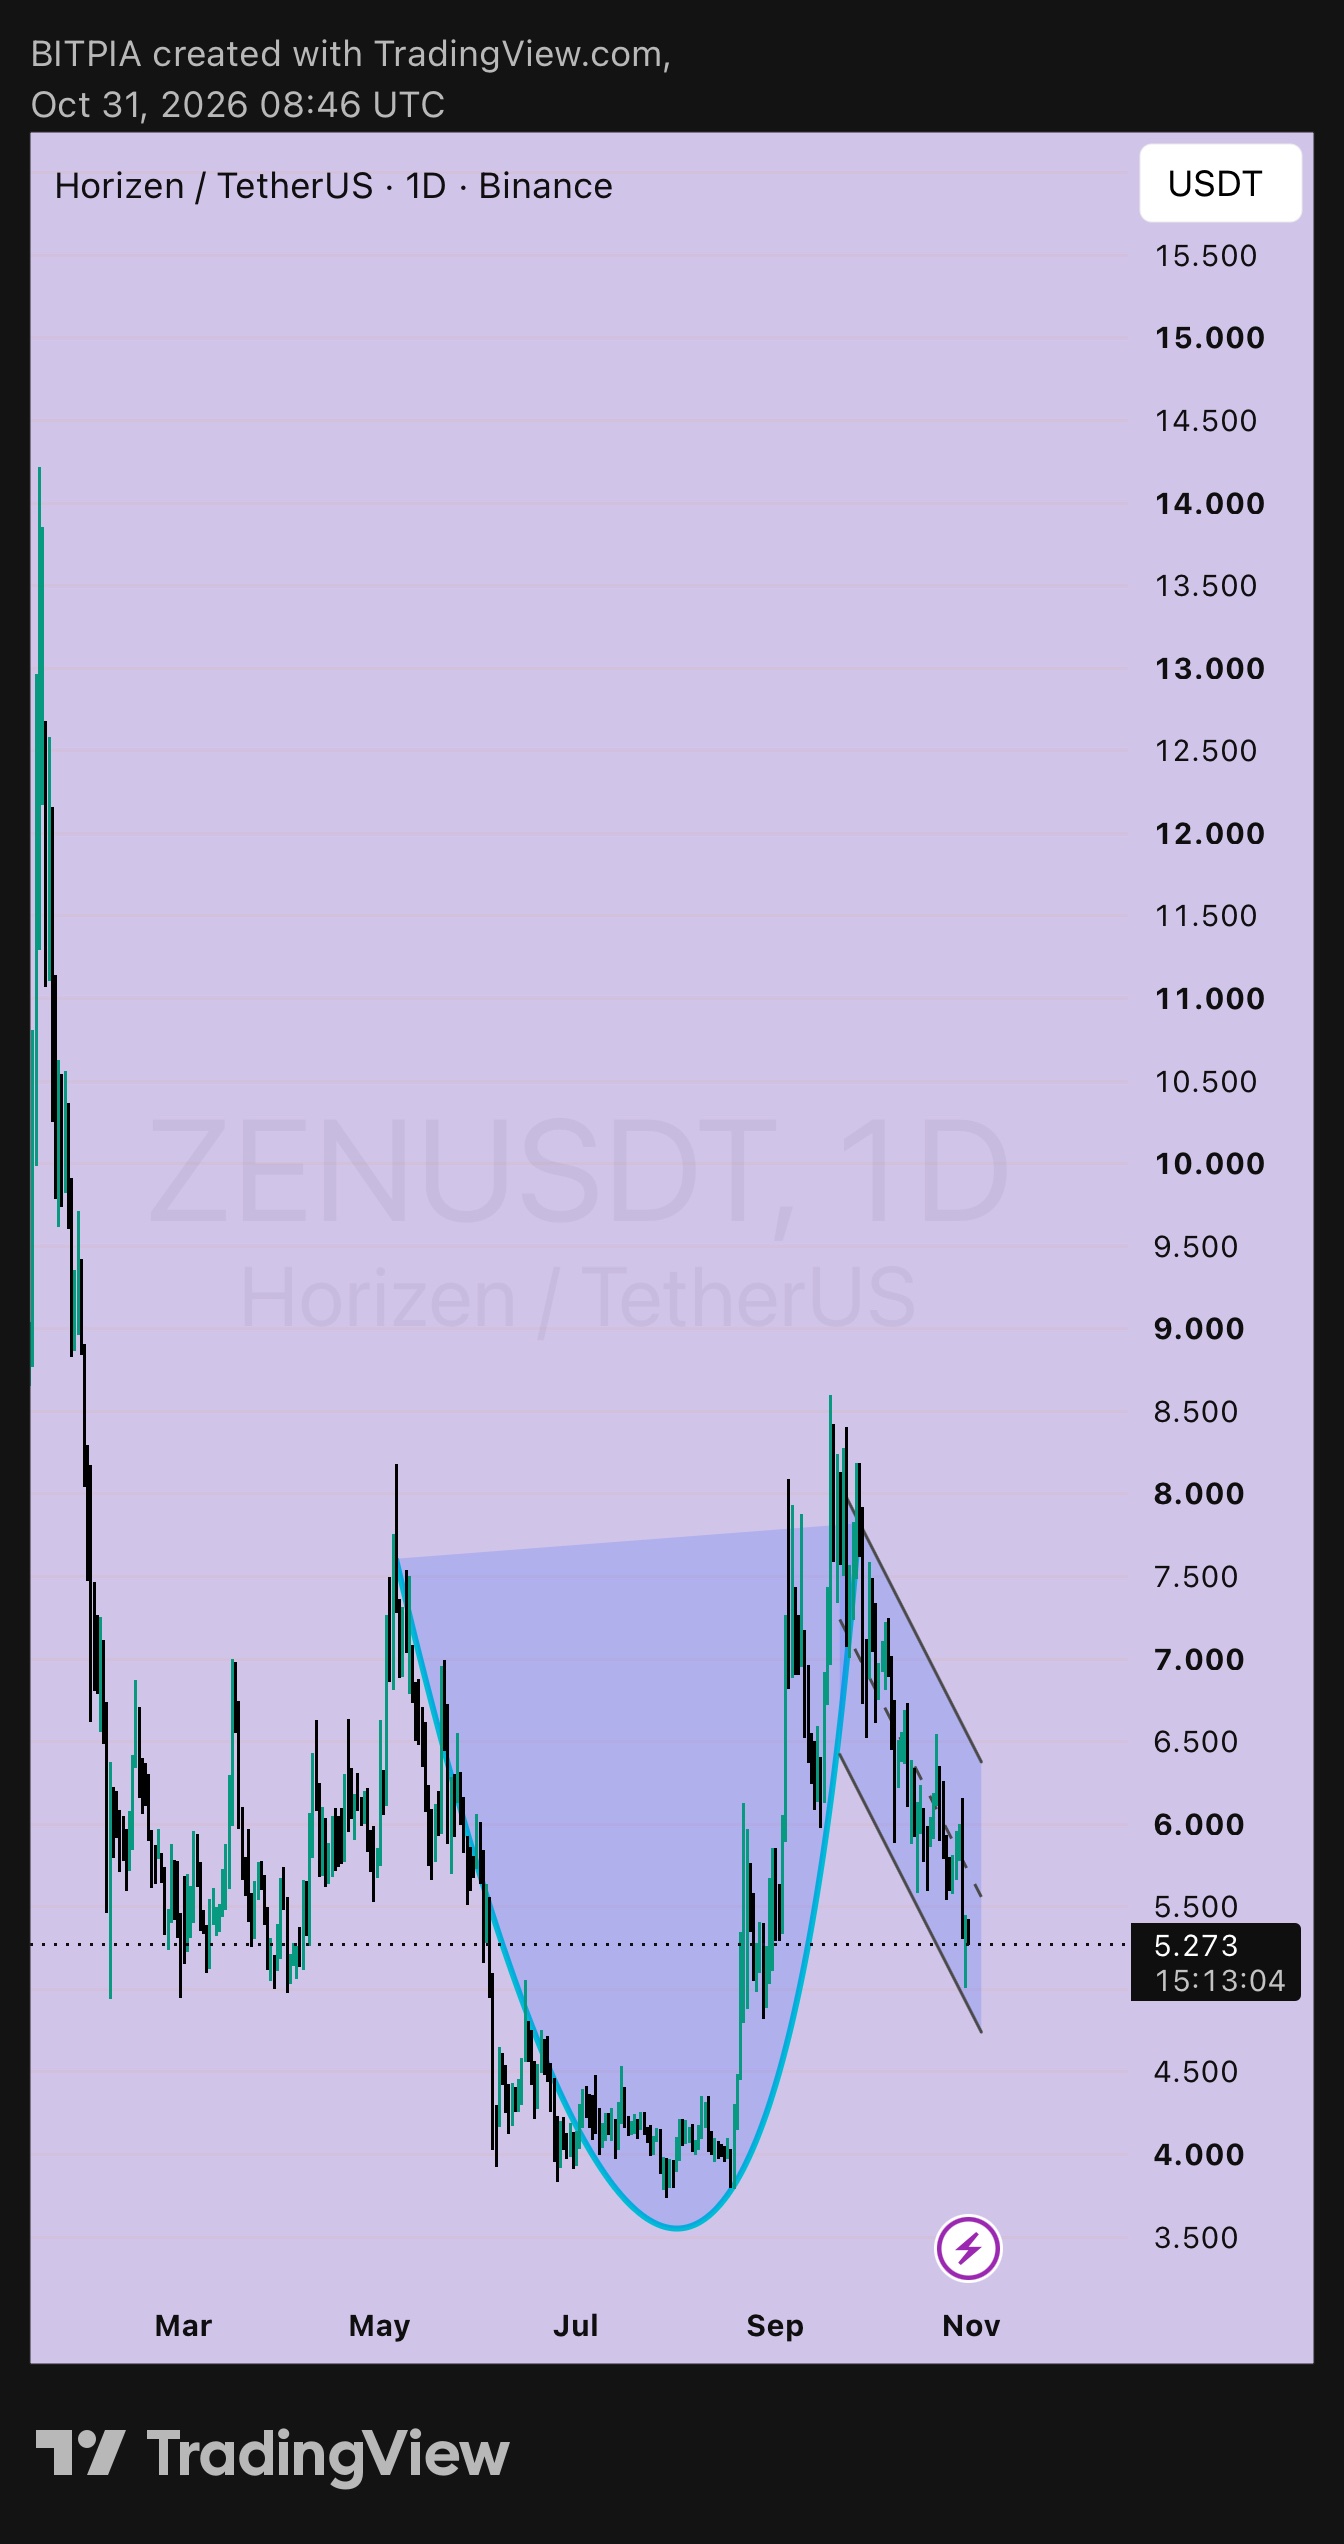
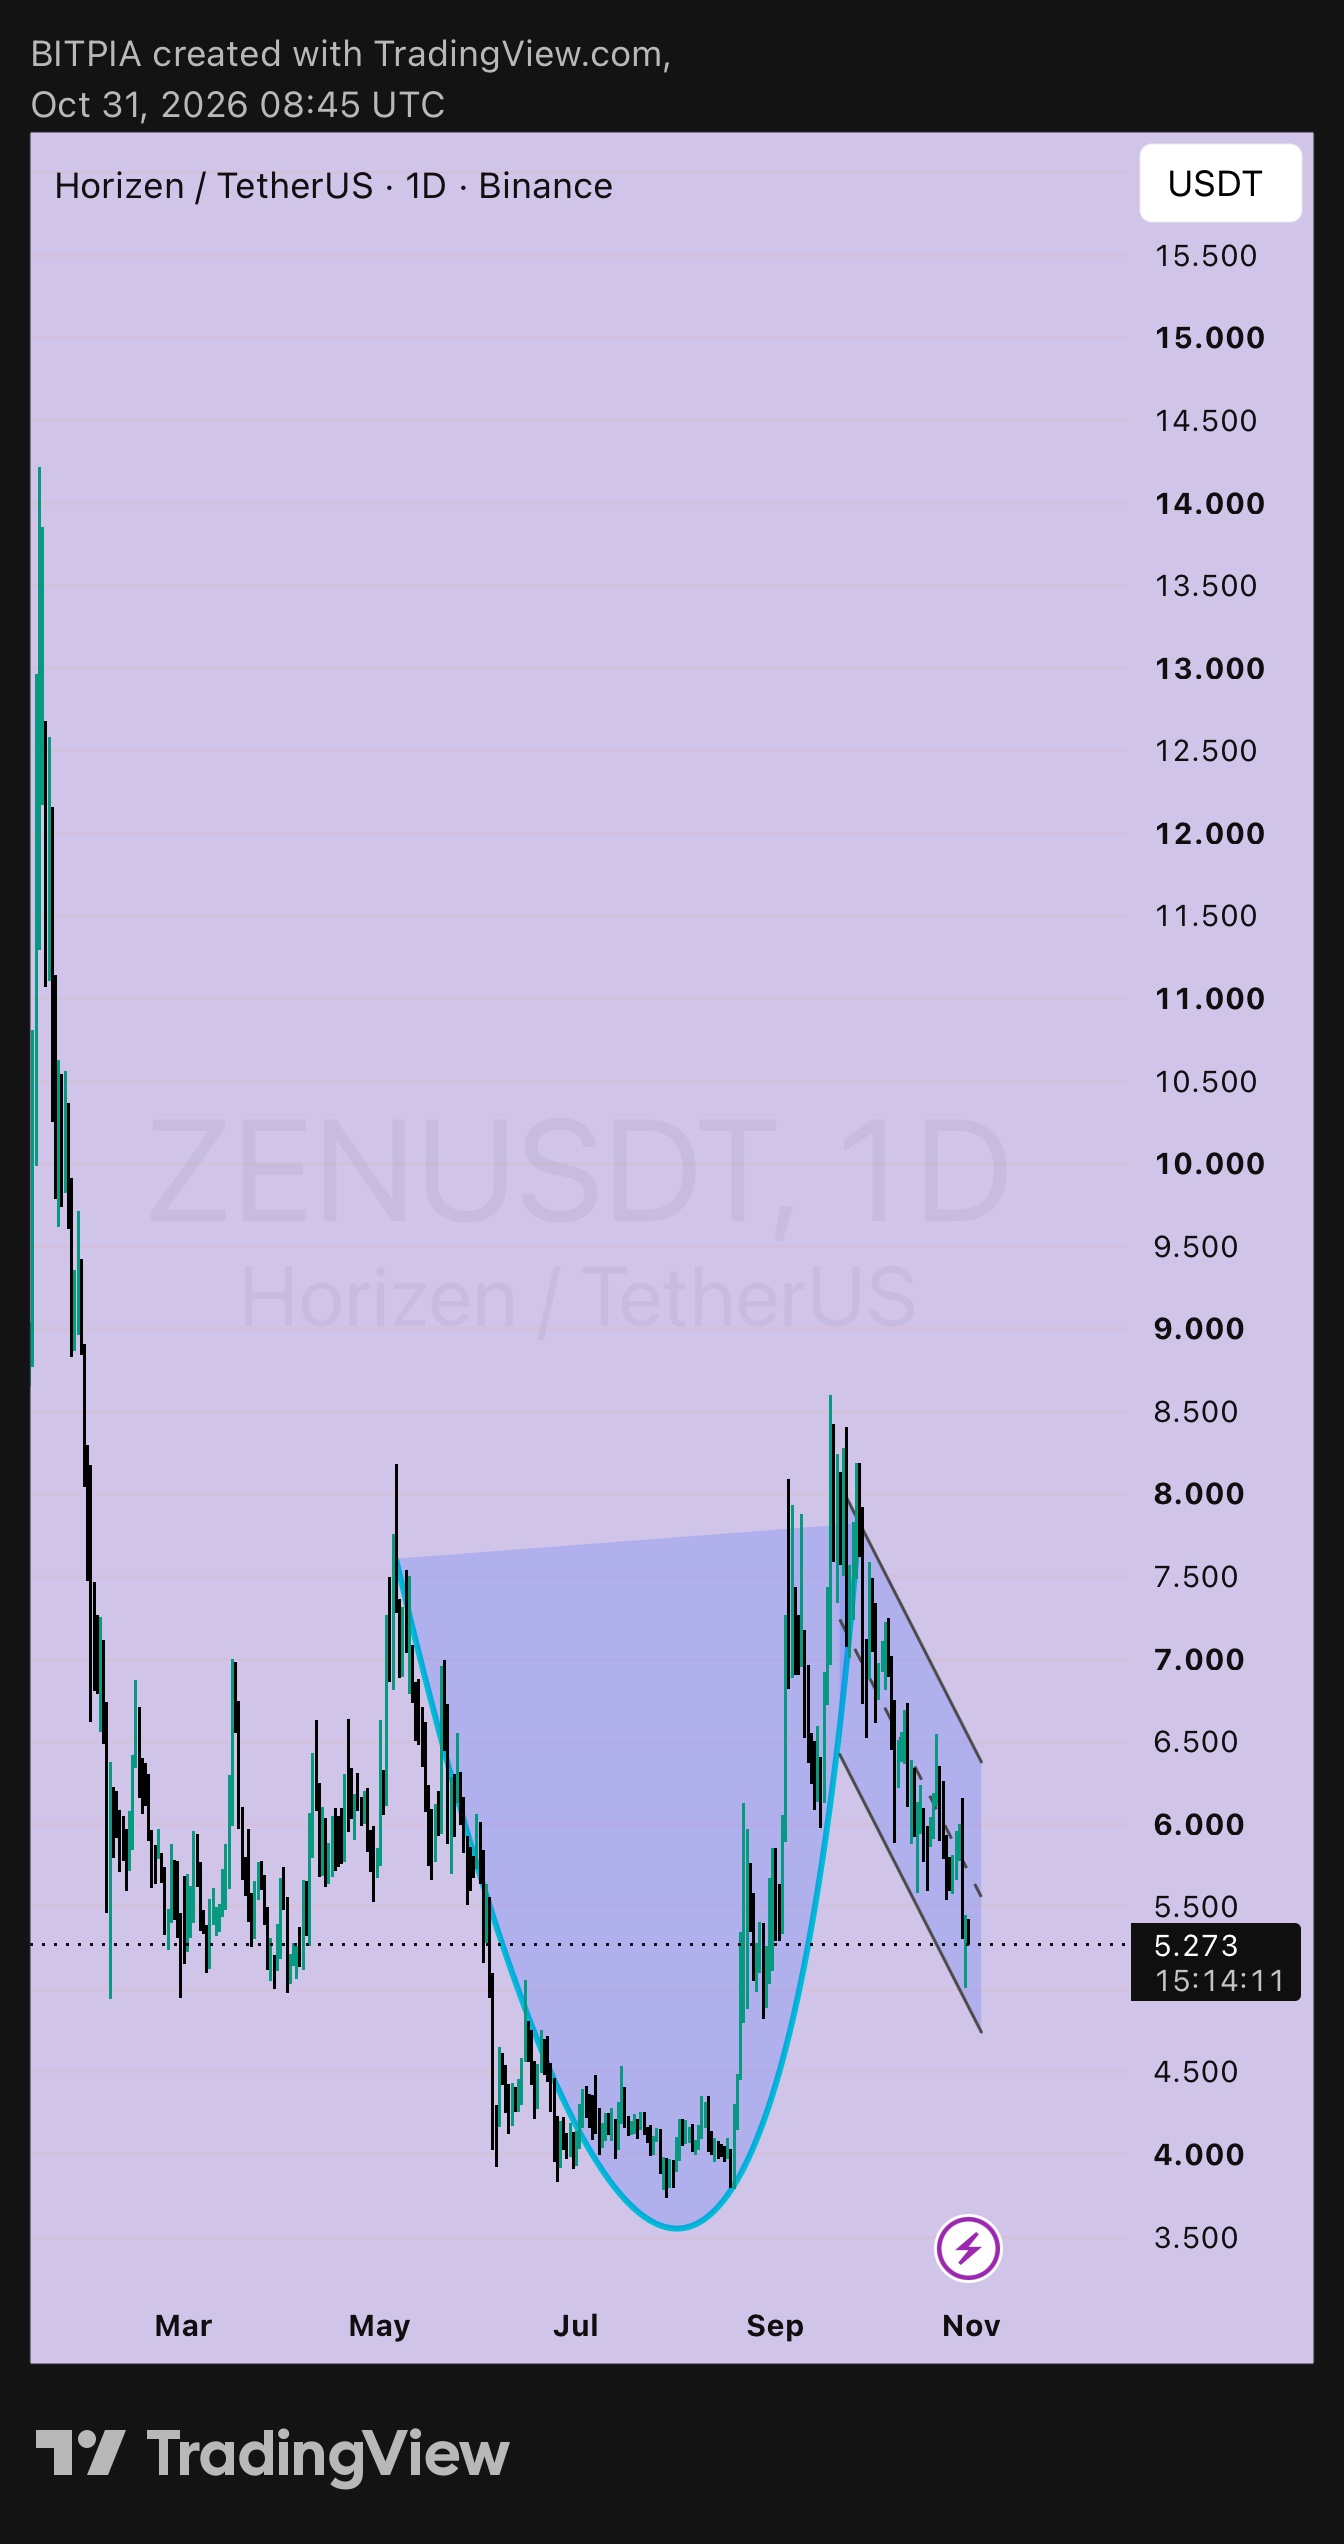
Before you buy the $ZENUSDT dip, answer these three questions, because the chart makes them harder than they look. On Oct 29 I said I wanted a retest of 5.93 to hold, with a stop under 5.87. That stop got hit, and price has since slid to 5.273 after wicking to about 4.95 today. On the daily it's the cup and handle I've been watching, but the handle is getting ugly. Question 1: is the pattern still valid? Kind of. The cup is clear: it bottomed near 3.6 in July, came back to the 7.7 to 8.0 rim, and spiked to about 8.6 in September. The handle is the falling channel since then. The problem is depth. Price has given back most of the move from 3.6 to 8.6, which is a deep handle, and deep handles are less reliable than shallow ones. I'd call it alive but weaker, not dead. Question 2: where does it actually fail? ▸ Support: 4.95 to 5.0, today's wick low ▸ Lower channel line: about 4.75 to 4.80 ▸ Invalidation: a daily close below 4.75 ▸ If that breaks, 4.0 to 4.5 is the next area, and the whole cup idea is gone Question 3: what has to happen for it to work? ▸ A daily close above 6.0, which is where the 5.93 retest failed ▸ Then the upper channel line near 6.4 ▸ A close above 6.4 would break the handle, and then 7.7 to 8.0 becomes the target The math Buying here at 5.273 with a stop at 4.75 risks about 9.9% to gain about 13.8% at 6.0, roughly 1.4 to 1. The bigger payoff is the rim: about 46% to 7.7, roughly 4.7 to 1. If price dips to 5.0 and holds, the same stop risks about 5% for about 54% to 7.7, which is close to 10.8 to 1. Same chart, and the whole edge is in the entry. My answer I'm not chasing a falling daily candle. I'd rather see 5.0 hold on a daily close, or a close above 6.0 that proves buyers are back. Waiting costs a little price and buys a lot of information. Not financial advice, just how I'm reading it. DYOR and only risk what you can afford to lose. #IMPACTbyTrade #WSOT2026 #BlockchainSecurity
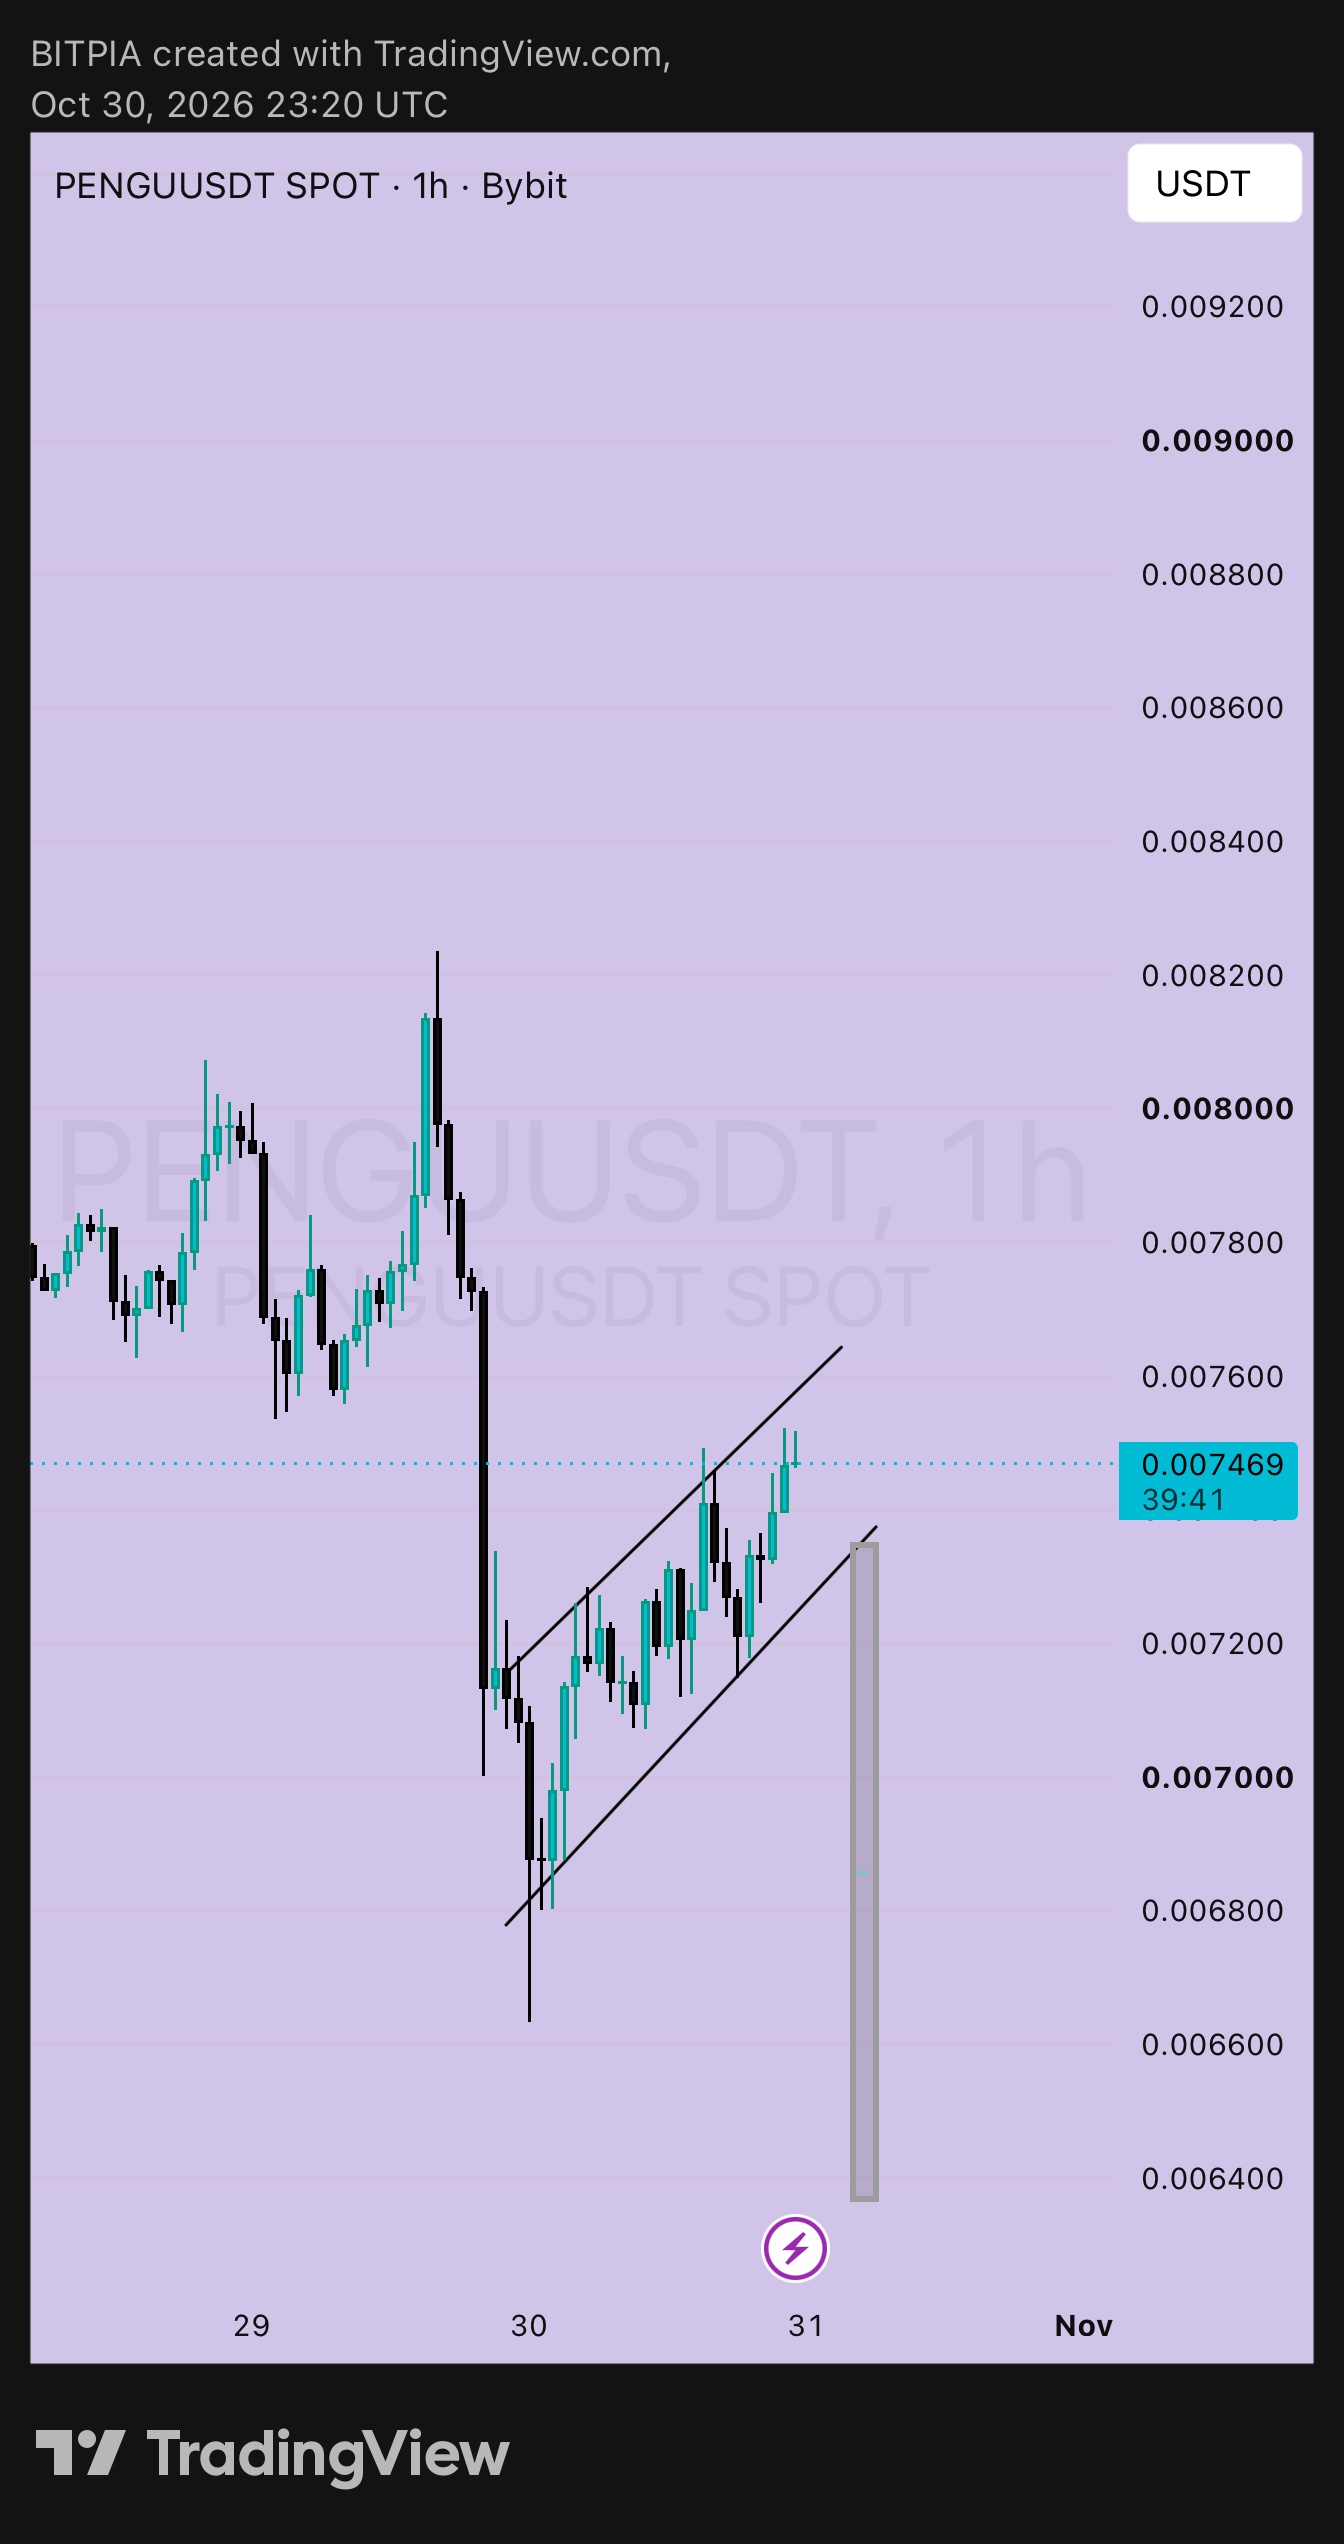
Hope you didn't sleep guys? Let me show you something on $PENGUUSDT . Two traders can look at this same chart and see two totally different things. Let me explain both, and then tell you what I think. Trader number one sees the green candles and says, "PENGU is recovering, let's go!" And he has a point. After the sharp drop from 0.0082 to about 0.0066, price has been climbing steadily and now sits at 0.00747. Buyers are clearly active. Trader number two looks at the same climb and sees something else. A slow, tilted channel going up after a big, fast drop. Traders call this a bear flag. The idea is that the drop was strong, the bounce is weak, and the weak bounce is just a pause before the next leg down. That grey box on my chart shows the possible target, around 0.0064. So who is right? Honestly, nobody knows yet. But here's what I notice: - The drop was one big, fast move. The recovery is slow and small. That imbalance is why I lean a little cautious. - Price is now touching the top of the channel at about 0.0075. That's where it was rejected before. - This is a 1H chart, so everything moves fast. This candle has only about 39 minutes left, so wait for the close. What would make me change my mind? A strong 1H close above 0.0077–0.0078 would break the channel to the upside. Then trader number one wins, and the 0.0082 high comes back into play. What would confirm the cautious view? A 1H close below the channel, around 0.0072–0.0073. That would open the road toward 0.0070 first, and then the 0.0064–0.0066 area. My simple advice to you: don't marry one story. Pick your level, decide where you're wrong, and let price tell you who was right. On short timeframes like this, keep your size small. So which trader are you today, one or two? Tell me in the comments. Not financial advice, just my view. Always DYOR. #ByXIMPACT #IMPACTbyTrade