Meechi
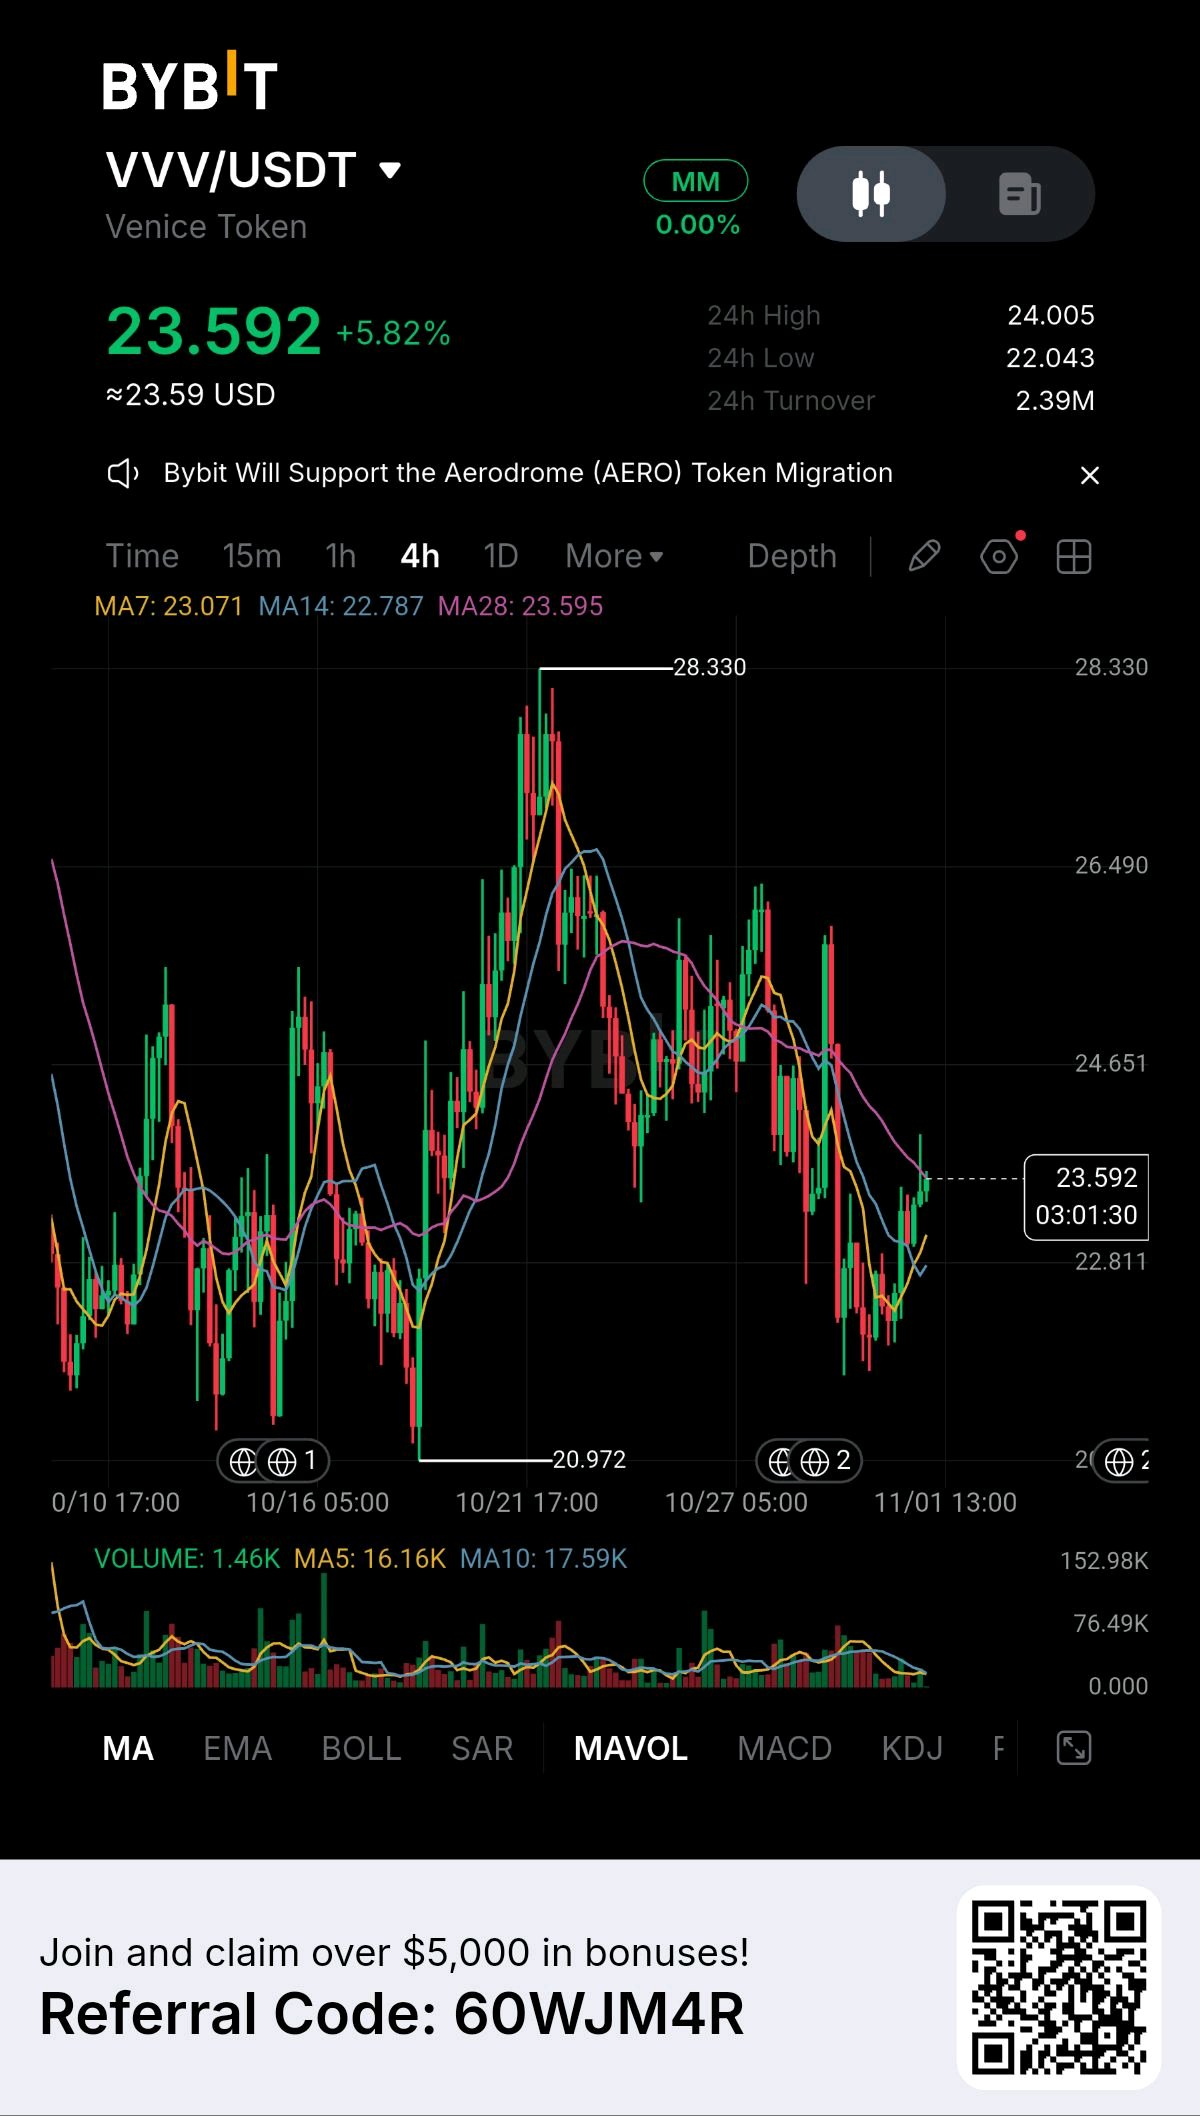
Venice has cut VVV's annual emissions by about 86% since launch, and the token is still down roughly 20% from where it traded on October 2. The supply story is real. The arithmetic behind it is what needs checking. Start with what's verifiable on-chain. Annual issuance has stepped down from 14 million at launch to 10M, 6M, 3M, 2.5M, and as of October 1, 2M. On top of that, $5 of every $100 spent on API credits automatically buys and burns VVV, with subscription-related burns in addition. About 48 million of the roughly 81 million total supply circulates, and Venice itself holds more than 30 million, so treasury decisions are part of the picture too. The product side has real traction. Venice is a privacy-focused AI platform backed by Erik Voorhees, with more than 4 million users and 200+ models, and it doesn't store prompts. One tracker put it at $7.2M of an $8.7M slice of Web3 AI payments between mid-September and mid-October. That's one tracker's category, not total sales. The token also reached Solana on October 6, and 21Shares launched a physically backed ETP on October 20. Here's the part I'd weigh. The widely quoted $100M revenue run rate is still a founder statement, not something confirmed across two reporting periods. And one analysis points out that even at 2M a year, new supply is worth about five times the largest buyback that revenue could fund. Emissions falling is a necessary step toward deflation. Revenue growth has to do the rest. Add leverage: on October 10, open perpetual positions were about $232M, roughly 22% of market value. That helps explain a 35% run from $20.97 to $28.33 in a few days, followed by a slide back to about $22. On the chart, VVV has bounced to $23.59 and is sitting almost exactly on its 28-period average, with the faster averages turning up beneath it. Volume has faded, so this reads as a tentative recovery, not a trend. $24 is the first level to reclaim, and $22 is the one to hold. So: a deliberate supply squeeze, a product with users, a revenue claim awaiting confirmation, and a lot of leverage on top. Do you trust the burn-and-cut story enough to wait for the revenue to be verified, or does that confirmation need to come first? $VVVUSDT #ByXIMPACT
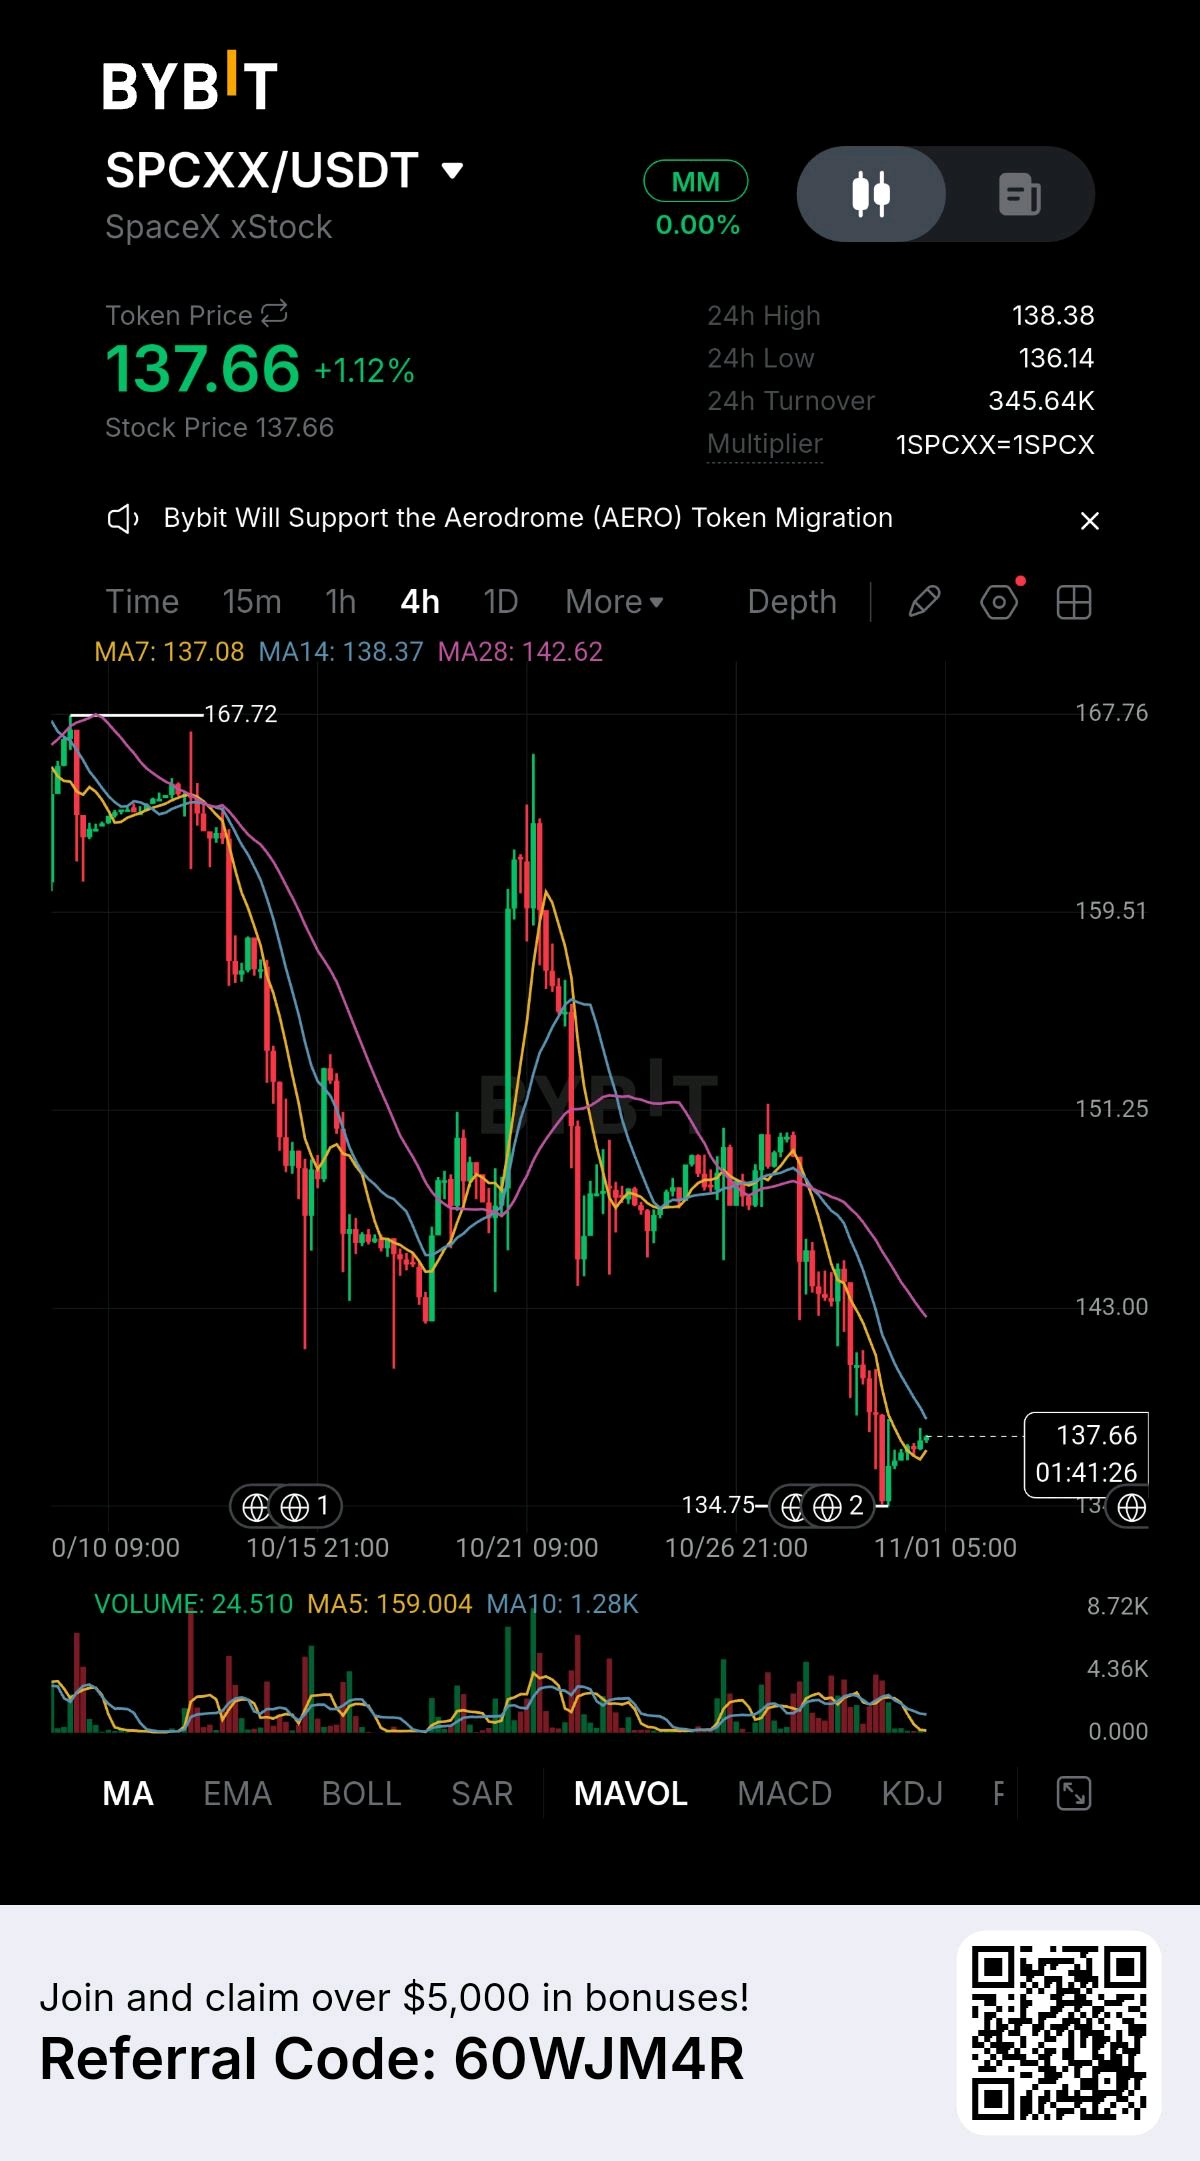
SpaceX closed Friday at $134.72, one dollar under its $135 IPO price, after 4.5 months as a public company. Whether that line holds is the question that matters now. The path has been rough. SPCX priced its record IPO at $135 in June, closed day one at $160.95, and hit $225.64 four days later. It then fell about 50%, bottomed at $104.83 around its first earnings report in early August, rebounded to $171.92 by October 6, and has handed most of that back since. Friday's 6.4% drop was attributed to Intel guidance affecting the partnership thesis, though I couldn't find what was actually said, so I'd treat that explanation as unconfirmed. What's striking is that the business has been beating. Q3 revenue came in at $14.58B against $12.87B expected, and EPS at $0.35 against $0.13. Bloomberg reports Anthropic is now its largest customer after a compute deal, and the AI segment from the xAI merger is growing quickly. Yet the stock fell after the report, which tells you results aren't what's setting the price. Supply is. Lock-up shares have been releasing in tranches since August 6, including a roughly 1.3B-share release on October 22 after Q3. The last tranche, up to 797.6M shares, unlocks December 8. About 13.1B shares are outstanding, so each release is a real test of demand. Then there's the cash. One independent forecast puts first-half free cash flow near negative $25B, with a $40B GPU lease already in place and reports of another $40B being raised to buy Nvidia chips. That forecast also values the company at $1.25T against a market price near $1.8T, but it's one analyst shop's view, not consensus. On the other side, BofA, Barclays and Bernstein all rate it Buy, with targets of $268-300. Add governance: Musk holds about 42% of shares and 82% of the vote, and Tesla merger talk keeps resurfacing. So the setup is a growing company trading on supply, at its offer price, with the biggest remaining unlock about five weeks out. Is the $135 IPO price a floor the market defends, or just a number the stock passes through on the way to the December unlock? #ByXIMPACT $SPCXXUSDT
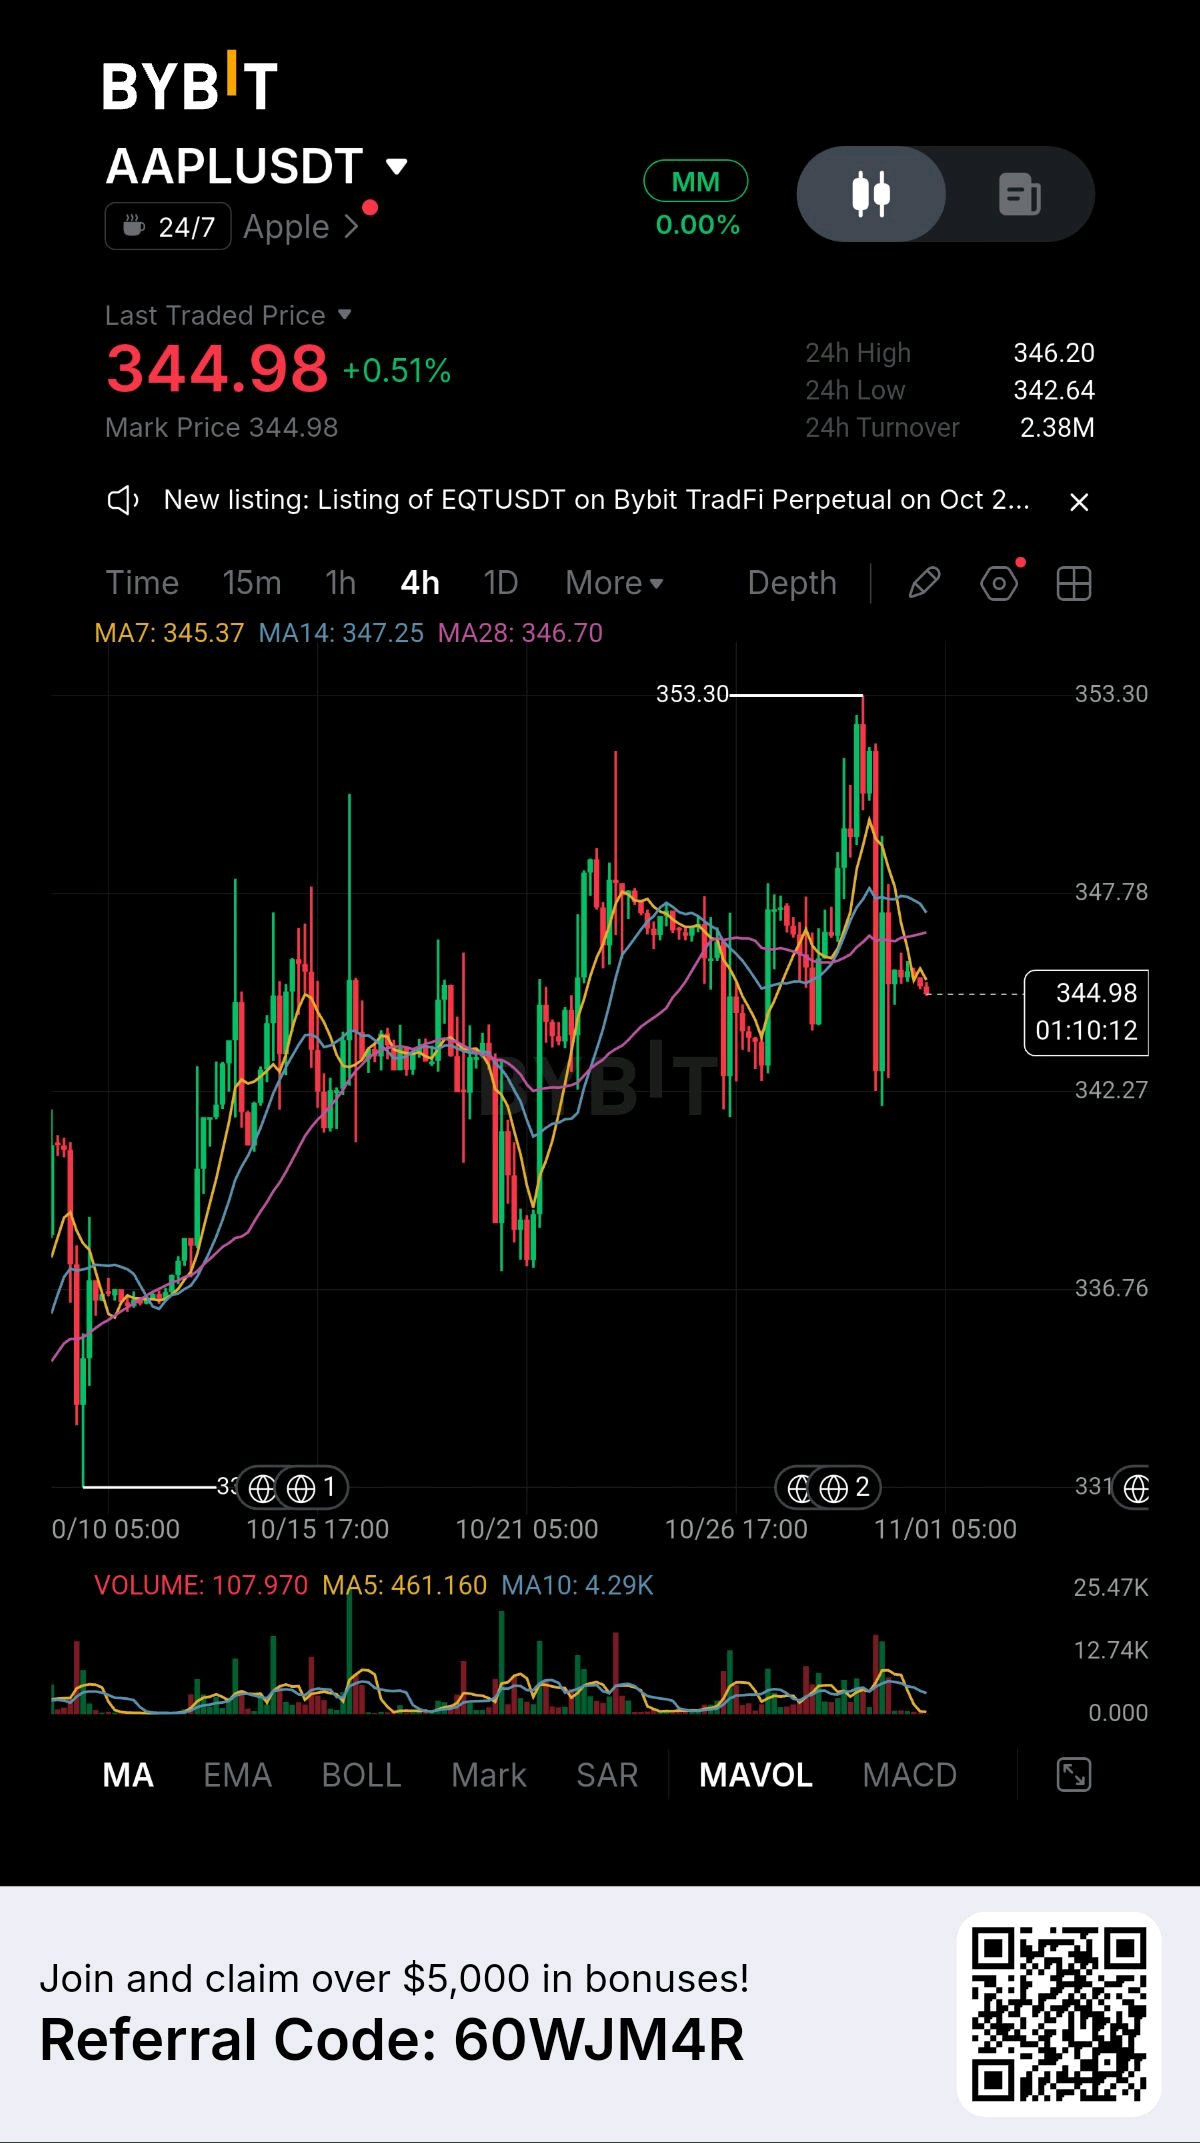
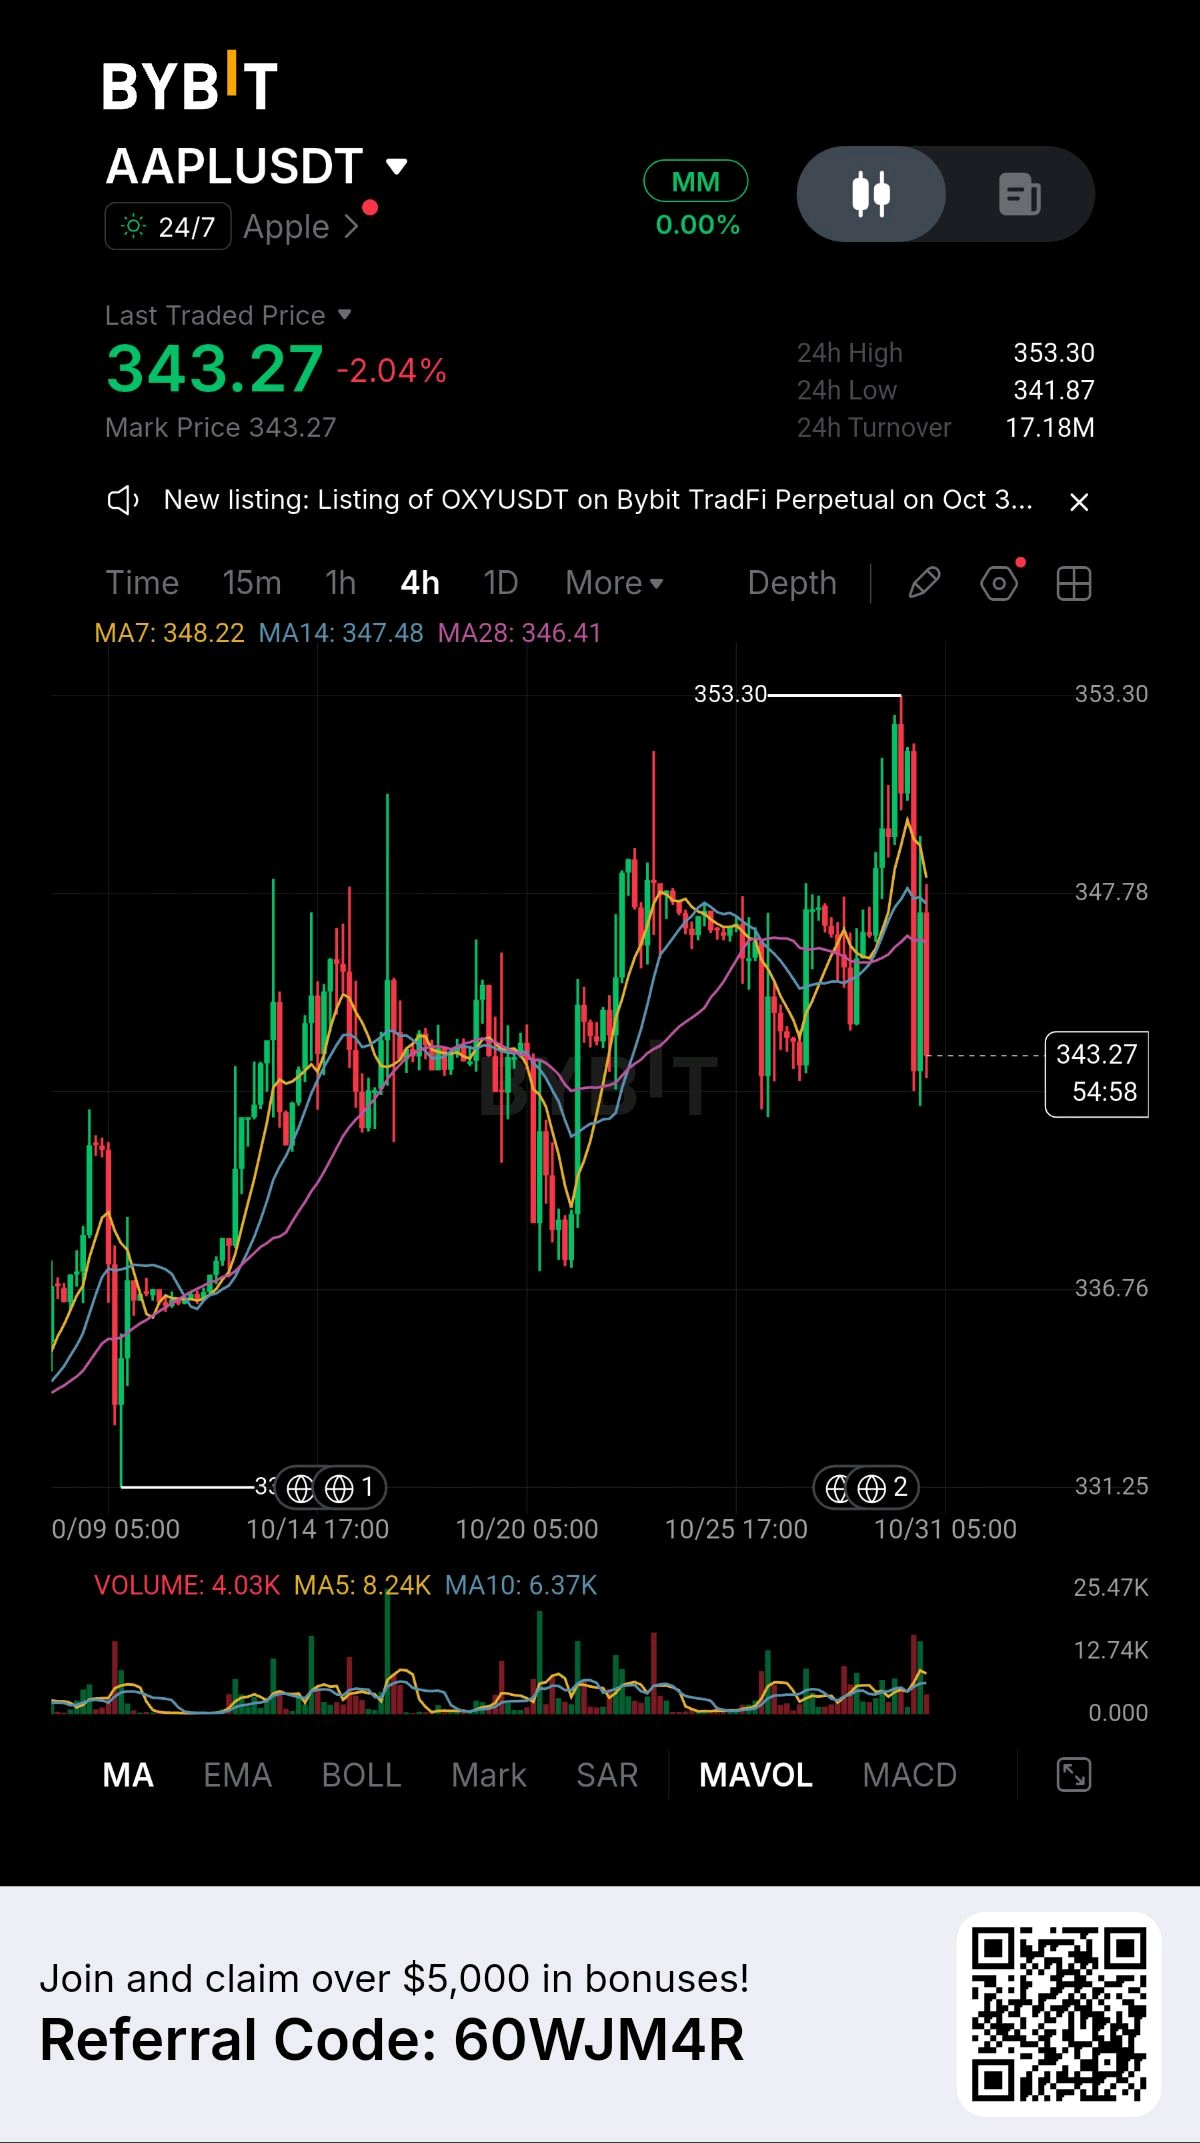
Apple will almost certainly beat on Monday. The beat is the least interesting number in the report. Consensus sits around $1.98-1.99 in EPS on roughly $113.3B in revenue, and the company has guided to 9-11% growth, so the September quarter is largely telegraphed. Sources even disagree on how long the beat streak is, anywhere from four to twelve straight quarters depending on the outlet. What decides the move is what Ternus says about the next two quarters, in his first report as CEO. Here's the scorecard I'd use. First, the December-quarter revenue guide. Bank of America trimmed its iPhone forecast this week and argued consensus is too high for this period. A range that clears that bar reads as relief. Second, the gross margin. Management guided 47-48% against 48.65% last quarter, and memory costs are the reason. The March-quarter margin comment matters more than September's actual figure. Third, supply. The iPhone Duo sold out on launch day with orders running into January, but it launched October 23, after the quarter closed on September 26. None of its demand is in Monday's numbers, so any evidence of it will come from commentary, not the income statement. Fourth, a report I couldn't verify: one outlet says Apple cut October component orders for Pro models by 15-20%. If that surfaces in the call, it complicates the sold-out story. The chart is already leaning cautious into this. After failing at $353.30, AAPL has made lower highs and sits near $345 with its fast average slipping below the slower ones and volume drying up. That's not a breakdown. It's a market that has stopped pushing until it hears the guide. The valuation sets how forgiving the reaction will be. At nearly 40x trailing earnings and above the average analyst target, good-but-not-great guidance has a history of being sold. Last July's beat wasn't enough for that reason. So I'd frame Monday this way: a beat with a firm guide supports the premium, a beat with soft margins or a soft December range is what the market has punished before. Which of those numbers do you think moves the stock first when the guide lands? #ByXIMPACT $AAPLXUSDT
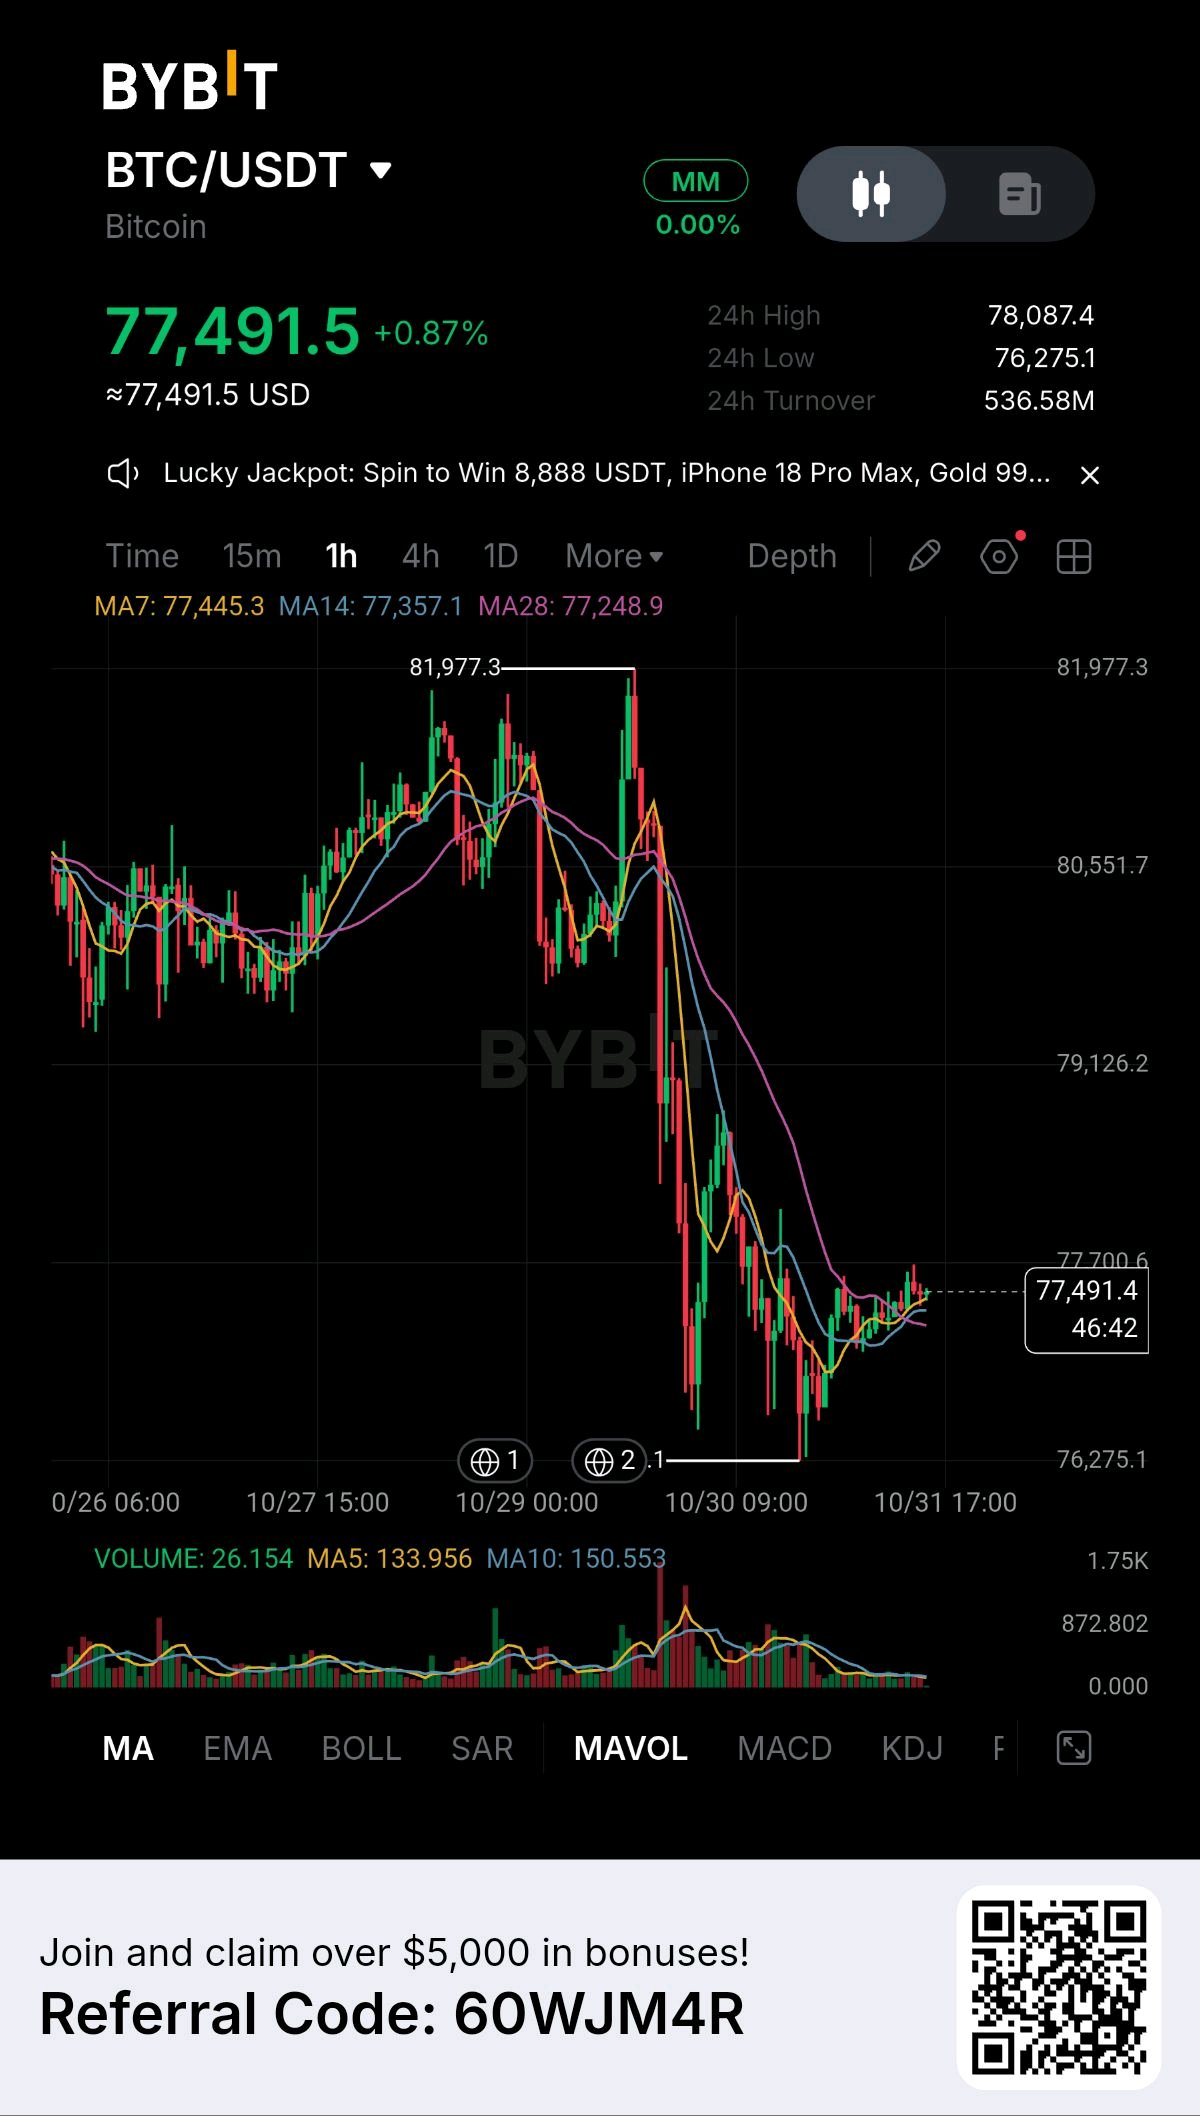
Bitcoin's drop this week had little to do with Bitcoin. It was a trust shock at the largest exchange in the world, and the next test is scheduled. BTC fell about 7%, from $81,977 to $76,275, breaking through the $80,000 zone that several data sources had marked as the line. It has since bounced to roughly $77,500, but only recovered about a fifth of the drop, and volume has faded since the flush. That's consolidation, not a recovery signal. One detail worth noticing: price is sitting almost exactly on Glassnode's market-wide cost-basis reference near $77,600. The cause is the largest crypto hack on record. Binance estimates $6.3B was taken starting around 20:20 UTC on October 29, via its main Ethereum hot wallet. Reported figures include about $3.74B on Ethereum and 18,270 BTC (roughly $1.47B). About $1.6B in leveraged positions were liquidated, $1.35B of it longs. Here's what's confirmed and what isn't. Binance says about $3B has been frozen, that it has reserved $6.34B to cover losses (including $5B already held in the exact affected assets), and that user funds are safe. It initially traced the breach to a compromised engineer's laptop, then said it found additional breach points. It reports no evidence of leaked private keys, while Hypernative's analysis points to compromised signing access. Some outlets link the attack to North Korean hackers. That's reported, not established. What I'd watch is the calendar. Withdrawals are targeted to restart in phases, which Binance calls a target, not a guarantee. Proof-of-reserves results are due Monday. A clean restart and a credible report would take the main stress out of the market. A delay, a limited reopening, or surprises in the reserves would likely push BTC back toward $76K. The attacker was also reported converting altcoins like UNI and ENA into ETH, which adds supply pressure until funds are frozen or recovered. This also landed two days after the Fed held rates in a 10-2 vote with two members wanting a hike, so the market had little cushion. So the first level to reclaim is $80,000, and the support is $76,275. Everything between them depends on whether Binance does what it said it would do. Are you treating Monday's proof of reserves as the event that clears this out, or as the one that could make it worse? $BTCUSDT #ByXIMPACT
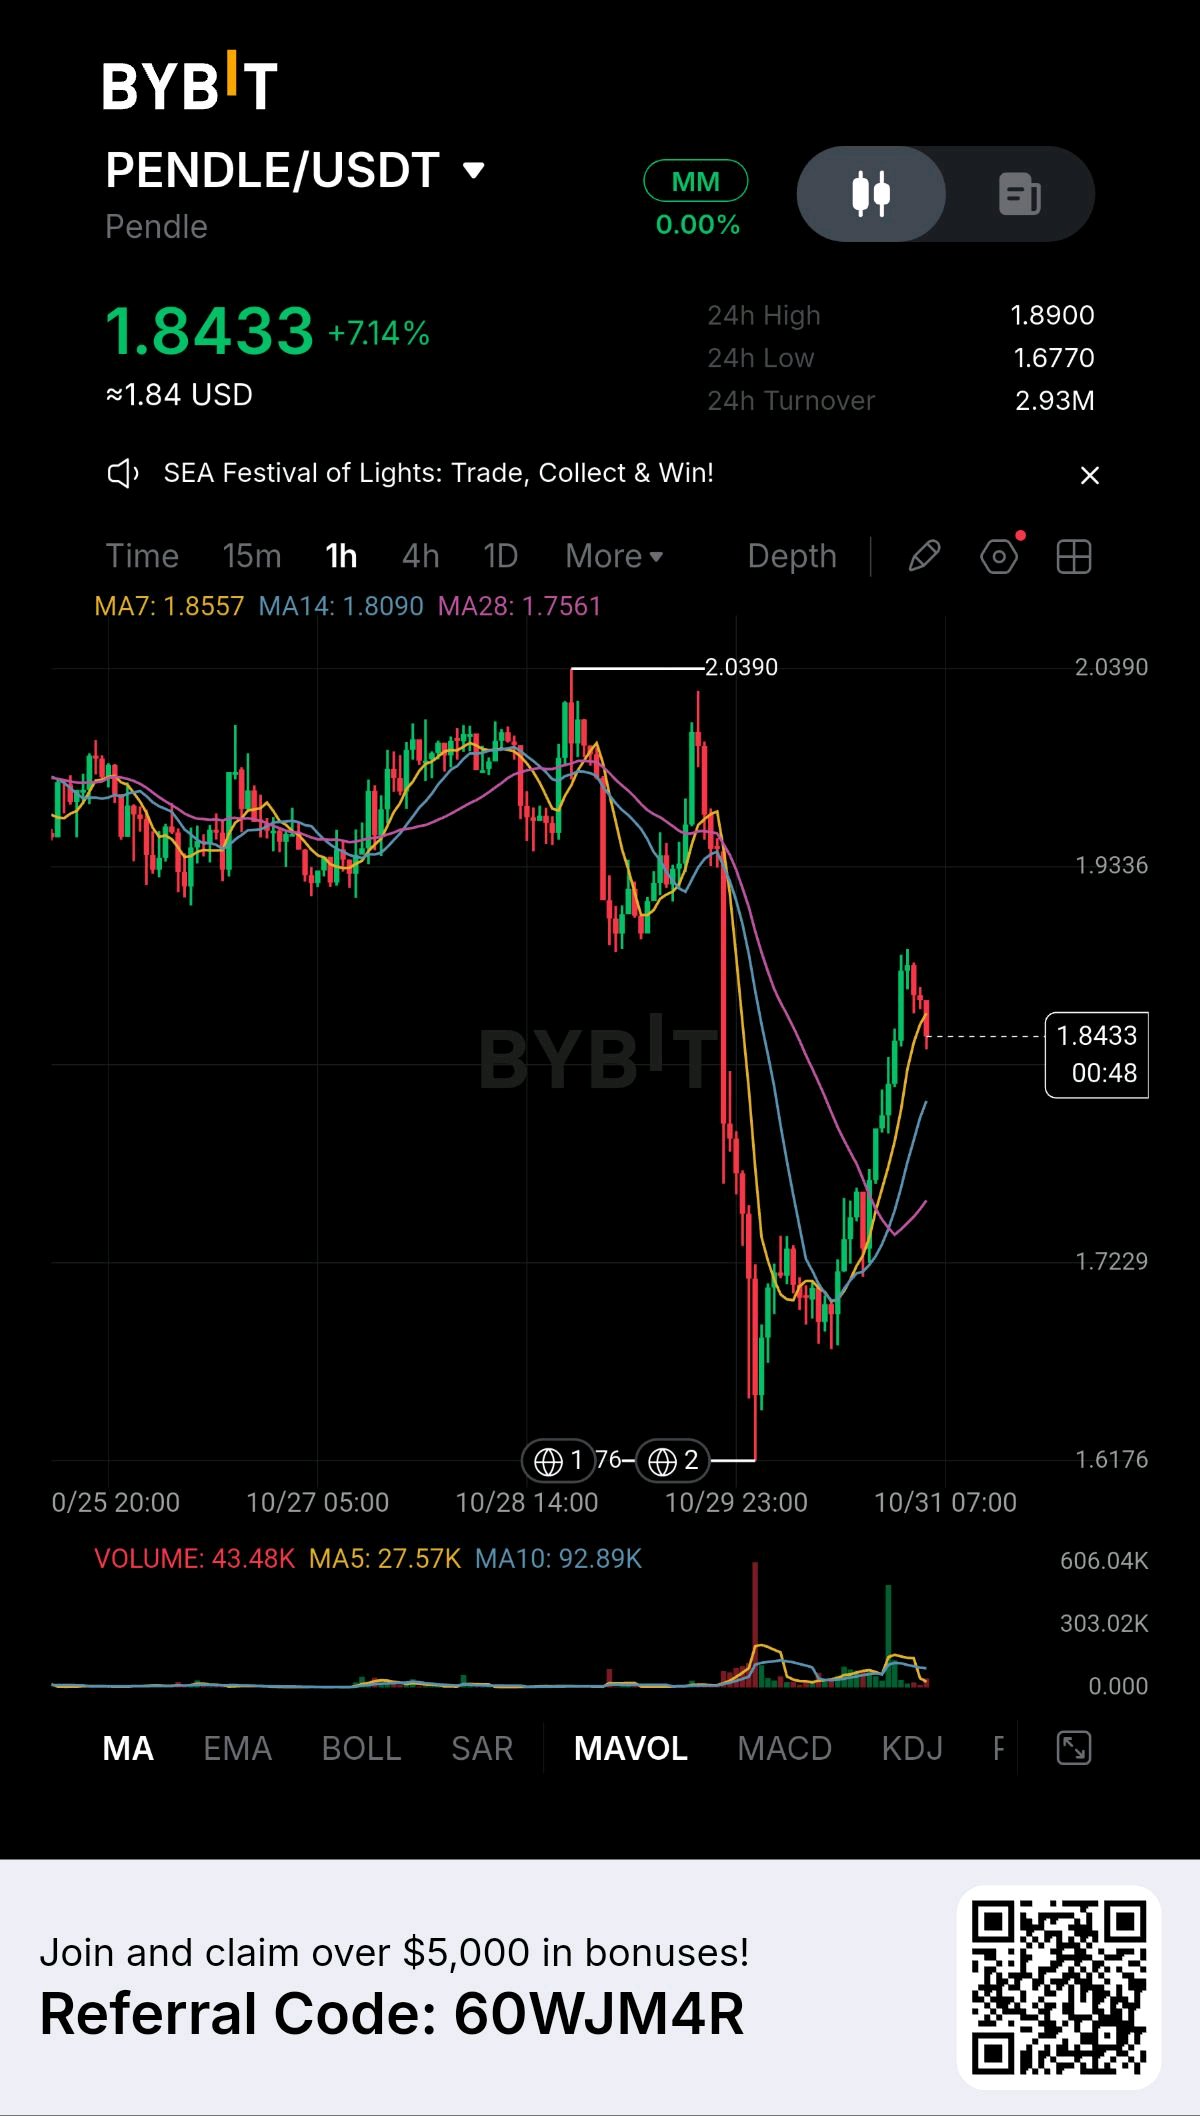
Pendle's TVL grew 43% last quarter. One DefiLlama-based analysis says its quarterly protocol revenue fell from $9.75M to $1.89M over the same year. Both can be true, and that gap is the whole thesis. Start with what's solid. Pendle ended Q3 with $1.16B in total value locked, its first quarterly gain in a year, up from a two-year low of $812M on June 30. It did that while cutting PENDLE incentives by roughly 58%, so the growth wasn't bought with emissions. Real-world asset markets carried it, and lenders more than doubled their acceptance of Pendle's principal tokens as collateral, to about $497M. In October it kept building: a market on Base tied to a Janus Henderson AAA CLO product, a yield-bearing gold token integration, funding-rate markets for BTC and ETH, and live rate feeds into Aave's risk settings. The token's side of the story is the buyback. Pendle says it has repurchased 3,058,338 PENDLE since the model launched in January, which it describes as about six times the pace of V2 emissions. The Q3 report frames it differently, at 3.2 tokens bought per token emitted. Those are different measures, so I wouldn't merge them into one headline number. Either way, supply is being absorbed faster than it's created. Here's the tension. Buybacks are funded by protocol revenue, and revenue is the number that has shrunk. TVL growth hasn't yet turned into fees at the same rate. I'd also treat the RWA share of TVL with caution, since the Q3 update says 82% while an October 21 summary says 67%. That's probably dates and definitions, but it shows how much these figures move depending on who's counting. On the chart, PENDLE fell about 21% on October 29, from $2.04 to $1.62, then bounced to $1.84, winning back a bit more than half. I found nothing Pendle-specific behind the drop. The timing lines up with the market-wide selloff tied to the Binance incident, and the token is still about 71% below its $7.50 high from April 2024. That rally also came before the current tokenomics existed, so the model can't take credit for it. Next on the calendar is a permissioned PT/YT markets pilot targeted for November 8, with partners still unconfirmed. So the setup is a protocol gaining share in a real niche, a token supported by buybacks, and a revenue line that has to recover to keep paying for them. Do you think TVL growth eventually fills that revenue gap, or does the buyback run out of fuel first? $PENDLEUSDT #ByXIMPACT
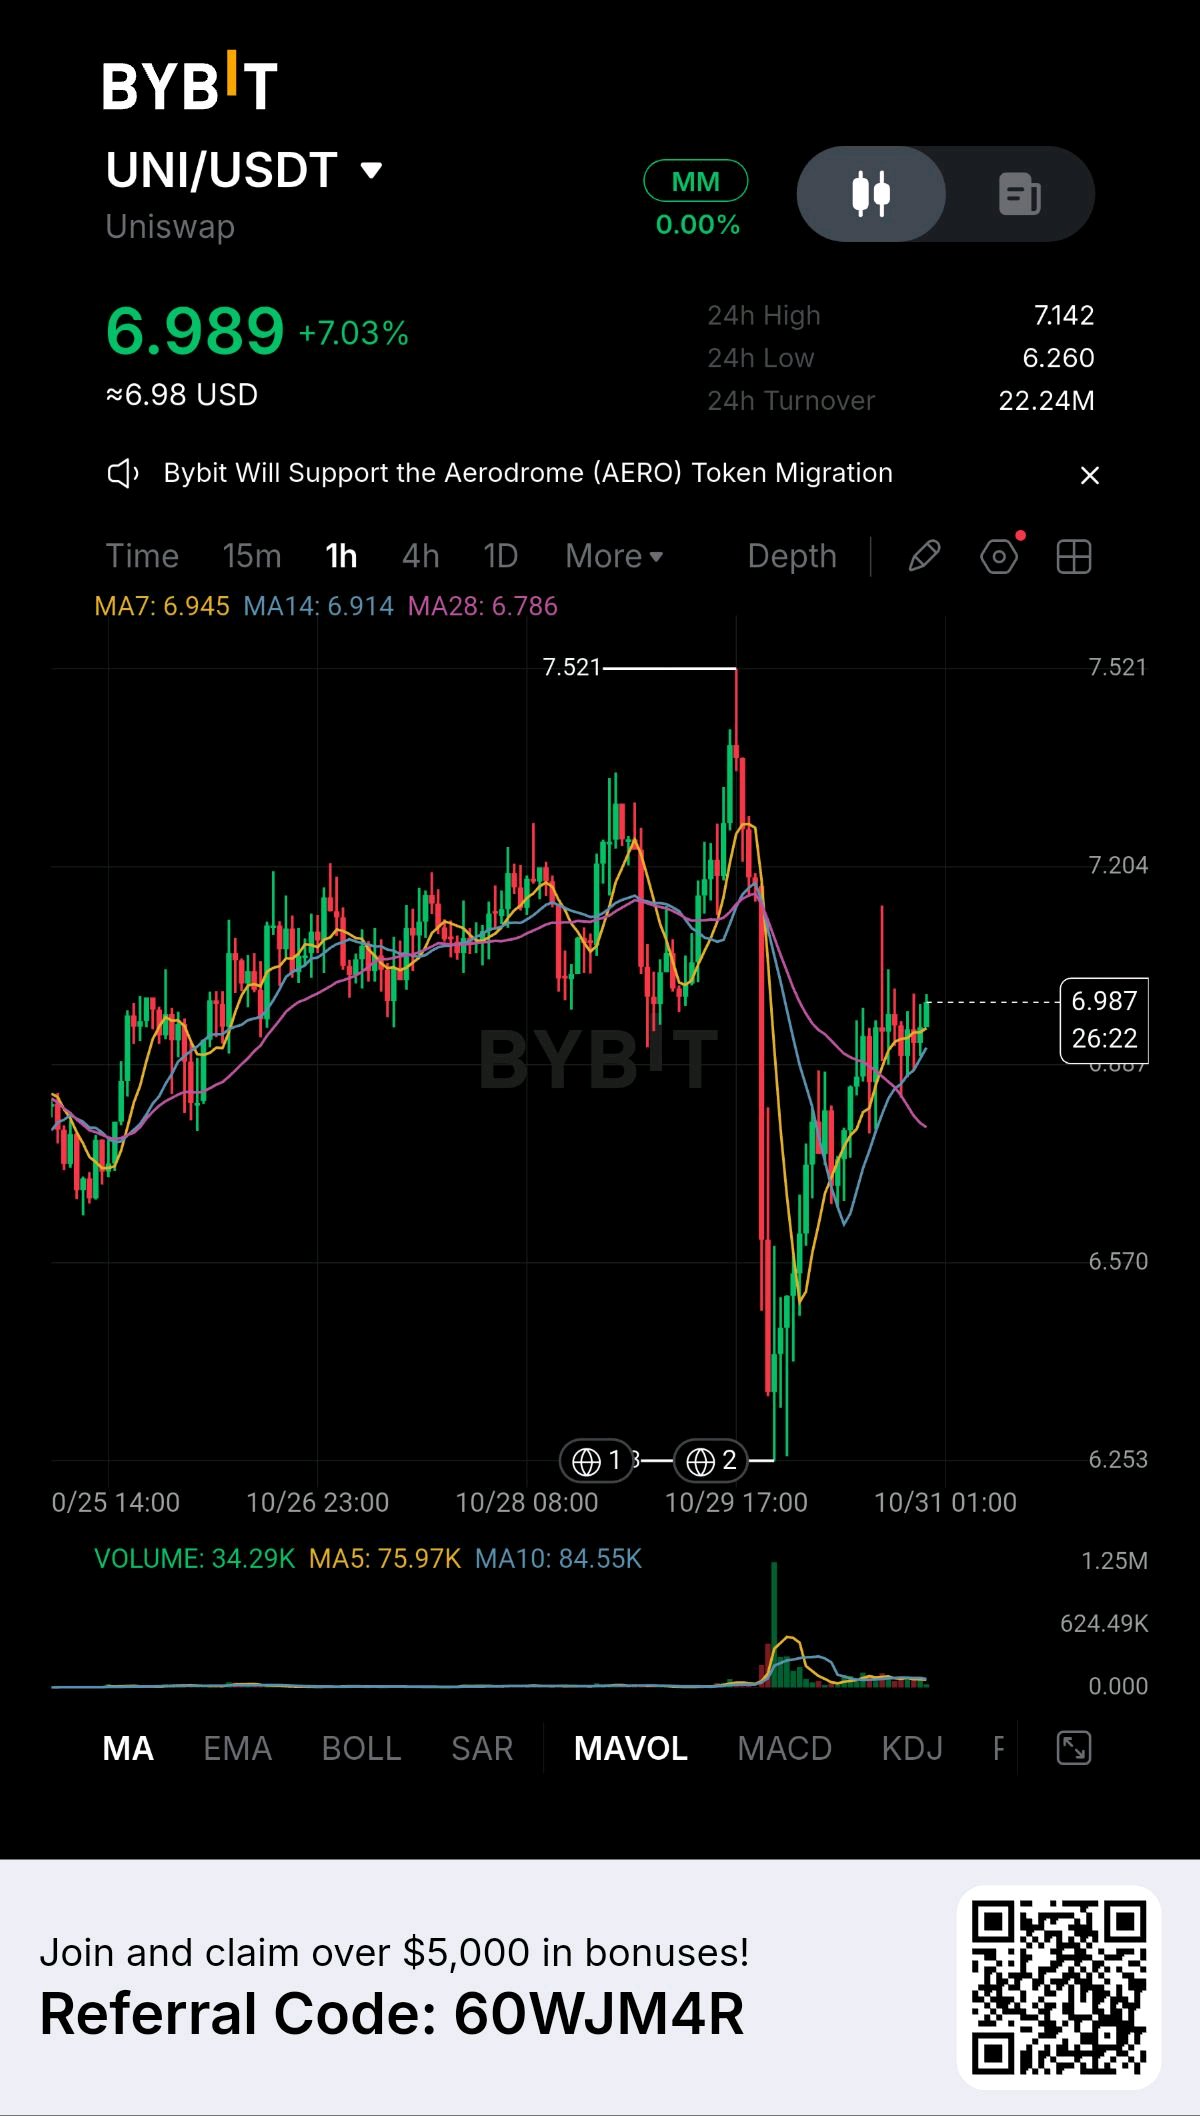
UNI dropped from $7.52 to $6.25 in a few hours this week. The seller behind part of it was only about 2.7% of the day's volume. The chart tells the story cleanly. UNI ran to $7.521 on October 29 and got rejected at the $7.50 line analysts had marked as the breakout level. Then it fell vertically on the heaviest volume of the window, bottomed at $6.253, and has since recovered to about $6.99, winning back a bit more than half the drop. It's sitting just under $7.00, which most coverage treats as the pivot. Here's what's easy to miss. Reports say the Binance hacker converted roughly $40M of UNI and $34M of ENA into about 70,480 ETH, and that both tokens closed at 30-day lows. But the UNI sale was only about 2.7% of that day's trading volume. A sale that size doesn't move a market by itself. My read is that forced selling and weak conviction did the rest. That's inference, not a sourced fact, so weigh it accordingly. The protocol side is moving in the opposite direction from the price. Aggregator Hooks went live on October 22 across Ethereum, Base and Robinhood Chain, and swaps routed through outside liquidity now pay fees that feed UNI burns. CME listed UNI futures around October 19-20. SMBC Nikko, one of Japan's largest securities firms, is building a compliant venue on Uniswap hooks for mid-2027. Two cautions I'd put next to that. First, "fee burns" is the bull thesis, but even CoinGecko's coverage separates governance approval from activated fee settings and completed burns. Check how much has actually burned before leaning on the story. Second, Santiment recorded 13,137 new addresses in a single day, the most since 2020, yet one outlet warned the spike may not mean what it looks like, since new wallets can be low-quality. Open interest also fell from about $600M to $350M in October, so the leverage has been cleared. UNI is still down roughly 21-29% over four weeks after a 220% summer run, and coverage has it under its 7-, 20- and 50-day averages. A close back above $7.14-$7.50 changes that. Failing there keeps this a bounce inside a downtrend. Are you treating the flush as a one-off supply event the market has absorbed, or as the first sign the summer rally is fully unwinding? #ByXIMPACT $UNIUSDT
Apple made a new all-time high this week, and by the end of the same session it had handed back more than 3%. Heading into Monday's report, that's the detail I'd weigh. AAPL pushed to $353.30, about $1.50 above its previous peak, then fell to $341.87 and now trades near $343. The short-term averages that were supporting it a few days ago, around $347-348, have flipped to overhead resistance. One failed breakout doesn't make a top. It does mean buyers now have to prove something going into earnings, which land Monday after the close. What makes it harder is that the expectations being tested keep drifting lower, even among bulls. Bank of America, which rates Apple a Buy with a $370 target, cut its fiscal 2027 iPhone forecast by nine million units to 247 million, against 260 million for the Street. The reasons are the staggered launch (Pro, Pro Max and Duo in September, the base model and Air not until March) and higher prices tied to parts costs. For the September quarter it expects $113B in revenue and $1.97 EPS, a hair under consensus. When the optimists trim numbers, the consensus is usually the one that has to move. The precedent is worth keeping in mind too. In July, Apple beat on both lines and still dropped about 7% the next day. Greater China came in at $18.8B against $19.5B expected, Services at $30.7B against $31.3B, and the revenue guide of 9-11% landed under the roughly 12% the market wanted. Beating wasn't the problem. Guiding was. Valuation leaves little cushion. The stock is near 39 times trailing earnings with a market value around $5 trillion, while the mean analyst target of roughly $331 sits below the current price. Options are pricing about a 3.7% move either way, which is half the size of what happened last time. One more limit: the quarter ended September 26, before the iPhone Duo launched on October 23. Duo demand and supply constraints can only show up in management's commentary, not in this report's numbers. So the real question for Monday isn't whether Apple beats. It's what the December-quarter outlook says about iPhone supply and memory costs. Are you treating the beat as the trade, or the guide? #ByXIMPACT $AAPLXUSDT
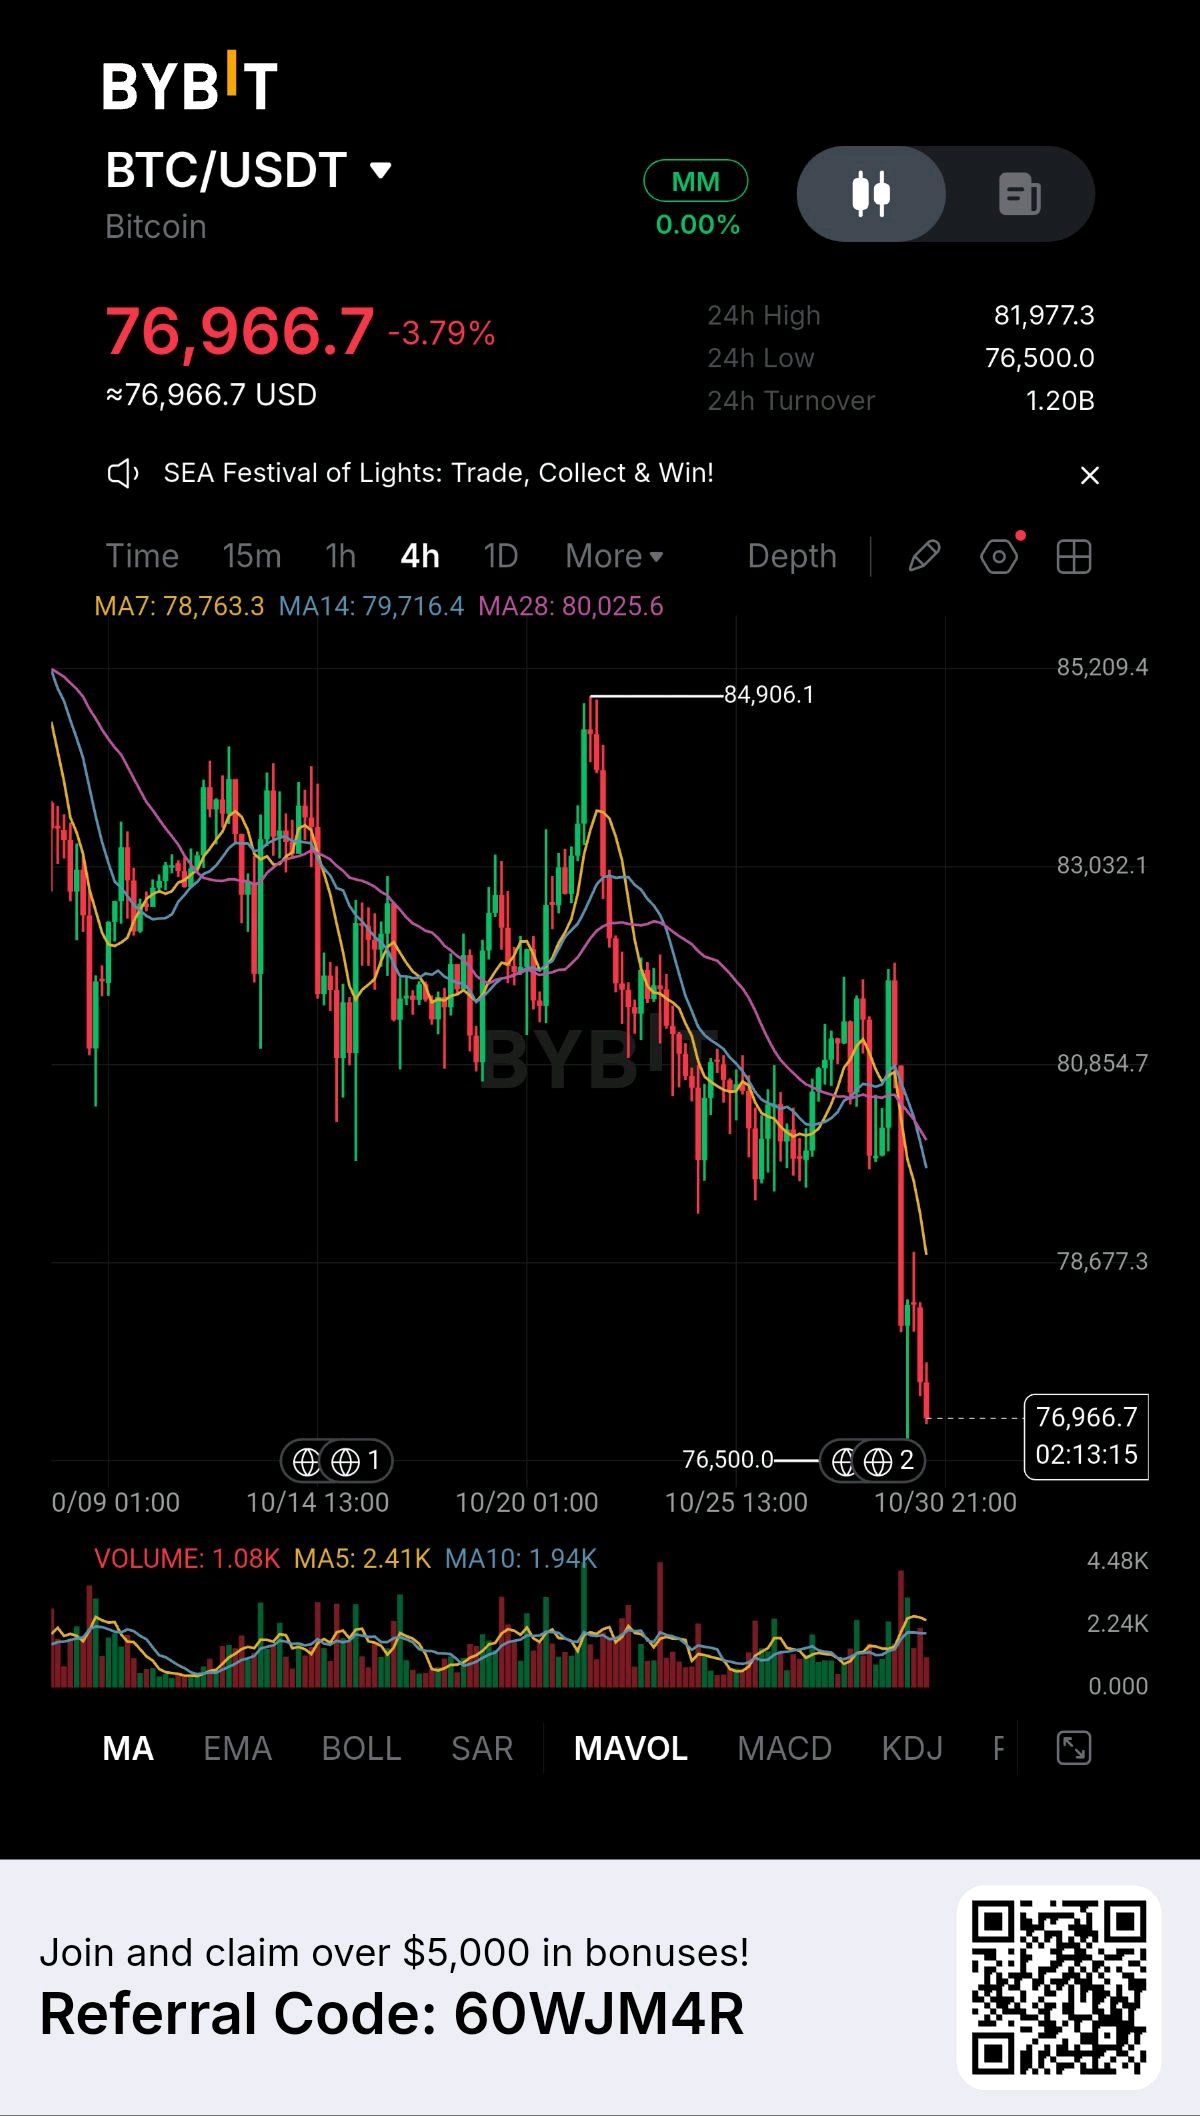
Stop staring at the $80K level. The real battle for BTC is happening right now at $76.5K. If you zoom out to the 4H chart, the picture is clear: we just lost a massive structural range from the $84.9K peak, and the price is currently pinned below the entire MA cluster (MA7, MA14, MA28). The bounce off the $76,500 low? It’s happening on weak volume. The Stochastics are deep in oversold territory, but here is the hard truth: oversold is a condition, not a catalyst. If we lose $76.2K on a daily close, the floor drops out to the $70K air pocket. Bulls need to force a reclaim of $82K just to invalidate this breakdown. Now, let’s talk about the disconnect. Retail sentiment just got destroyed. Fear & Greed plummeted from 51 to 30 in a single day, amplified by the Binance security FUD that sparked a $1.5B liquidation cascade. The Fed holding firm at 3.75%–4% hasn't helped risk assets either. But look at the institutional flow. Spot ETFs are quietly riding a 3-day inflow streak, pulling in over $424M while the retail crowd panic-sells the 4H chart. This is the exact definition of fear in the streets and accumulation in the suites. The Playbook: This isn't a "buy the dip" trap. It's a "wait for confirmation" phase. We either see a massive, volume-backed defense of $76.5K, or we wait for the $70K sweep to grab liquidity. Don't let the Fear index dictate your entries. Are you laddering bids at $70K, or waiting for a $80K reclaim to confirm the trend is back? Let’s debate below. $BTCUSDT #ByXIMPACT
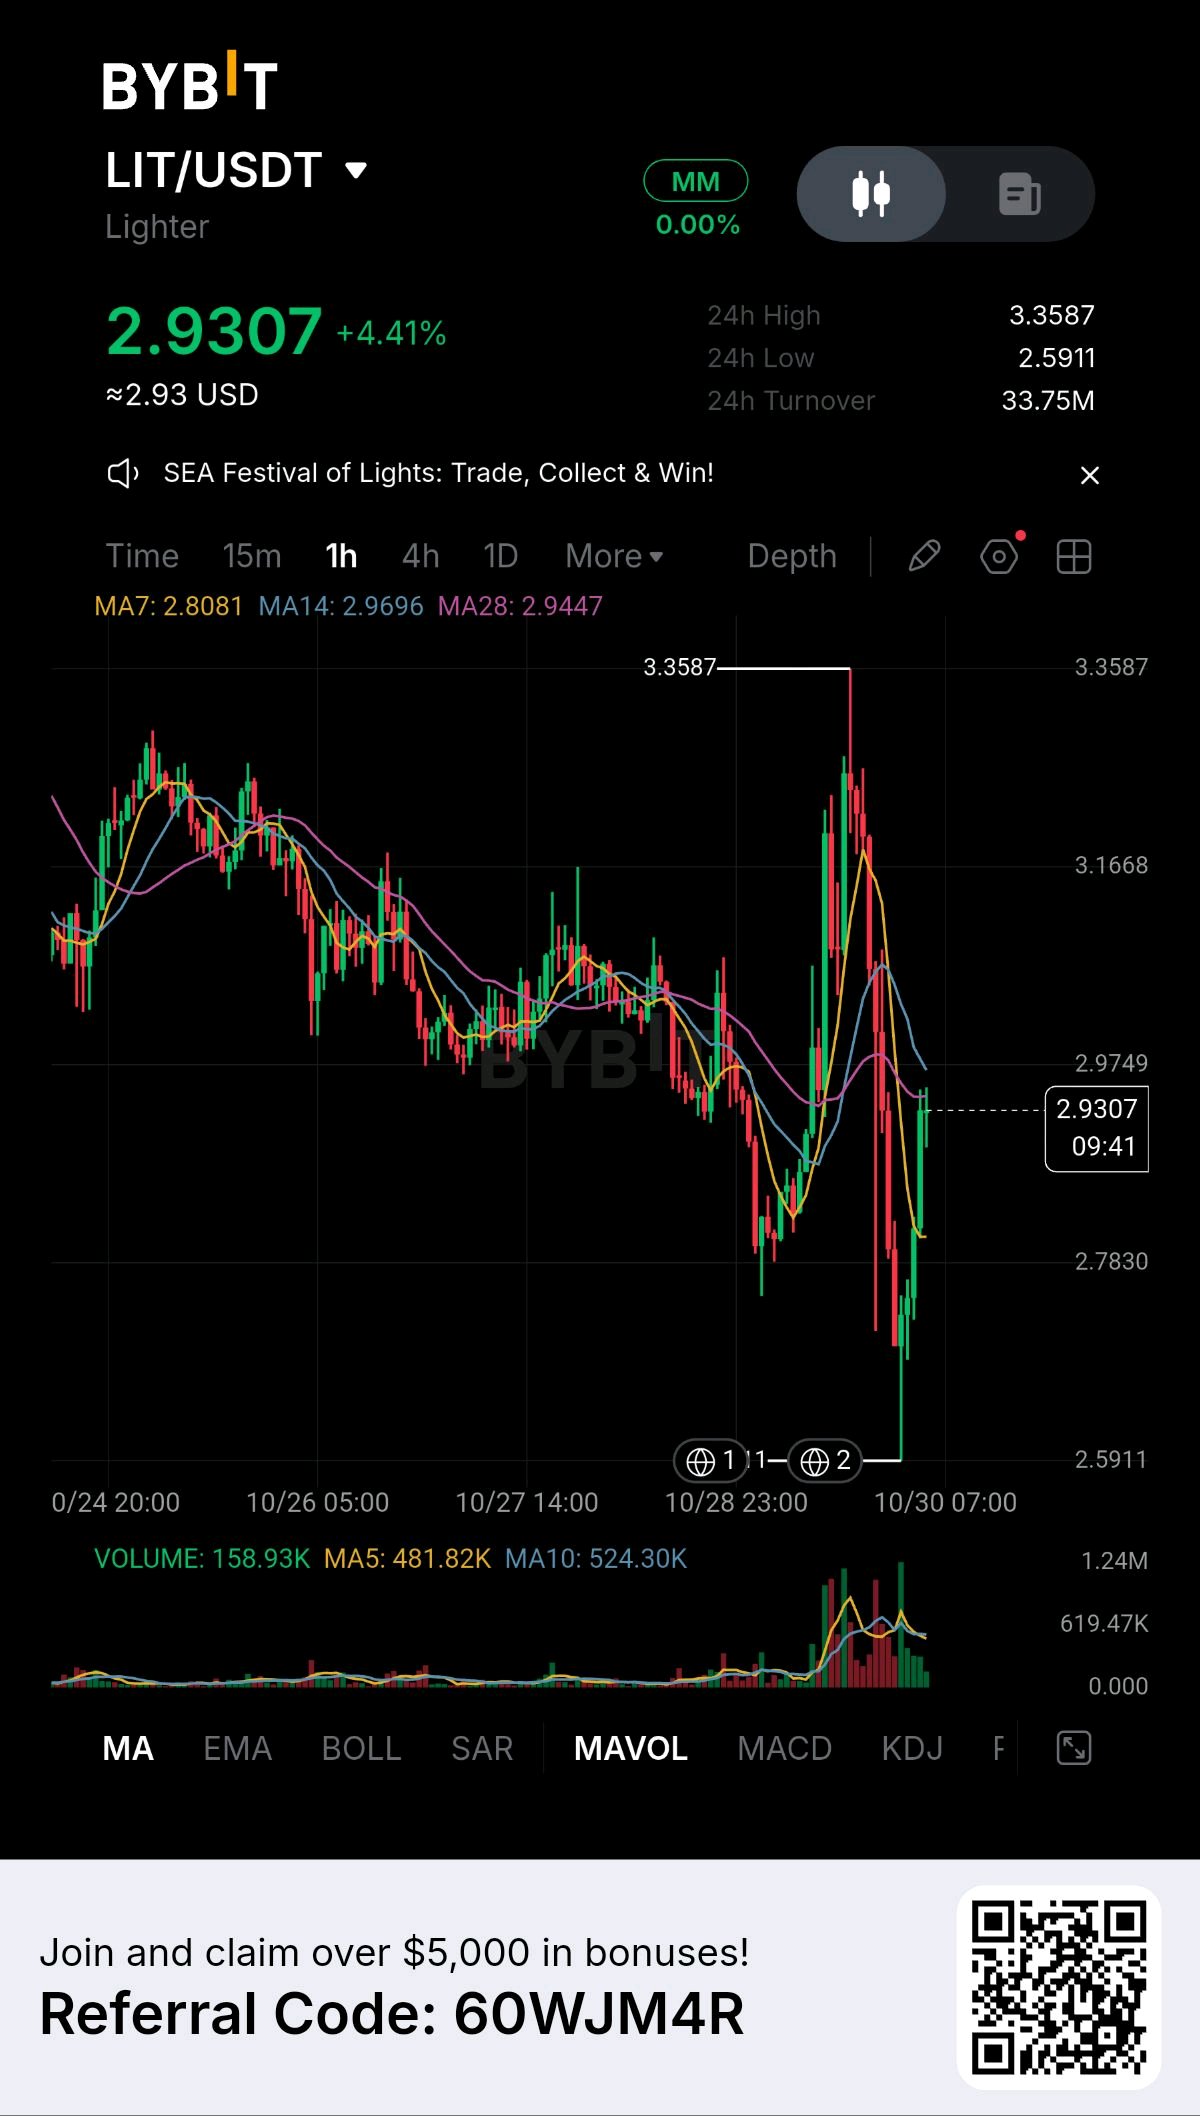
LIT gave back its entire CFTC rally in about a week, and then some. The filing it rallied on hasn't happened yet. On October 21, LIT jumped roughly 20% to around $3.85 after founder Vladimir Novakovski said Lighter plans to apply to the CFTC in November for a derivatives license. Worth being precise about what that was: an intention. No application has been filed and nothing has been approved. Today LIT sits at $2.93, about 25% below that level and under the $3.23 it traded at on October 19, before the news. In the last 24 hours alone it ranged from $2.59 to $3.36, with real volume on both the spike and the flush. I couldn't find a confirmed trigger for either. The business underneath is more concrete than the chart. Lighter spends 100% of its trading fee revenue buying LIT on the open market, and since July every repurchased token gets burned. On October 11 it burned 2,452,017 LIT from Q3, which pushed total supply below the original 1 billion cap. That's a verifiable mechanism, and the next burn will show how much revenue the protocol is actually generating. The concentration risk is just as verifiable. The Robinhood partnership accounts for about a quarter of Lighter's open interest and fee revenue, and Robinhood traders make up nearly 40% of daily active accounts. That's a strength until it isn't: when Robinhood chose Bitstamp for its US perps on September 30, LIT fell roughly 17% in a day. Lighter also still trails Hyperliquid and Aster on volume and open interest, even if its execution costs are competitive. The part that gets less attention is supply. About 250 million LIT circulate today, and team and investor allocations carry a one-year cliff, so unlocks begin around the end of 2026. One widely shared estimate is around 13.9 million LIT a month. By my math, at today's price that's roughly $40 million a month the market has to absorb, against a burn program that has so far retired about 2.45 million tokens in a quarter. So the setup is a real revenue-to-burn loop and a credible regulatory ambition, sitting on one major partner and an unlock schedule that hasn't started yet. The market already priced the filing intention once and handed it back. Does a November filing change that math, or does the market need an actual approval before LIT gets credit for it? $LITUSDT #ByXIMPACT
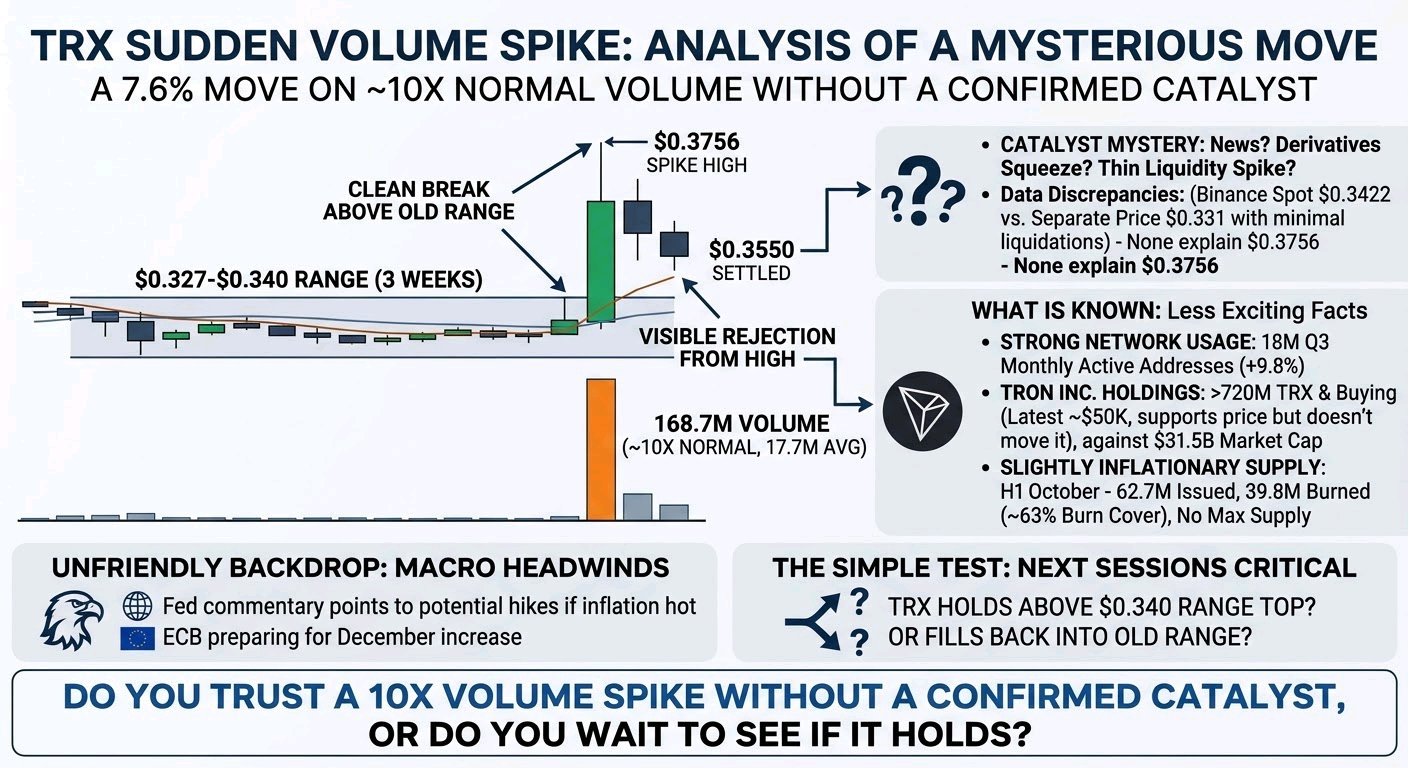
TRX did a 7.6% move on nearly ten times its normal volume. Nobody I can find has a confirmed reason for it, and that's the part worth taking seriously. For three weeks TRX sat in a $0.327-0.340 range with its averages stacked almost flat, a token that turns over about 1% of its value a day. Then one 4-hour candle ripped to $0.3756 on 168.7M in volume, against a recent average near 17.7M. It settled at $0.3550 after handing back roughly 44% of the spike's range. That's a clean break above the old range top, and a visible rejection from the high, in the same candle. I looked for the catalyst and the data doesn't agree with itself. A Binance spot reading earlier showed $0.3422 with only $310K in liquidations across three exchanges. A separate price page still showed TRX near $0.331. Neither explains $0.3756. So this could be news, a derivatives squeeze, or a thin-liquidity spike, and a single candle can't tell you which. What's actually known is less exciting than the candle. Network usage is strong: monthly active addresses hit 18M in Q3, up 9.8%. Tron Inc. holds over 720M TRX and keeps buying, but its latest purchase was about $50,000 against a market cap near $31.5B, which supports the price without moving it. Supply is also slightly inflationary right now. In the first half of October, about 62.7M TRX were issued against 39.8M burned, so burns covered roughly 63% of issuance, with no maximum supply. Record activity and a flat token price have coexisted for most of this year. The backdrop isn't friendly either. Fed commentary this week has leaned toward hikes if inflation stays hot, and the ECB is reportedly preparing for a December increase. A breakout into that needs its own reason, and I can't find one yet. So the test is simple: does TRX hold above the old $0.340 range top over the next few sessions, or fill back into the range it just left? Do you trust a ten-times-volume spike without a confirmed catalyst, or do you wait to see if it holds?. #ByXIMPACT $TRXUSDT
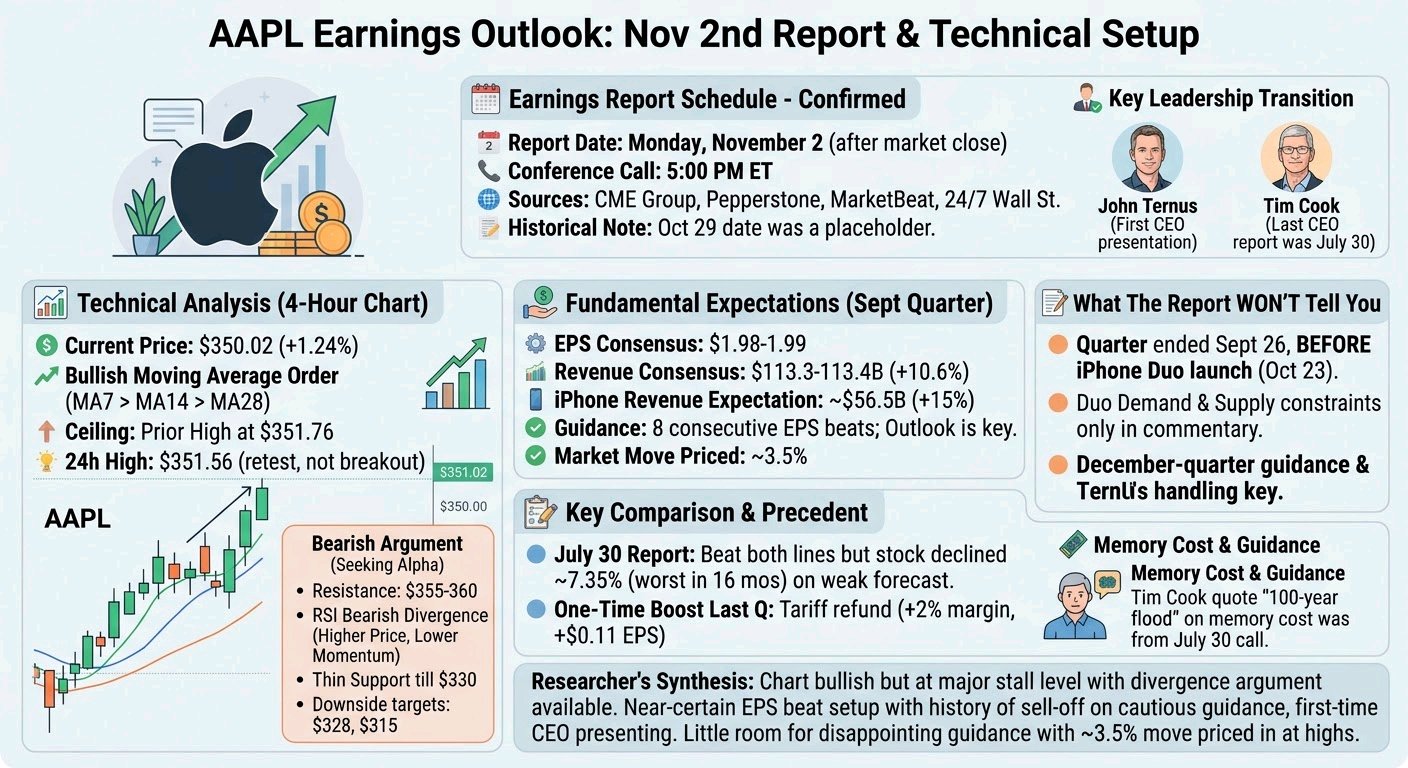
Earlier I flagged conflicting sources on whether Apple reports October 29 or November 2. That's resolved. Apple has announced Monday, November 2, after the close, with the call at 5:00pm ET. CME Group, Pepperstone, MarketBeat's forward calendar and 24/7 Wall St. all agree, and one cites the announcement as reported on October 6. The "October 29" listing I saw was a placeholder page with no actual results. Also settled: the "100-year flood" memory-cost quote came from Tim Cook on the July 30 call, his last as CEO, so that attribution was accurate when made. John Ternus will give his first earnings presentation as CEO on November 2. Technical read: pressing against the all-time high two sessions before the report The 4-hour chart shows AAPL at $350.02, up 1.24%, after a run from the $344 area through a cluster of green candles. The moving averages are in clean bullish order (MA7 347.36 > MA14 347.08 > MA28 346.11) with price above all three. The ceiling is the prior high at $351.76, and the 24h high of $351.56 stopped just short of it. This is a retest of the highs, not a breakout yet. One bearish technical argument is circulating: Seeking Alpha flags resistance at $355-360, a bearish RSI divergence (price making highs while momentum doesn't), and thin support until $330, with a break of the uptrend targeting $328 or $315. Fundamental context: the bar is set, and last quarter shows how this stock handles it Consensus for the September quarter is roughly $1.98-1.99 EPS on $113.3-113.4B revenue (+10.6%), with iPhone revenue expected up about 15% to $56.5B. The options market is pricing a move of roughly 3.5% either way. The comparison problem is real: last quarter's results included a one-time tariff-refund boost worth about two points of gross margin and $0.11 of EPS. Gross margin is guided to 47-48%, and FactSet consensus has growth falling to single digits for most of next year. The precedent is the key data point. After the July report, which beat on both lines, Apple suffered its worst stock decline in 16 months (about 7.35%) on a weak forecast. It then recovered over the following month. Apple has beaten EPS estimates in 8 of its last 8 quarters (one source says nine), so beating isn't the question. Guidance is. What the report can't tell you The quarter ended September 26, before the iPhone Duo launched on October 23. Duo demand and supply constraints will only show up in management commentary, not in the numbers. That makes the December-quarter guide, and how Ternus handles supply and memory costs, the real test. Researcher's synthesis: the chart is bullish in structure but sitting at the exact level where it has stalled before, with a bearish divergence argument available to anyone who wants it. The fundamentals have a clean setup: a near-certain EPS beat, a documented history of selling off on cautious guidance, and a first-time CEO presenting. Over the next two sessions, price action matters less than positioning, since a stock at record highs into a ~3.5% priced move has little room for a guidance disappointment. #ByXIMPACT $AAPLXUSDT
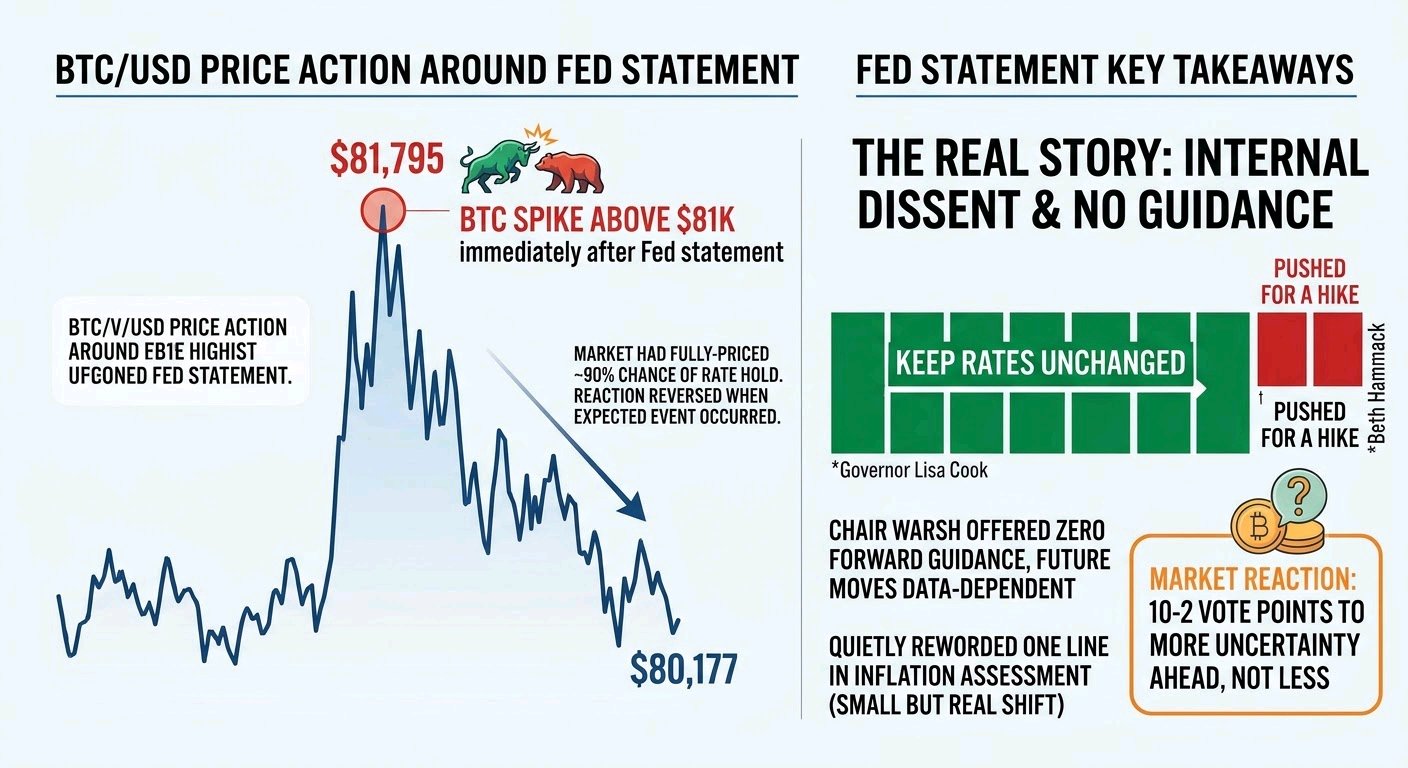
**BTC spiked above $81,000 the second the Fed's statement hit. Within hours it gave the whole move back. That's the real story, not the headline "Fed holds rates."** This is exactly the pattern worth watching for around a fully-priced event: the chart shows a brief pop to $81,795, then a steady fade back to $80,177, down 1.45% on the day. Markets had already priced a roughly 90% chance of a hold before the meeting. When the expected thing happens, there's often nothing left to trade on, and price gives the reaction back. That's what happened here. The headline is simple, the Fed held at 3.75%-4%. The internals aren't. This was a 10-2 vote, not unanimous. Two voting members, Governor Lisa Cook and Cleveland Fed President Beth Hammack, pushed explicitly for a hike instead. That's nearly a fifth of the committee wanting tighter policy inside a decision everyone's calling a pause. Chair Warsh gave no forward guidance, said future moves depend entirely on incoming data, and reporting notes the Fed quietly reworded one line in its inflation assessment, a small but real shift buried inside a statement framed as "no action." What matters more than any of that for the next 24 hours: the September PCE report, the Fed's preferred inflation gauge, lands today at 8:30am ET. Given Warsh explicitly said future decisions are data-dependent and offered zero forward guidance, this print carries real weight for where December rate odds land. A December hike is still explicitly on the table, not ruled out because October held. So the honest read is this: the market got the outcome it expected, reacted the way markets usually do to fully-priced events, and the actual signal, two hawkish dissents and no guidance, points toward more uncertainty ahead, not less. With PCE data landing right behind this, are you reading today's fade as the move already being over, or as the market waiting for the number that actually tells the next part of the story? $BTCUSDT #ByXIMPACT
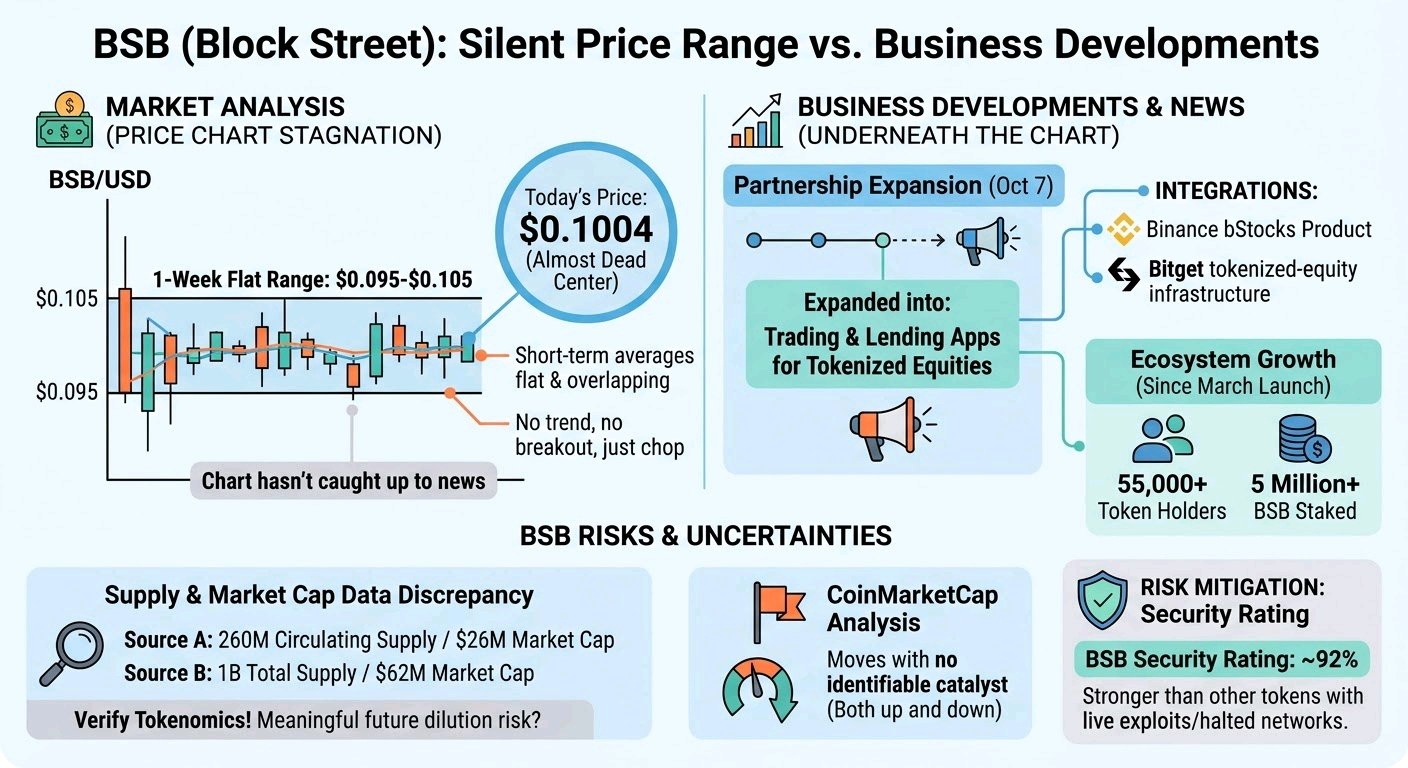
BSB has been stuck in the same $0.095-$0.105 range for a week while the business behind it just landed a real partnership expansion. The chart hasn't caught up to the news yet, if it ever does. Price is sitting at $0.1004 today, almost dead center in a range that's held for days, with every short-term average flat and overlapping. No trend, no breakout, just chop. That's worth knowing upfront, because what follows isn't a breakout story, it's a "here's what's actually happening underneath a quiet chart" story. On October 7, Block Street announced it's expanding from pure liquidity infrastructure into powering actual trading and lending applications for tokenized equities, with named integrations into Binance's bStocks product and Bitget's tokenized-equity infrastructure. That's a real, dated development with named partners, not a roadmap promise. Since its March launch, the ecosystem has grown past 55,000 token holders, with over 5 million BSB staked shortly after staking went live. Here's something worth being upfront about instead of glossing over: supply and market cap figures for this token disagree significantly across sources. One puts circulating supply at 260 million against a $26 million market cap. Another cites a billion-token total supply with a nearly $62 million cap that looks like a stale snapshot. If the lower circulating figure is right, there's meaningful future dilution ahead. If the higher one is right, there isn't. That's not a small detail, and it's worth checking against the project's own tokenomics before assuming either way. One thing that is clear: BSB's security rating sits around 92%, notably stronger than several other tokens that came up in research this week, a few of which are dealing with live exploits or halted networks. That's a real point in its favor on risk, separate from the price question entirely. Even CoinMarketCap's own analysis has flagged moves here with no identifiable catalyst, both up and down. That matches what the chart shows right now: real partnership news, a quiet range, and a market that hasn't decided what to do with either yet. Are you watching this range as accumulation ahead of the business catching up, or does the unresolved supply question keep you on the sidelines until it's clarified? $BSBUSDT #ByXIMPACT
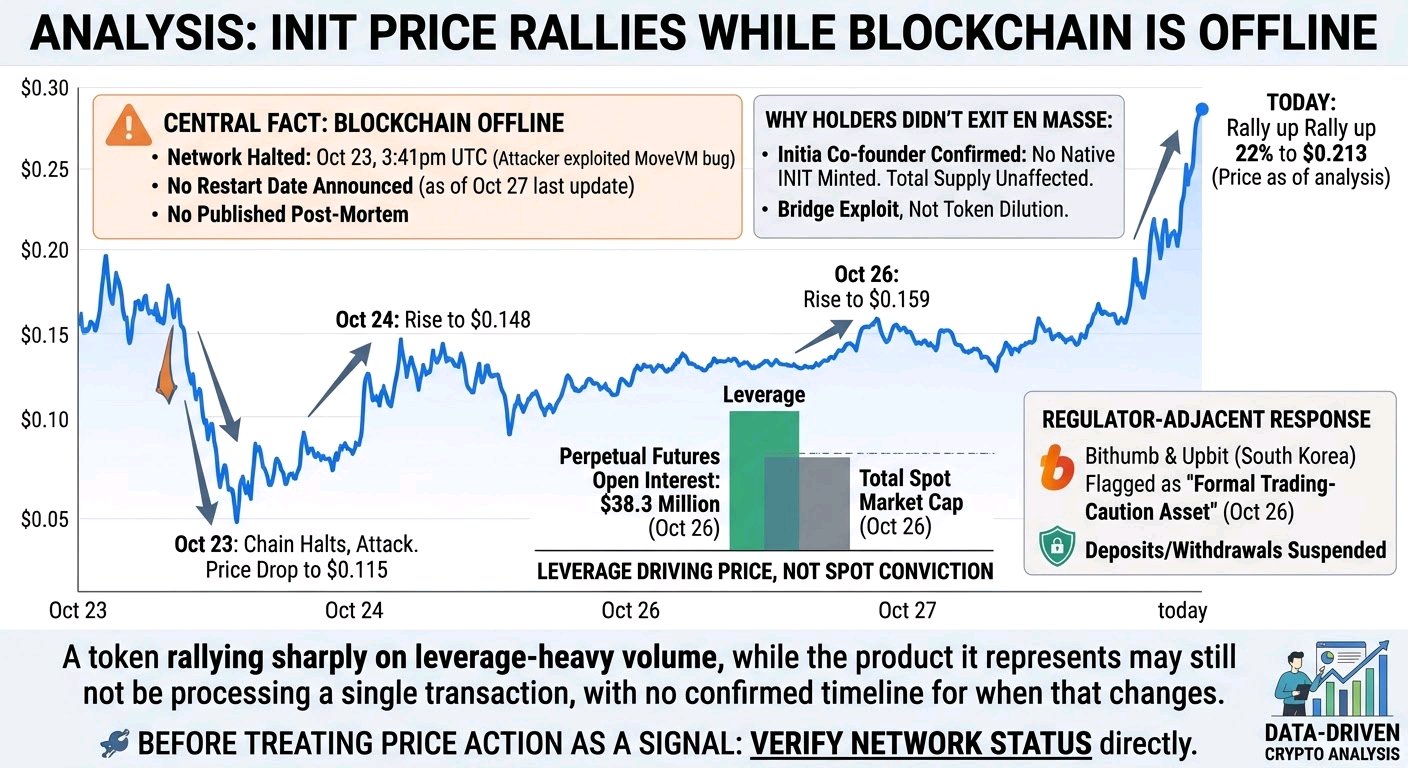
INIT is up 22% today. Last confirmed report says the blockchain it's supposed to represent has been offline since October 23, with no restart date announced. That's not a caveat buried in the fine print, it's the central fact. The chain halted at 3:41pm UTC on October 23 after an attacker exploited a script-caching bug in MoveVM, spoofing the chain's state to mint unbacked WETH, iUSD, and USDC and moving roughly $2.7 million off-chain. As of the last confirmed update, October 27, there was still no restart date and no published post-mortem. I found nothing confirming the network has resumed since. Before treating any of this price action as a signal, that status is worth verifying directly. Here's what's kept this from being a total collapse: Initia's co-founder confirmed no native INIT was minted and total supply is unaffected. This was a bridge exploit, not a dilution event for the token itself, and that distinction is likely why holders didn't simply exit en masse. What they did instead is trade it hard, in both directions, for a week straight. INIT dropped to $0.115 right after the news broke, then reversed the same day. It climbed to $0.148 on October 24, $0.159 on October 26, and now $0.213 today, three separate rallies stacked across a period the network has been confirmed offline for at least part of. On October 26, perpetual futures open interest sat at $38.3 million, above the token's entire spot market cap at the time. That's leverage driving price, not spot conviction. South Korea's two largest exchanges, Bithumb and Upbit, both flagged INIT as a formal trading-caution asset on October 26 under investor-protection law, with deposits and withdrawals suspended on both. That's a regulator-adjacent response, not a routine notice. So the honest picture is this: a token rallying sharply on leverage-heavy volume, while the product it represents may still not be processing a single transaction, with no confirmed timeline for when that changes. Before anyone reads this chart as recovery, has the network actually come back online, or is this entirely a leverage-driven bet on a restart that hasn't happened yet? #ByXIMPACT $INITUSDT
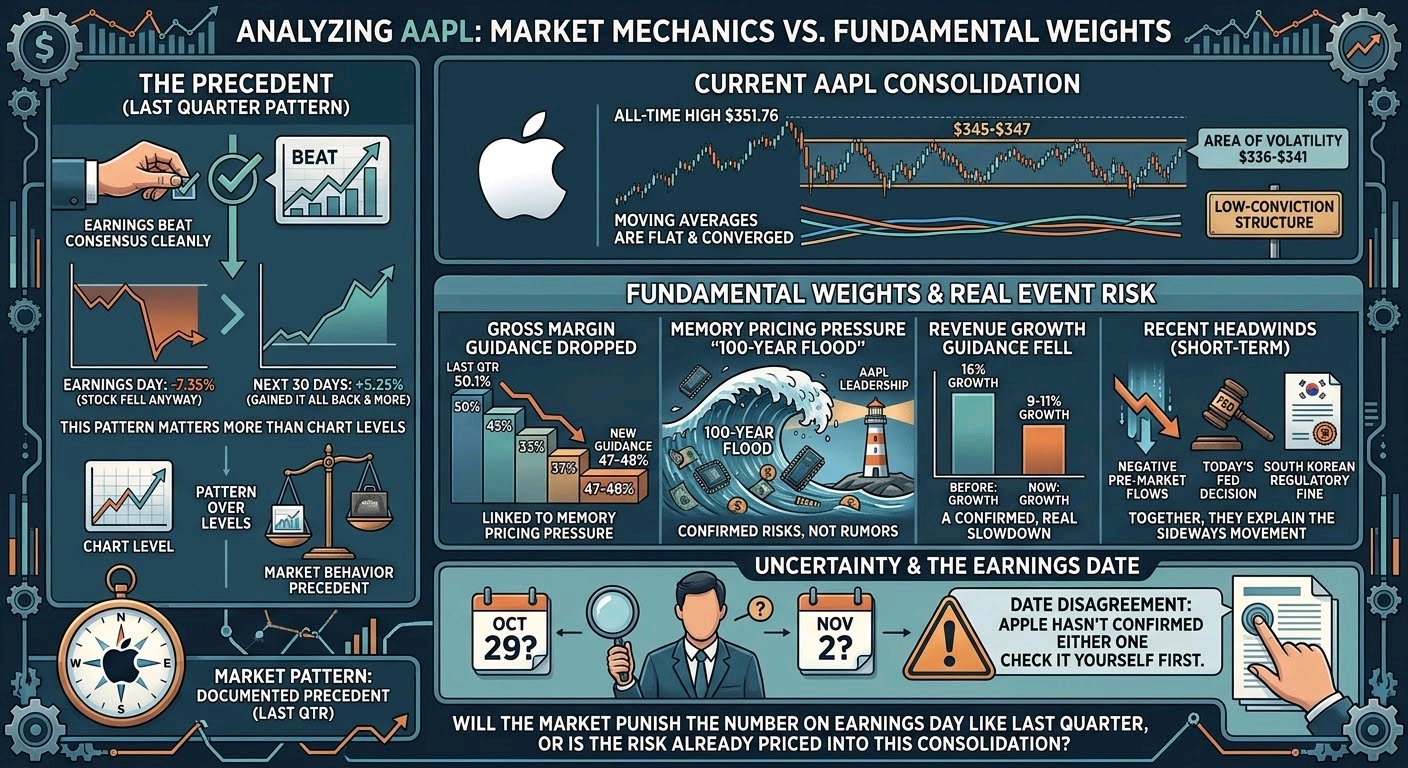
Apple's last earnings beat consensus cleanly and the stock still fell 7% on the day. Then it gained it all back and more over the next month. That pattern matters more right now than any chart level. AAPL is consolidating near $345-347 after round-tripping its all-time high of $351.76 and a sharp drop into the $336-341 range last week. Moving averages are flat and converged, the same low-conviction structure that's shown up in this stock for weeks now. That's not random. Real event risk is stacked on top of it. Here's what's actually weighing on the stock: gross margin guidance has dropped to 47-48% from 50.1% last quarter, tied directly to memory pricing pressure Apple's own leadership has called a "100-year flood." Revenue growth guidance fell to 9-11% from 16% the quarter before. That's a confirmed, real slowdown, not speculation. Pre-market money flows in AAPL were negative heading into today's Fed decision, which lands the same day as a South Korean regulatory fine Apple says it's disputing. None of these on their own is large. Together they explain why the stock keeps going sideways instead of picking a direction. Worth being straight about something most coverage isn't: sources currently disagree on the actual earnings date, some point to October 29, others say November 2 and note Apple hasn't confirmed either one. Don't trust a specific date on this without checking it yourself first, because the reporting itself is split right now. What we do know is the pattern from last quarter. Apple beat estimates cleanly, fell 7.35% on earnings day anyway, then recovered 5.25% over the following 30 days. That's not a guarantee it repeats. But it's a real, documented precedent for how this market has handled a "good quarter, cautious guide" setup recently, and it's more useful than guessing at a chart pattern in a stock that's barely moved in two weeks. Given margin pressure is now confirmed and guided, not rumored, are you expecting the market to punish the number on earnings day the same way it did last quarter, or has that risk already been priced into this consolidation? $AAPLXUSDT #ByXIMPACT
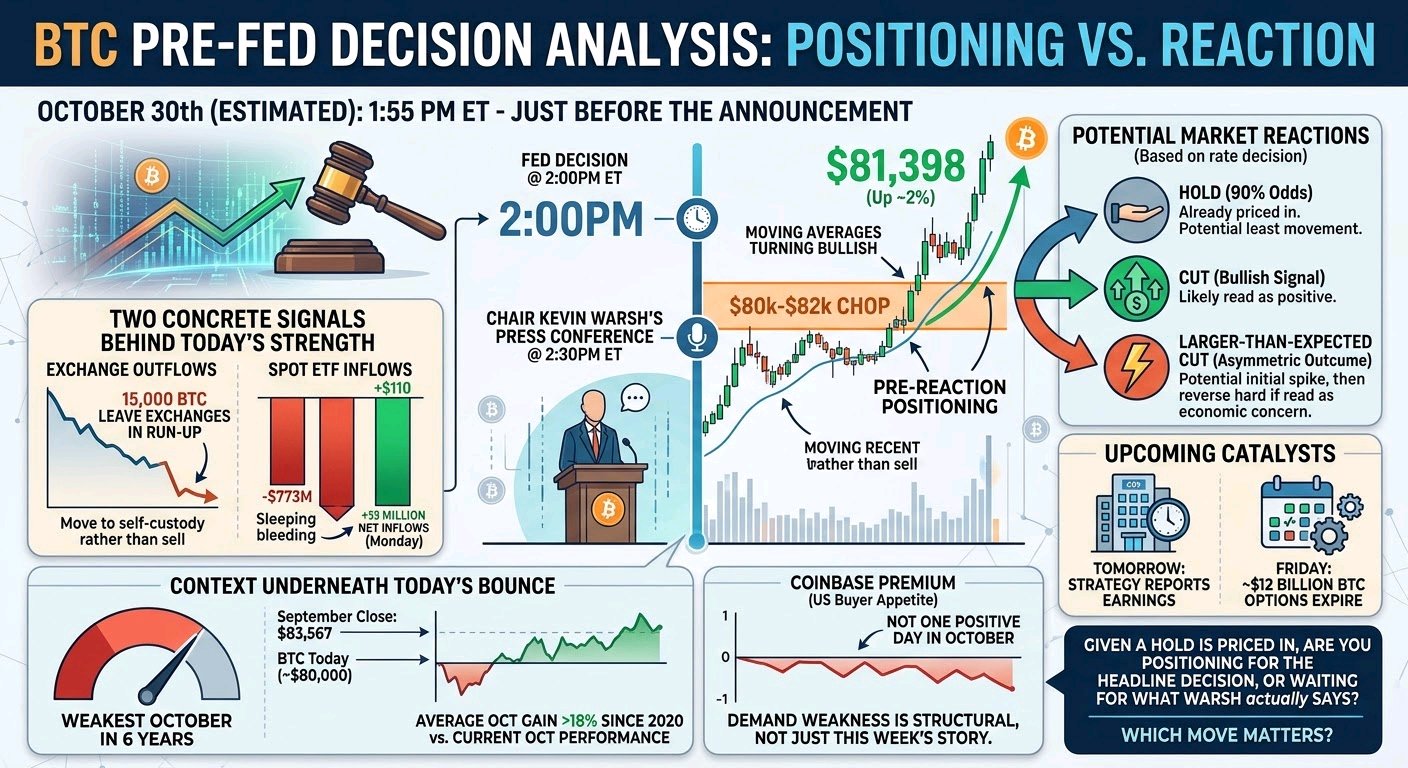
BTC is up almost 2% heading into the Fed decision today. The move that actually matters hasn't happened yet, it's still four hours away. The chart shows a genuine break above last week's $80,000-82,000 chop, up to $81,398, with moving averages turning bullish right as the market heads into the announcement. Worth being precise about timing here: the Fed's decision lands at 2:00pm ET, with Chair Kevin Warsh's press conference thirty minutes after. Everything on this chart right now is positioning ahead of that, not a reaction to it. Two real signals are behind today's strength specifically. Nearly 15,000 BTC left exchanges in the run-up to the decision, typically read as holders moving into self-custody rather than preparing to sell. And spot ETFs pulled in $110 million in net inflows Monday, snapping two sessions that had bled $773 million combined. Both are concrete, dateable data points, not sentiment. Here's the context worth holding onto underneath today's bounce: October has been genuinely weak. BTC closed September at $83,567 and sat near $80,000 heading into today, putting the month on track to be the weakest October in six years, against an average October gain of over 18% since 2020. Coinbase Premium, a rough gauge of US buyer appetite, hasn't had a single positive day this month. The demand weakness is structural, not just this week's story. Markets are pricing roughly 90% odds of a hold today. That's worth sitting with precisely because it's the least interesting outcome, not the most. A hold is already baked in, so it's arguably the scenario least likely to move price much. A cut would likely be read as bullish. A larger-than-expected cut could spike price initially, then reverse hard if the market reads it as the Fed signaling real concern rather than confidence. The outcomes aren't symmetric, and the "expected" one isn't necessarily the one that moves the chart. Right behind today: Strategy reports earnings tomorrow, and roughly $12 billion in BTC options expire Friday. Given a hold is already priced in and historically the least reactive outcome, are you positioning for the headline decision, or waiting for what Warsh actually says in the press conference afterward? $BTCUSDT #ByXIMPACT
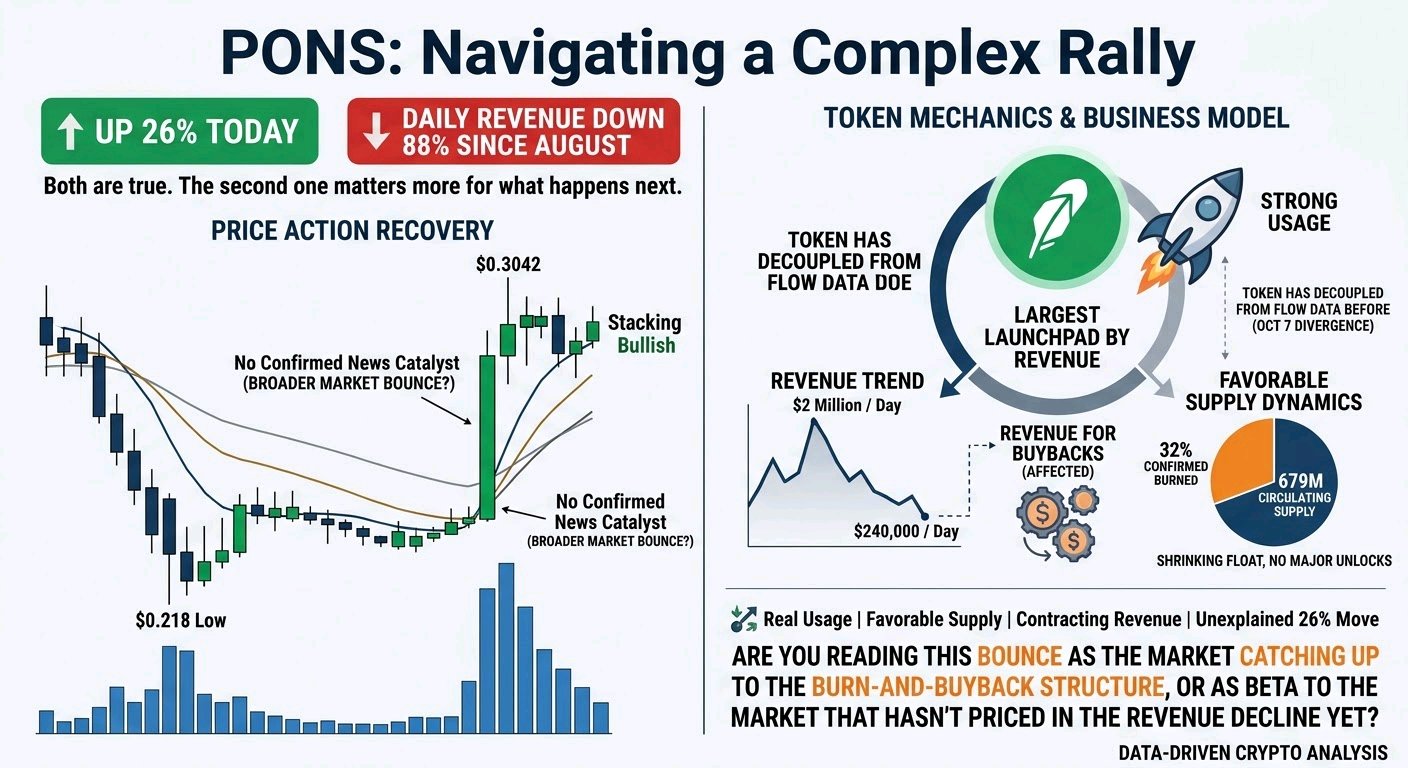
PONS is up 26% today. Its daily revenue is down 88% since August. Both of those are true at the same time, and the second one matters more for what happens next. The chart shows a real recovery, not a wick: a drop to $0.218, a base, then a sharp move to $0.3042 on the heaviest volume this chart has seen, settling at $0.3012. Moving averages are stacked cleanly bullish. I couldn't find a specific news catalyst for today's move in current coverage, worth saying plainly rather than inventing one. It may be tied to the broader market bounce happening this same week, or to the token's own mechanics below. Either way, the move is real on the chart; the cause isn't fully confirmed yet. Here's the part worth knowing before getting pulled into the green candle. PONS is the token for a launchpad on Robinhood Chain that's moved over $7 billion in volume since July, the largest launchpad on that chain by revenue and fees. That's a genuine business. But daily revenue fell from roughly $2 million at its late-August peak to about $240,000 by early October, an 88% decline in six weeks. That matters directly for the token, because the protocol routes roughly 80% of fee revenue into automated buybacks. Less revenue means a smaller buyback engine, mechanically, no matter what the chart does. What's actually working in PONS's favor structurally: 32% of the original 1 billion supply has been confirmed burned, leaving about 679 million circulating, with no major unlock schedule hanging over it the way several other small-caps reviewed this week have. Shrinking float plus an automated buyback is a genuinely different setup than a token facing years of future dilution. There's also a real precedent for this token decoupling from simple supply and demand. On October 7, PONS rose over 10% even as both spot and perpetual markets showed more selling than buying, a documented divergence at the time. Worth knowing that this token has moved against its own flow data before. So: real usage, favorable supply mechanics, a revenue base that's contracting sharply, and a 26% move today without a confirmed reason yet. Are you reading this bounce as the market catching up to the burn-and-buyback structure, or as beta to the broader market that hasn't priced in the revenue decline yet? #ByXIMPACT $PONSUSDT
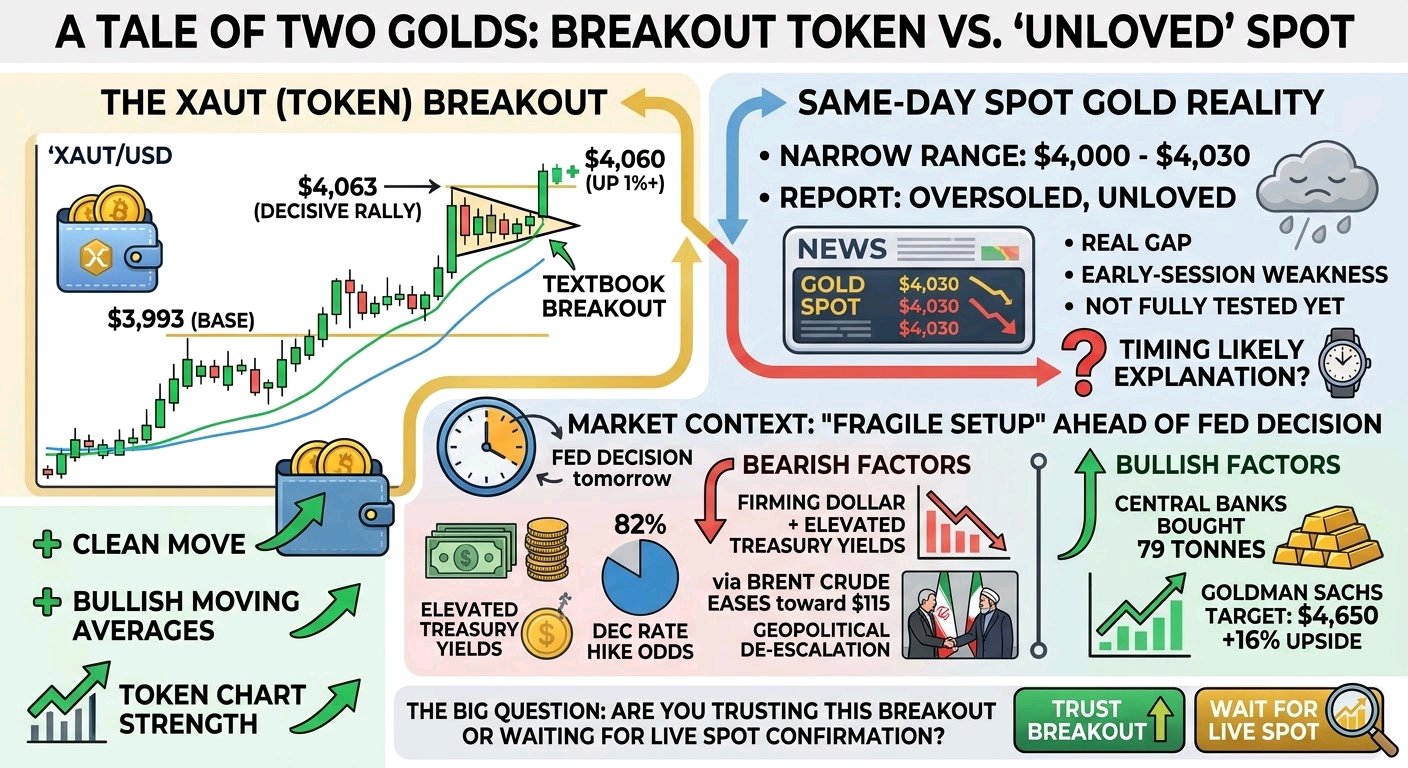
XAUT just broke out to $4,060. Same-day reporting on spot gold describes it as weak and "unloved" near $4,000. Before trading either story, it's worth knowing both exist. The token chart shows a clean move: a drop to $3,993, a base, then a decisive rally through $4,063 before settling at $4,060, up just over 1%, with moving averages stacked tightly in bullish order. Taken alone, that's a textbook breakout. But multiple reports from earlier the same day describe actual spot gold trading in a narrow $4,000-4,030 range, with one calling the market "oversold, unloved, and one headline away from either a relief extension or a fresh low." That's a real gap between what the token chart shows and what spot gold was doing in the hours before it. The likely explanation is simple timing, early-session weakness giving way to a later rally, but it's worth checking live spot pricing before treating this breakout as confirmed rather than a late-session move that hasn't been fully tested yet. The setup heading into tomorrow's Fed decision is genuinely fragile either way. Standard Chartered's commodities head called this a "critical juncture" for gold, warning that support could fade quickly below $3,886, with a break under $3,900 opening a path toward $3,800. The pressure has come from a firming dollar and elevated Treasury yields, with markets now pricing an 82% chance of a December rate hike. Gold's pullback this week also tracked a real geopolitical de-escalation: Brent crude easing toward $115 as Saudi, Turkish, and Pakistani officials opened talks in Tehran, cooling the oil-to-inflation channel that had been pushing gold higher. Not everything points one way, though. Central banks reportedly bought 79 tonnes of gold recently, real structural demand running underneath the short-term dollar-driven selling. And even after Goldman Sachs cut its year-end target from $4,900 to $4,650, that still implies roughly 16% upside from current levels. So: a token chart showing strength, spot gold reporting showing weakness on the same day, a fragile technical level ahead of tomorrow's Fed decision, and central banks still buying through all of it. Given that gap between the token and spot pricing, are you trusting this breakout, or waiting to see it confirmed against live spot gold first? #ByXIMPACT $XAUTUSDT
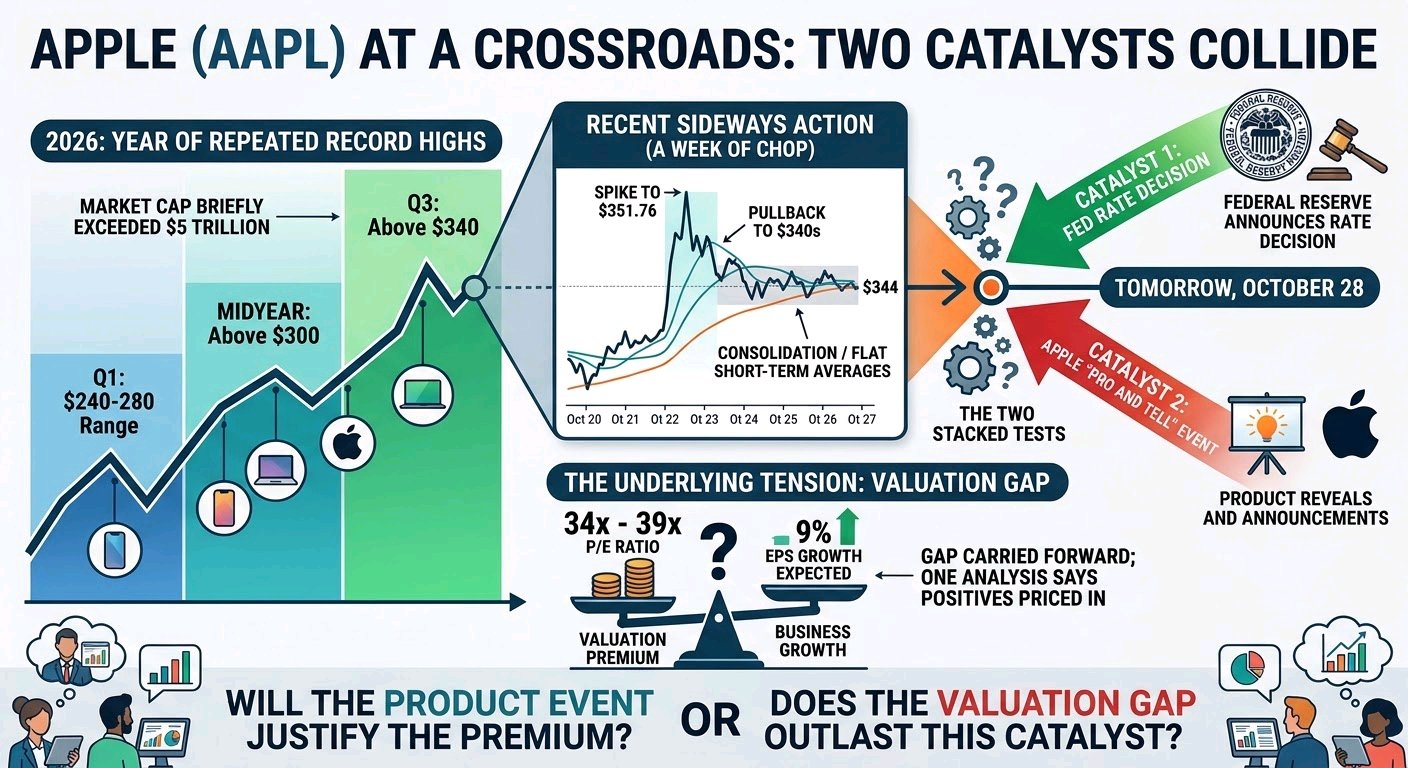
Apple's stock has gone sideways for a week. Tomorrow it gets hit with two separate catalysts on the same day, and that's exactly why it's been sitting still. The chart shows a spike to $351.76, a pullback into the low-to-mid $340s, and a consolidation that's left the short-term averages flat and converged around $344. That's not drift. Tomorrow, October 28, Apple holds its "Pro and Tell" product event — and the Federal Reserve announces its rate decision the same day. Two genuine, independent catalysts landing simultaneously is a real reason for a market to pause rather than commit to a direction this week. Worth knowing the bigger picture this sits inside: 2026 has been a year of repeated record highs for Apple, not a single spike that stalled. The stock ran from a $240-280 range in Q1 to above $300 by midyear, above $340 by Q3, and kept setting new highs into October — briefly pushing the company's market cap above $5 trillion. Against that backdrop, a week of sideways chop reads as a pause inside a strong trend, not the start of a breakdown. The tension that hasn't gone away is valuation. AAPL trades somewhere between 34x and 39x earnings depending on which measure you use, against analyst expectations of roughly 9% EPS growth this fiscal year. One analysis put it plainly: the positives are already priced in. That gap between what the stock costs and what the business is actually growing hasn't closed through any catalyst so far this year — it's just been carried forward to the next one. So tomorrow isn't really one test, it's two stacked on top of each other: whatever Apple announces at its event, and whatever the Fed says about rates, both landing within hours of each other on a stock that's already trading ahead of its own growth rate. Are you expecting tomorrow's product event to be the thing that finally justifies the premium, or do you think the valuation gap outlasts this catalyst too? #ByXIMPACT $AAPLXUSDT
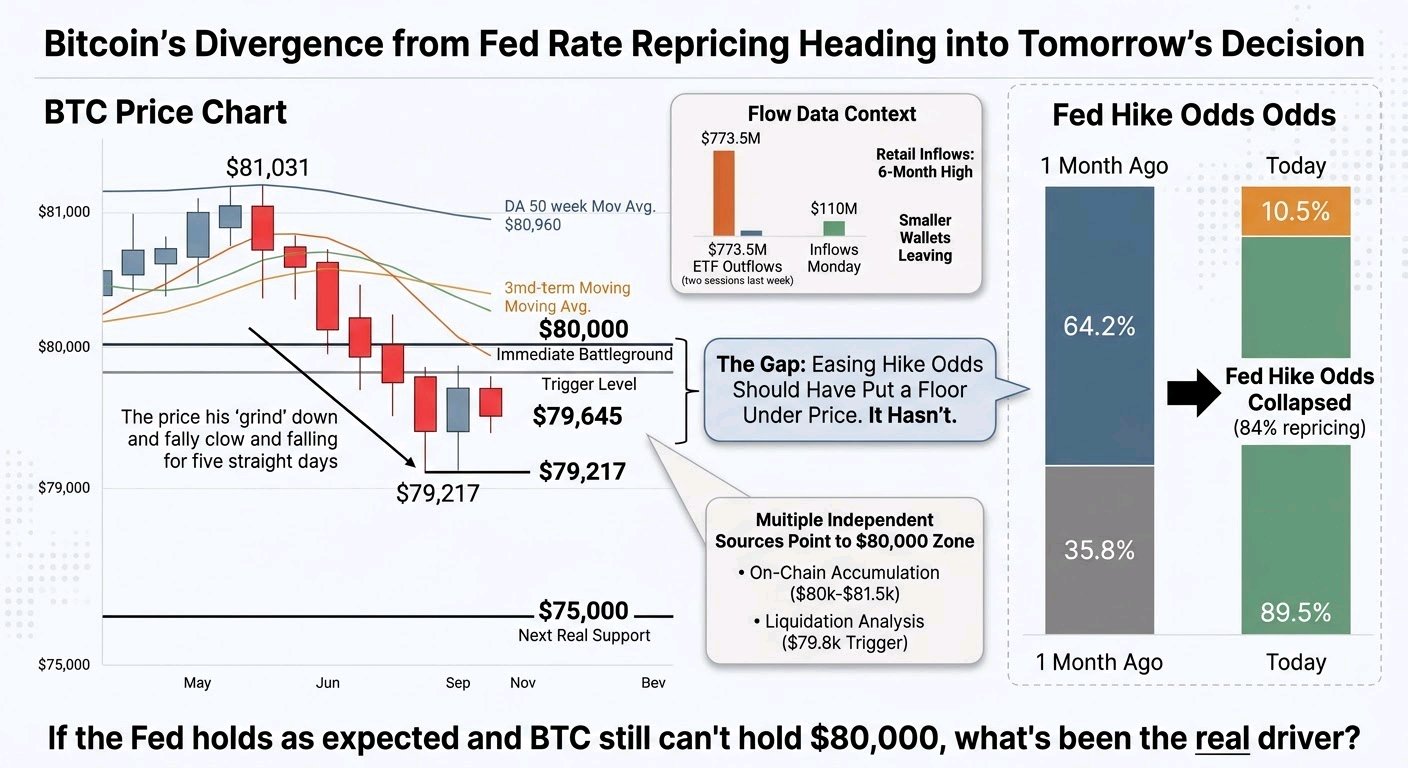
Fed hike odds collapsed from 64% to 10% over the past month. Bitcoin kept falling anyway. That gap is the actual story heading into tomorrow's decision. The chart shows a clean lower-high, lower-low grind: a bounce off $79,217 up to $81,031, now sliding back to $79,645, sitting below all three short-term moving averages and below the daily 50-week average near $80,960. BTC has fallen five straight days on the daily chart. The level everyone's watching is $80,000 — multiple independent sources call it the immediate battleground, with $75,000 the next real support if it breaks. Here's what makes this setup worth separating carefully from the usual pre-Fed noise: a month ago, markets priced a 64.2% chance the Fed would hike rates at tomorrow's meeting. As of this morning, that's collapsed to just 10.5%, with a 89.5% probability of a hold now priced in. That's about as dovish a repricing as you'll see in four weeks. And Bitcoin kept selling off through all of it. If rate-hike fear were driving this leg down, easing hike odds should have put a floor under price. It hasn't. That's worth sitting with rather than assuming tomorrow's statement automatically fixes anything. The flow data backs up that this isn't one simple story. ETFs lost $773.5 million across two sessions last week, then flipped to a $110 million inflow Monday, with retail inflows hitting a 6-month high the same day — while smaller wallets kept leaving. Different buyers are doing different things right now, not moving together. There is real evidence the $80,000 zone matters, not just as a round number. On-chain data placed recent accumulation specifically in the $80,000-$81,500 range, and a separate liquidation analysis flagged roughly $79,800 as a trigger level worth watching, not a guaranteed floor. Two different methods pointing at the same zone is a stronger signal than either alone. So: a market that's already gotten the dovish surprise it needed on rate expectations and sold off anyway, sitting right on a level several independent data sources agree matters, hours ahead of the actual announcement. If the Fed holds as expected tomorrow and BTC still can't hold $80,000, what does that tell you the real driver has been this whole time? $BTCUSDT #ByXIMPACT $BTCUSDC