Crypto BOSS
122897Like92Shares1222Fans2Follow
📊 Crypto Boss 📈 Technical Analysis | Market Structure & Whale Dynamics 💎 Decoding Crypto Trends & Real-World Assets 👇 Explore Daily Setup & Deep Insights
📊 Crypto Boss 📈 Technical Analysis | Market Structure & Whale Dynamics 💎 Decoding Crypto Trends & Real-World Assets 👇 Explore Daily Setup & Deep Insights
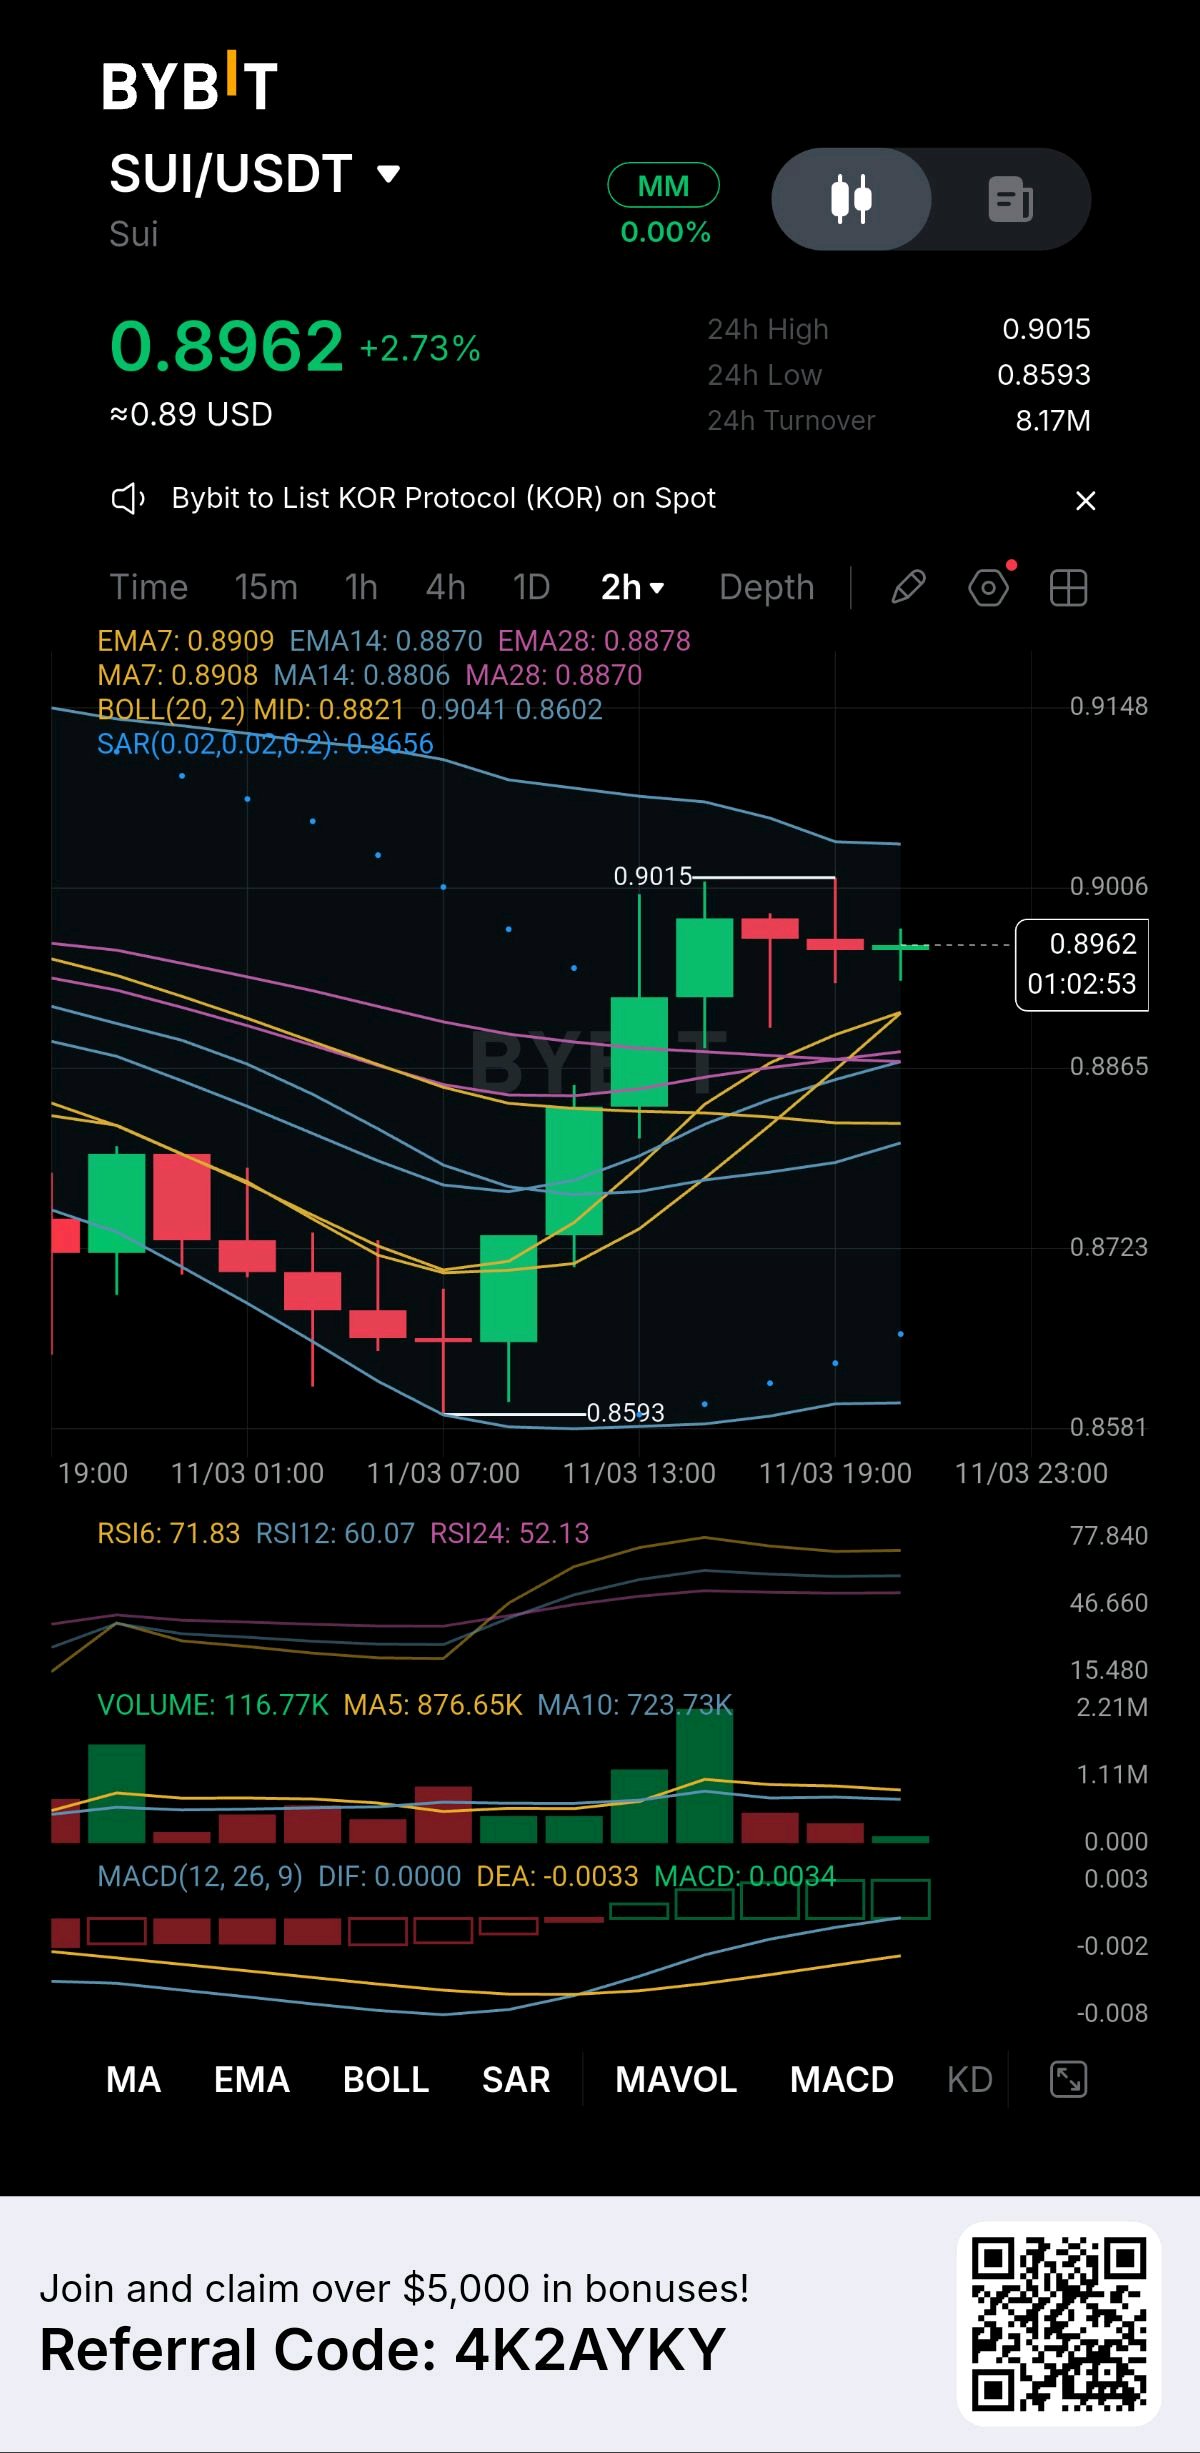
The momentum on SUI just shifted, and I am stepping in to ride the wave. When the chart gives a clear structural signal, I don't hesitate; I execute with precision and protect my capital. Looking at this 2-hour chart, the bulls have made a powerful comeback, launching from the 0.8593 base to a local high of 0.9015. The price is now consolidating beautifully above the entire EMA cluster, which is acting as a solid dynamic floor. Here is my technical read: The Ignition: The MACD just executed a fresh bullish crossover, pushing above the zero line with a green histogram. This is the engine for the next move. The Strength: The RSI is holding strong at 71.83, showing aggressive buying pressure. The Foundation: The EMA7 (0.8909) and EMA14 (0.8870) are tightly stacked, catching the current consolidation perfectly. My Execution Strategy and Risk Management: I am trading this continuation, but my downside is fiercely protected. My Entry: I am accumulating right here at the current level (0.8962) as it holds the EMA support. My Ironclad Stop Loss: I am placing my strict stop loss just below the EMA cluster and the SAR indicator at 0.8850. If the price loses this structural floor, the breakout is invalidated, and I exit instantly. No hoping, just discipline. My Target: My primary target is a clean sweep of the recent high at 0.9015, opening the door for new price discovery. I am buying the momentum, protecting my capital, and letting the market do the heavy lifting. Are you riding this SUI continuation with me? $SUIUSDT $HYPEUSDT #ByXIMPACT

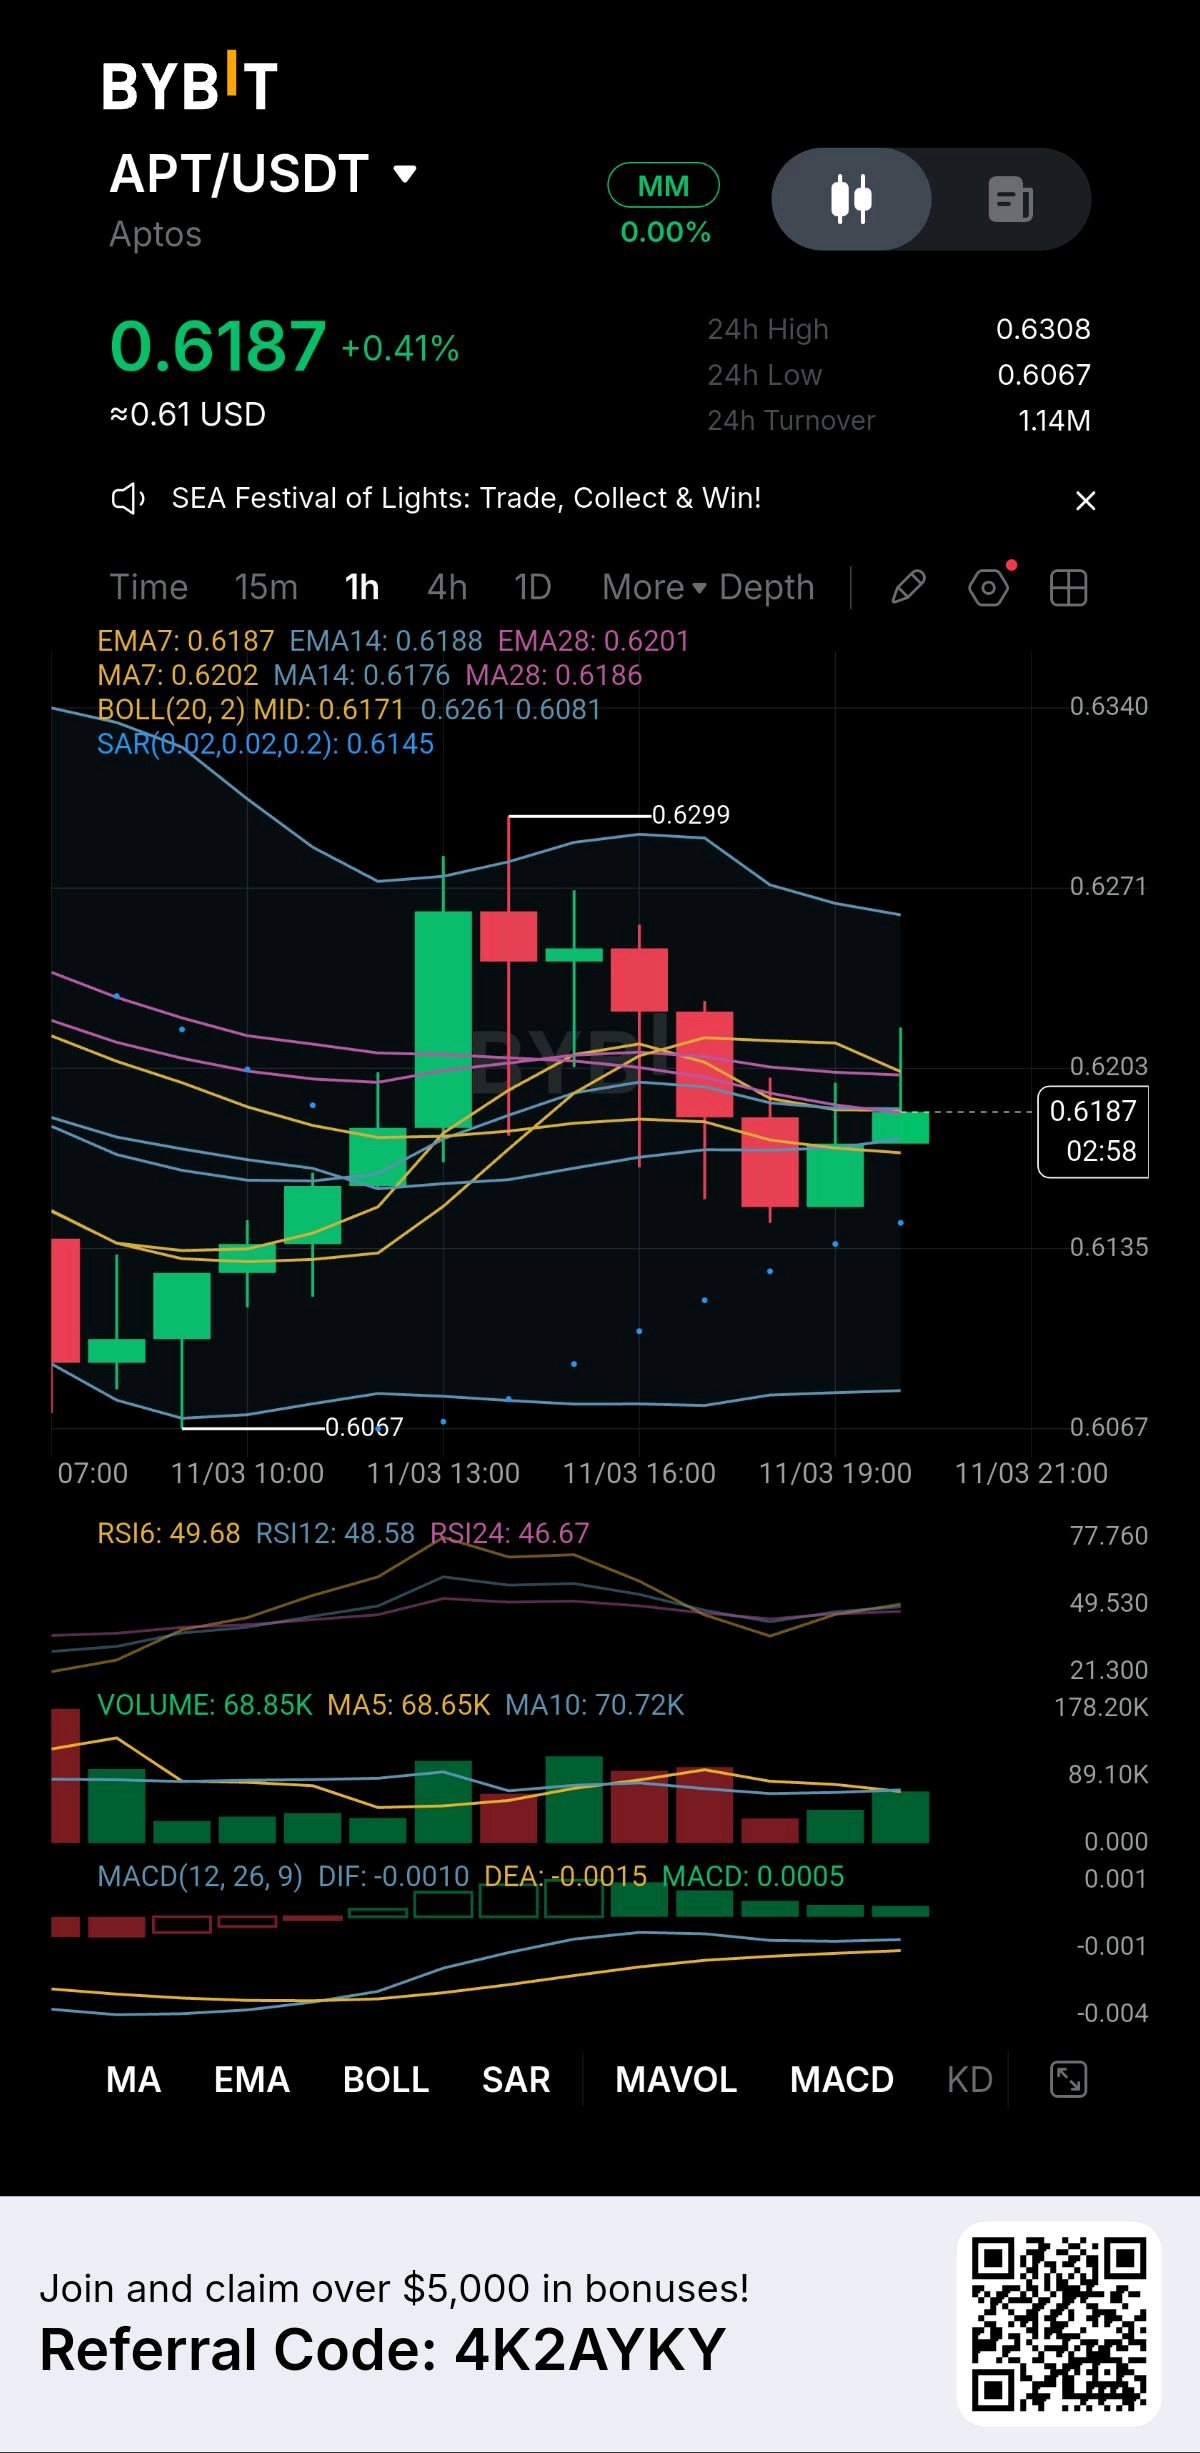
APT is compressing into a tight corner right now, and I am positioning myself exactly at the epicenter. I don't need chaotic volatility to find a trade; I just need a clear structural edge, and this chart is giving me a perfect setup. Looking at this 1-hour chart, the price is resting directly on the EMA cluster (7, 14, and 28). This tight convergence acts as a powerful dynamic floor. We saw a recent dip to 0.6067, but the bulls defended it instantly, pushing the price back to 0.6187. Here is my technical read: The Neutrality: The RSI is sitting perfectly flat at 49.68. There is zero selling pressure dragging us down, giving the buyers full control. The Momentum: The MACD is flattening right at the zero line. The market is taking a breath and coiling up for the next move. The Cushion: The SAR dots are resting safely below the price at 0.6145, confirming the broader trend is still intact. My Execution Strategy and Risk Management: I am accumulating right here at this support base before the next expansion. My Entry: Buying at the current level (0.6187) as the price holds the EMA support. My Ironclad Stop Loss: I am placing my strict stop loss just below the recent swing low at 0.6060. If the price breaks that floor, the setup is completely invalidated, and I exit instantly. No hoping, just pure discipline. My Target: My primary target is a clean breakout above the recent high at 0.6299. I am buying the foundation, protecting my downside, and letting the market do the heavy lifting. Are you accumulating APT at this support level? $APTUSDT $BTCUSDT #ByXIMPACT

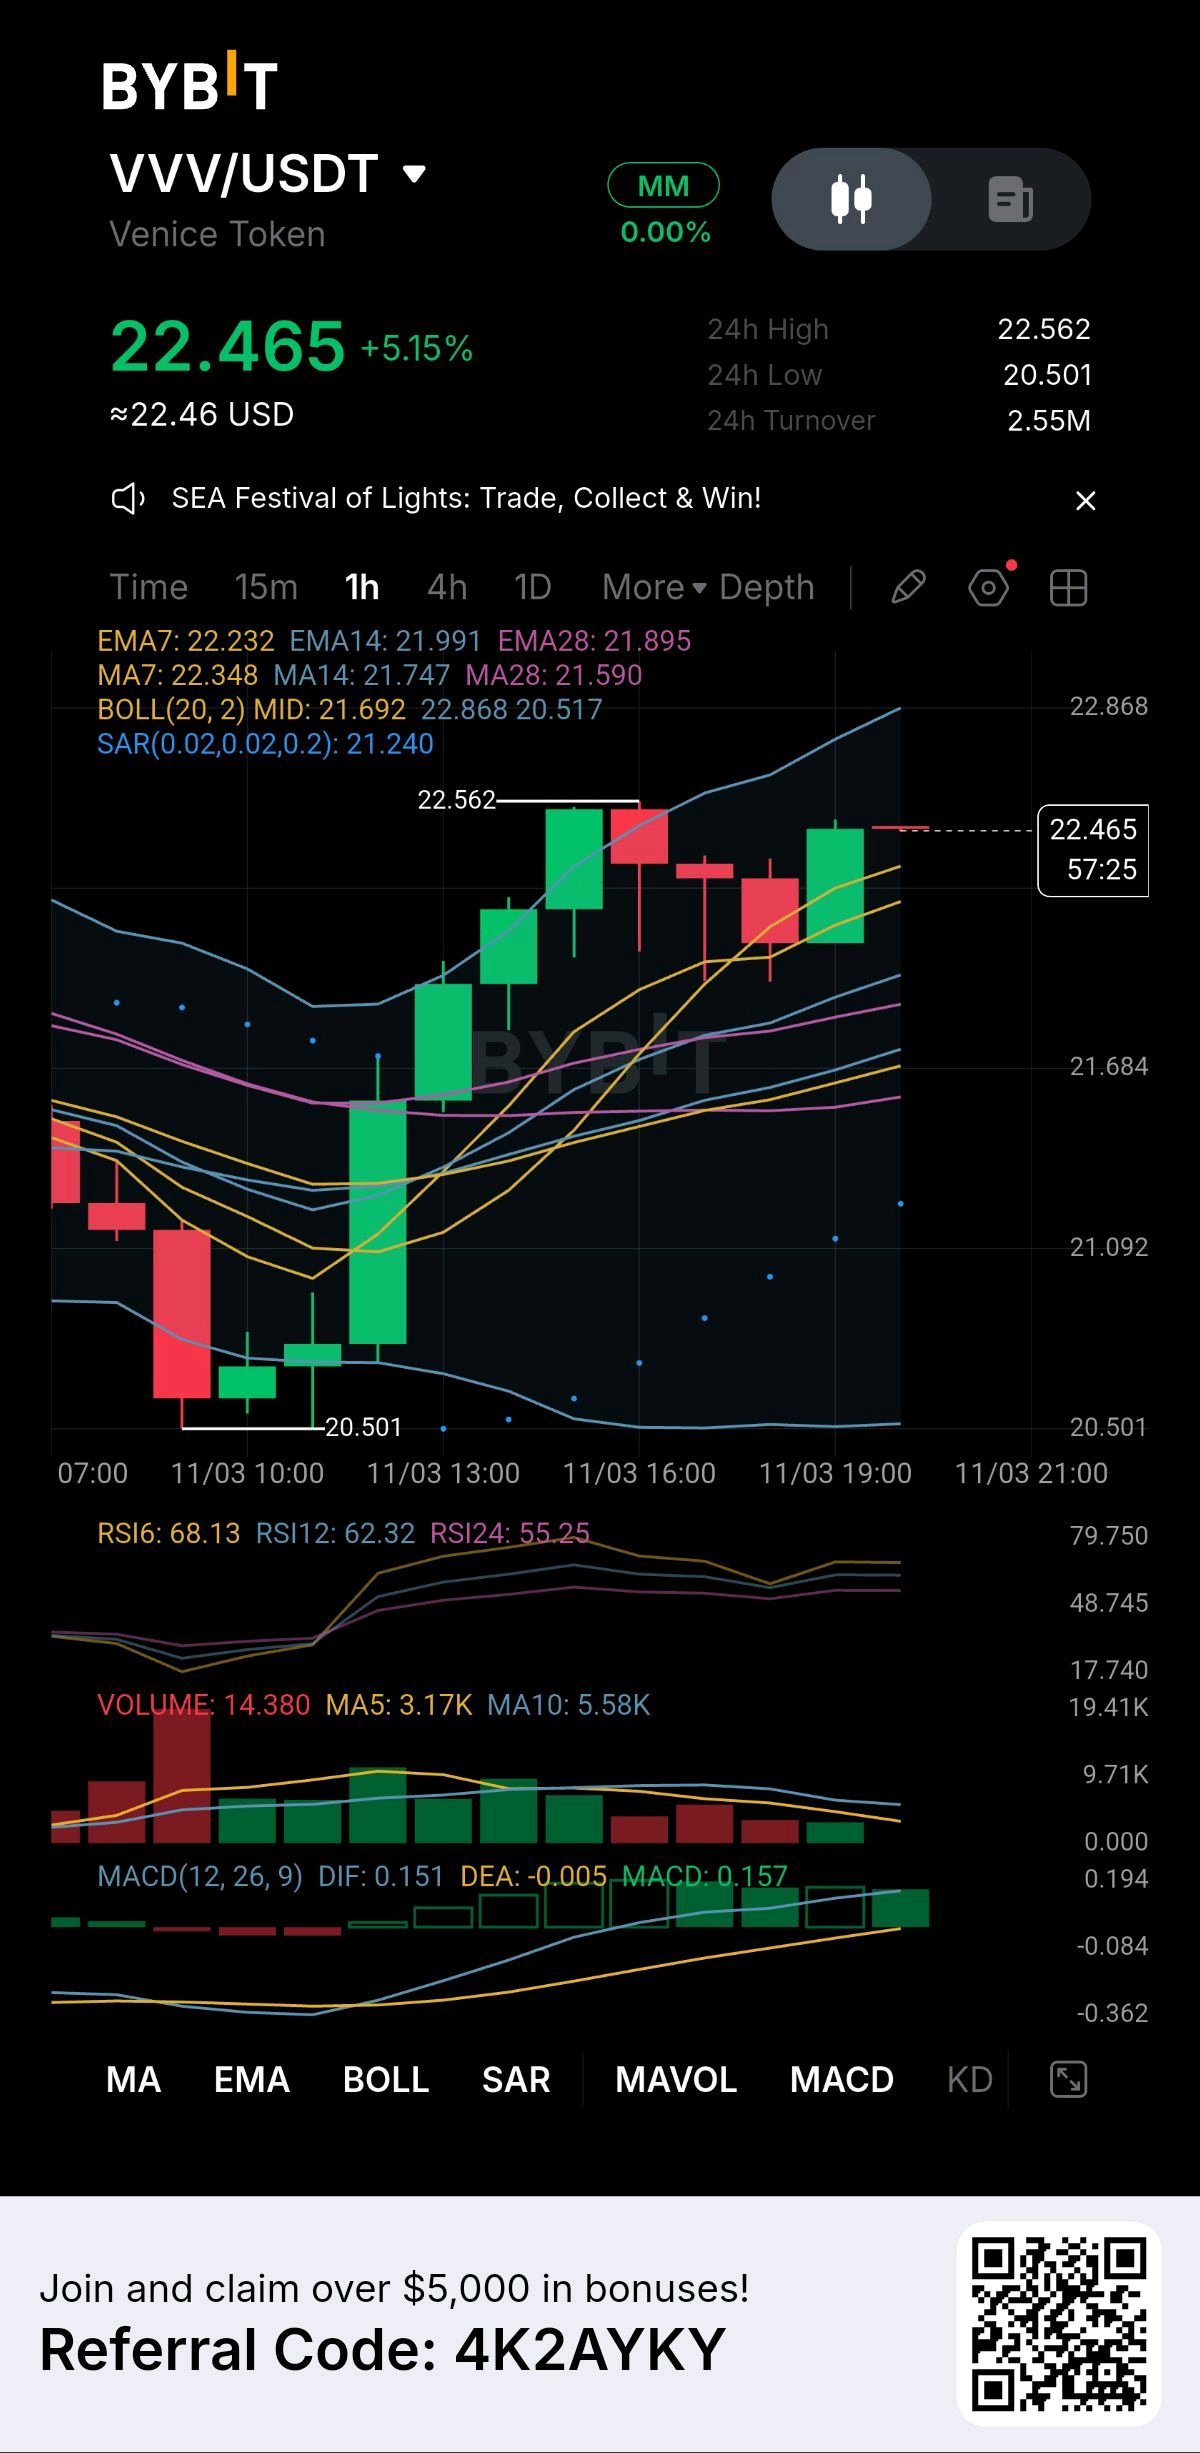
VVV just showed me why I like double bottoms. It tagged $20.501 at 09:00 and tested the same level again at 11:00. Then at 12:00 one big green candle took it from $20.78 to $21.57, a 3.8% breakout in a single hour. It stepped up from there to $22.562 at 16:00, pulled back at 17:00 and 18:00 to around $22.00 on lighter volume, and now at 20:00 it's back at $22.465 with the SAR under price and MACD positive. It's up 5.15% on the day, but what interests me more is the pullback: buyers showed up fast. The zone worth watching for a dip entry is $21.60 to $21.90, where the top of the breakout candle and the 14 and 28-period averages sit, and the idea is wrong if it closes under $21.45. The first target is the $22.562 high, then $23.50, which is about 2.4 to 1 and 5 to 1. VVV can move 10% in a day, so I'd keep size small. Do you prefer buying the retest of a double bottom, or the breakout candle itself? Just my read, not advice. $VVVUSDT $ETHUSDT #ByXIMPACT

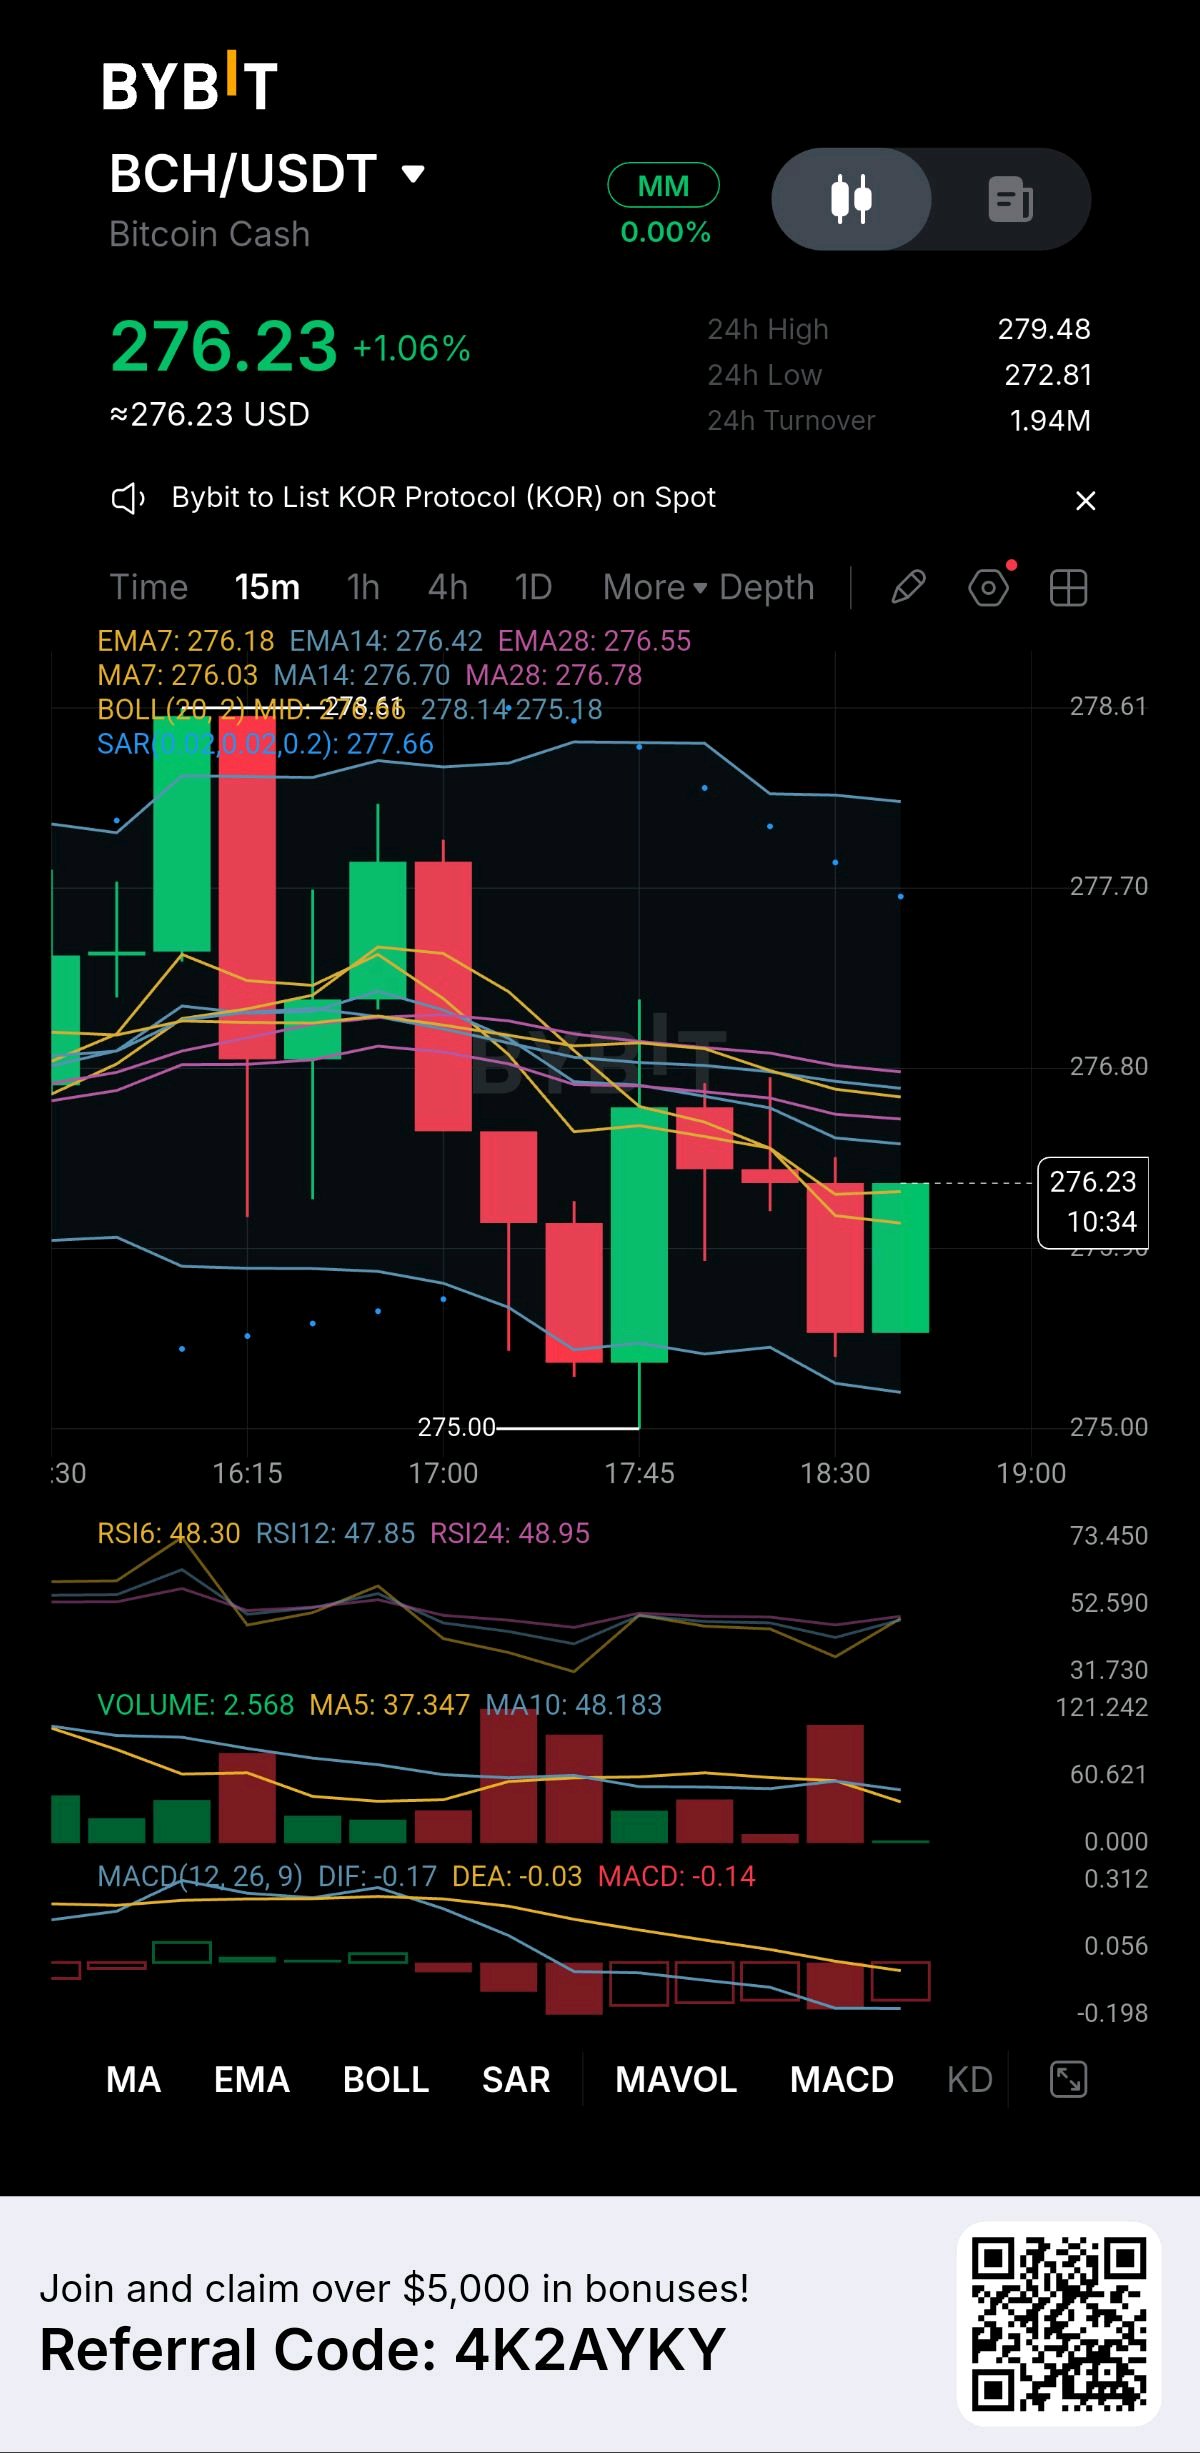
BCH is testing the ultimate floor right now, and I am stepping in to catch the reversal. I do not panic when the market bleeds; I hunt for the structural support where the smart money accumulates. Looking at this 15-minute chart, the price has been pushed down to a critical support level at 275.00. The short-term trend is heavy, but the data is telling me the selling pressure is completely exhausted. Here is my technical read: The Exhaustion: The RSI is sitting perfectly neutral at 48.30. There is no more downward momentum. The Fading Bears: The MACD histogram is still red but the bars are shrinking aggressively. The sellers are losing their grip. The Structure: We are trading below the EMA cluster, but the 275.00 floor is holding firm. My Execution Strategy and Risk Management: I am treating this support level as my prime buying opportunity. My Entry: I am accumulating right here at 276.23 as the price stabilizes. My Ironclad Stop Loss: I have placed my strict stop loss just below the absolute swing low at 274.80. If the price breaks that floor, the bullish setup is dead, and I exit instantly. No hoping, just discipline. My Target: My primary target is a clean reclaim of the EMA cluster at 276.55, opening the door to a short squeeze. I am buying the fear, protecting my capital, and letting the market do the heavy lifting. Are you catching this BCH reversal with me? $BCHUSDT $BTCUSDT #ByXIMPACT

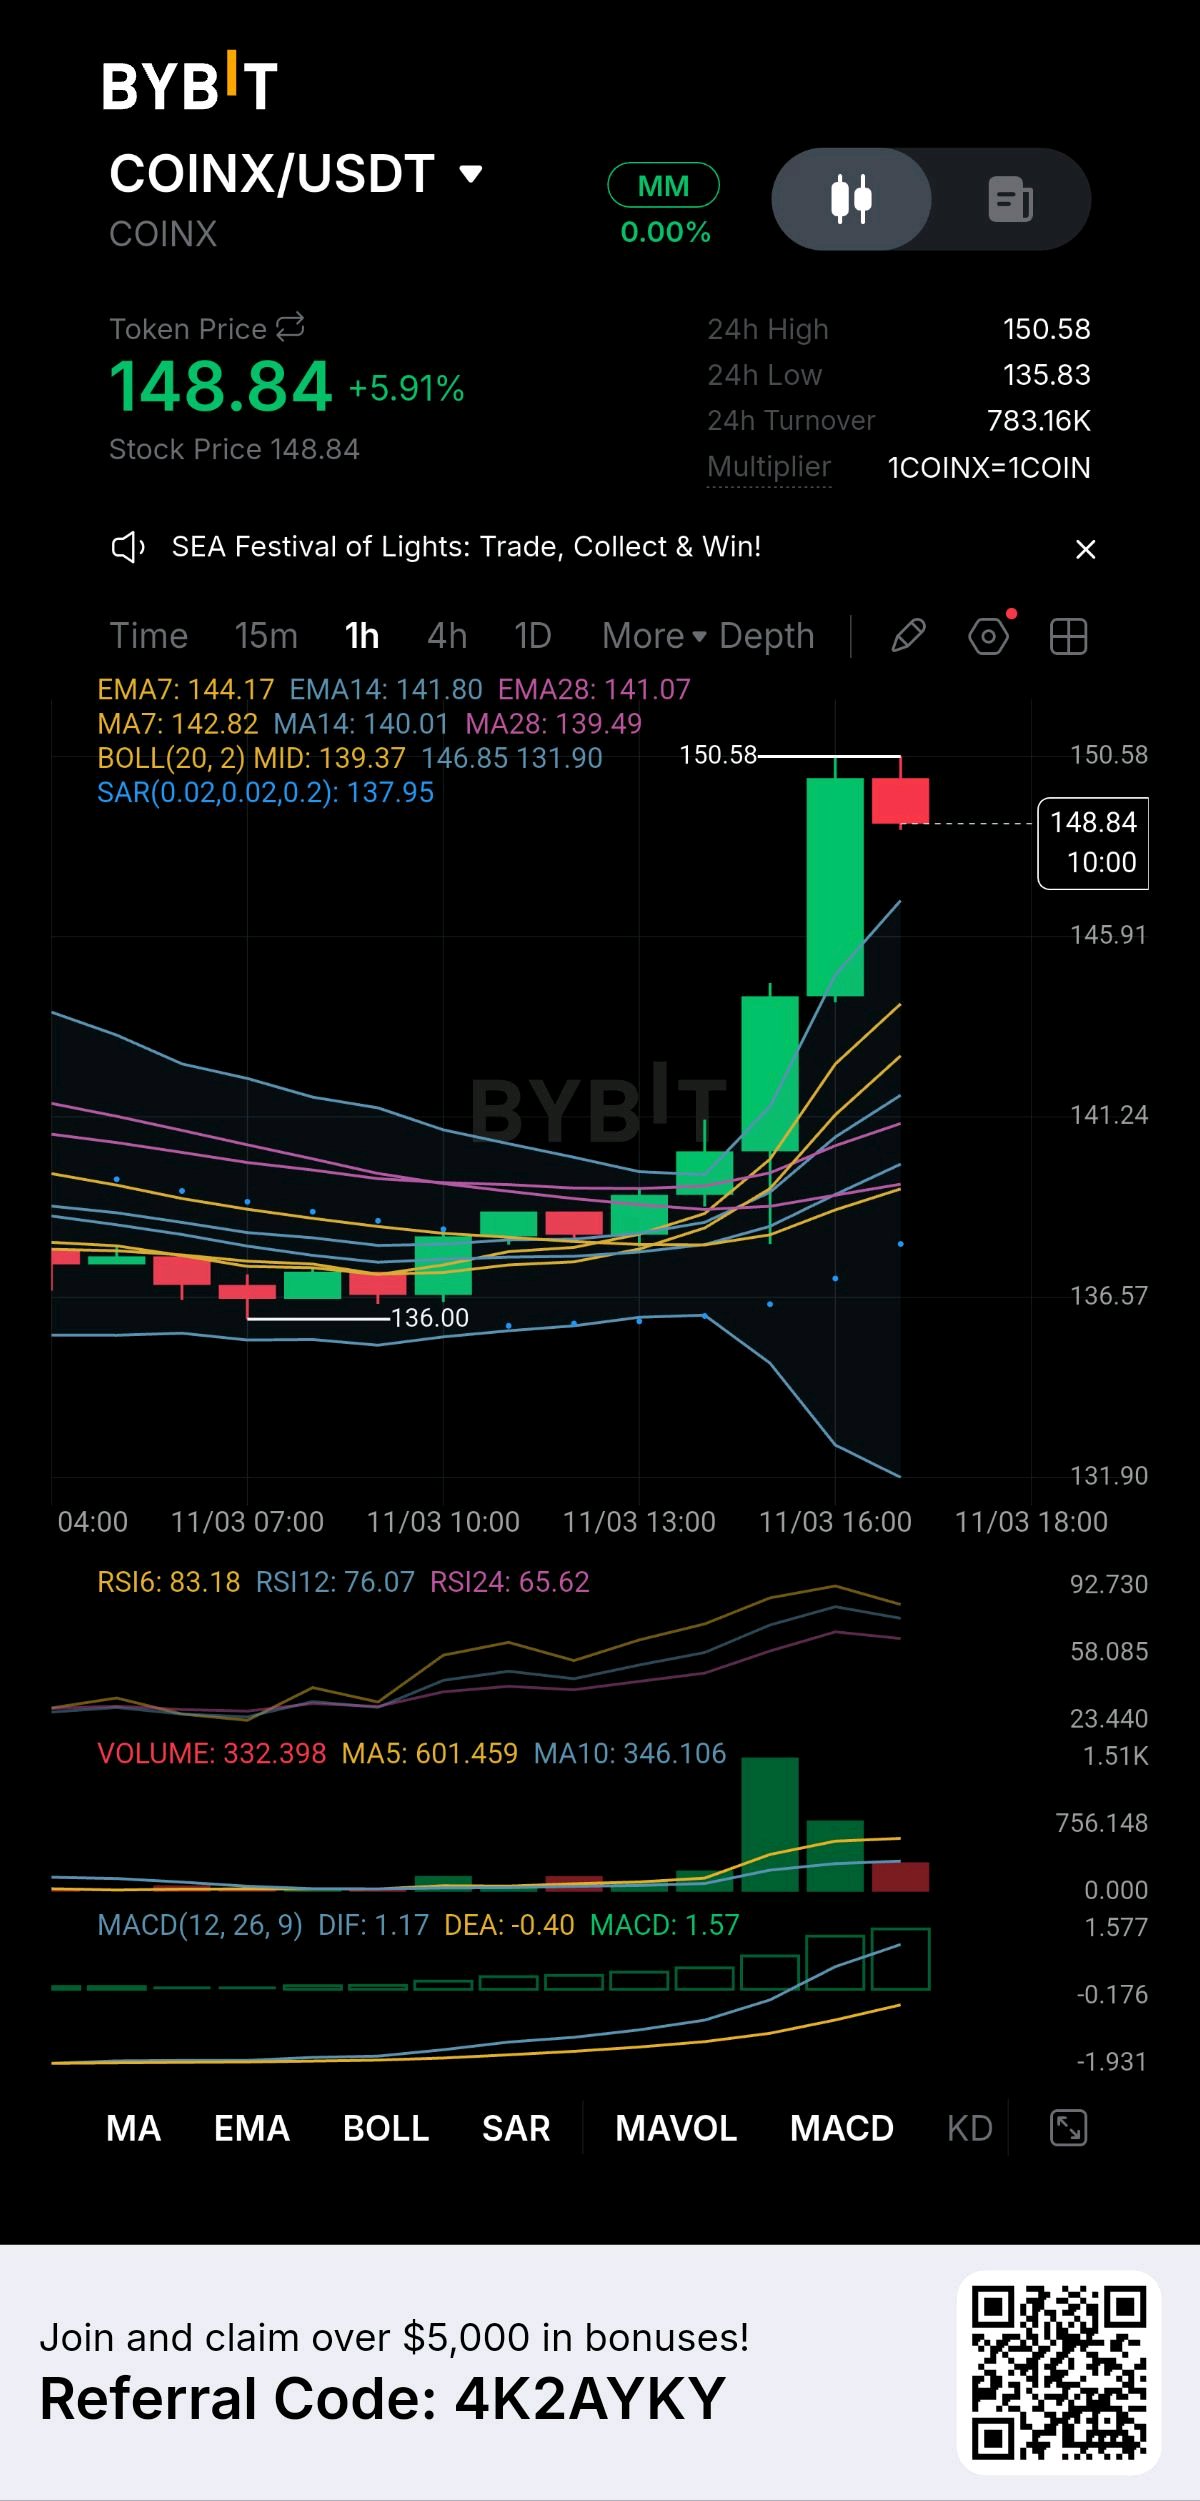
Momentum is a beautiful thing when you are positioned on the right side of it. COINX is delivering an absolute masterclass in parabolic strength right now, and my position is sitting deep in profit. This is the moment where discipline and active trade management matter most. Look at this explosive 1-hour chart. The bulls have completely taken over, launching a relentless rally from the 136.00 base to shatter resistance at 150.58. The EMA cluster is exhibiting textbook bullish expansion, and the MACD is surging with massive green momentum. Here is my technical reality check: The Strength: The trend is incredibly powerful, backed by heavy volume and a flawless moving average structure. The Warning: The RSI is screaming at 83.18, and the price is riding far outside the upper Bollinger Band. The move is heavily extended and a violent snapback is always a risk. My Execution Strategy and Risk Management: Because I am already riding this wave from lower levels, my only focus now is locking in gains and protecting my capital. My Active Trade Management: I am aggressively trailing my stop loss just below the EMA7 at 144.17. As long as the price holds above this dynamic support, I am giving the trade room to breathe and hunt for new price discovery above 150.58. My Hard Exit Plan: If the price loses this structural floor and closes below the EMA7, the momentum is fading, and I will secure my massive profits instantly. No hoping, no holding. I am managing this winner with surgical precision, protecting my downside, and letting the trend do the heavy lifting. Are you riding this COINX momentum with me? $COINXUSDT $ETHUSDT #ByXIMPACT

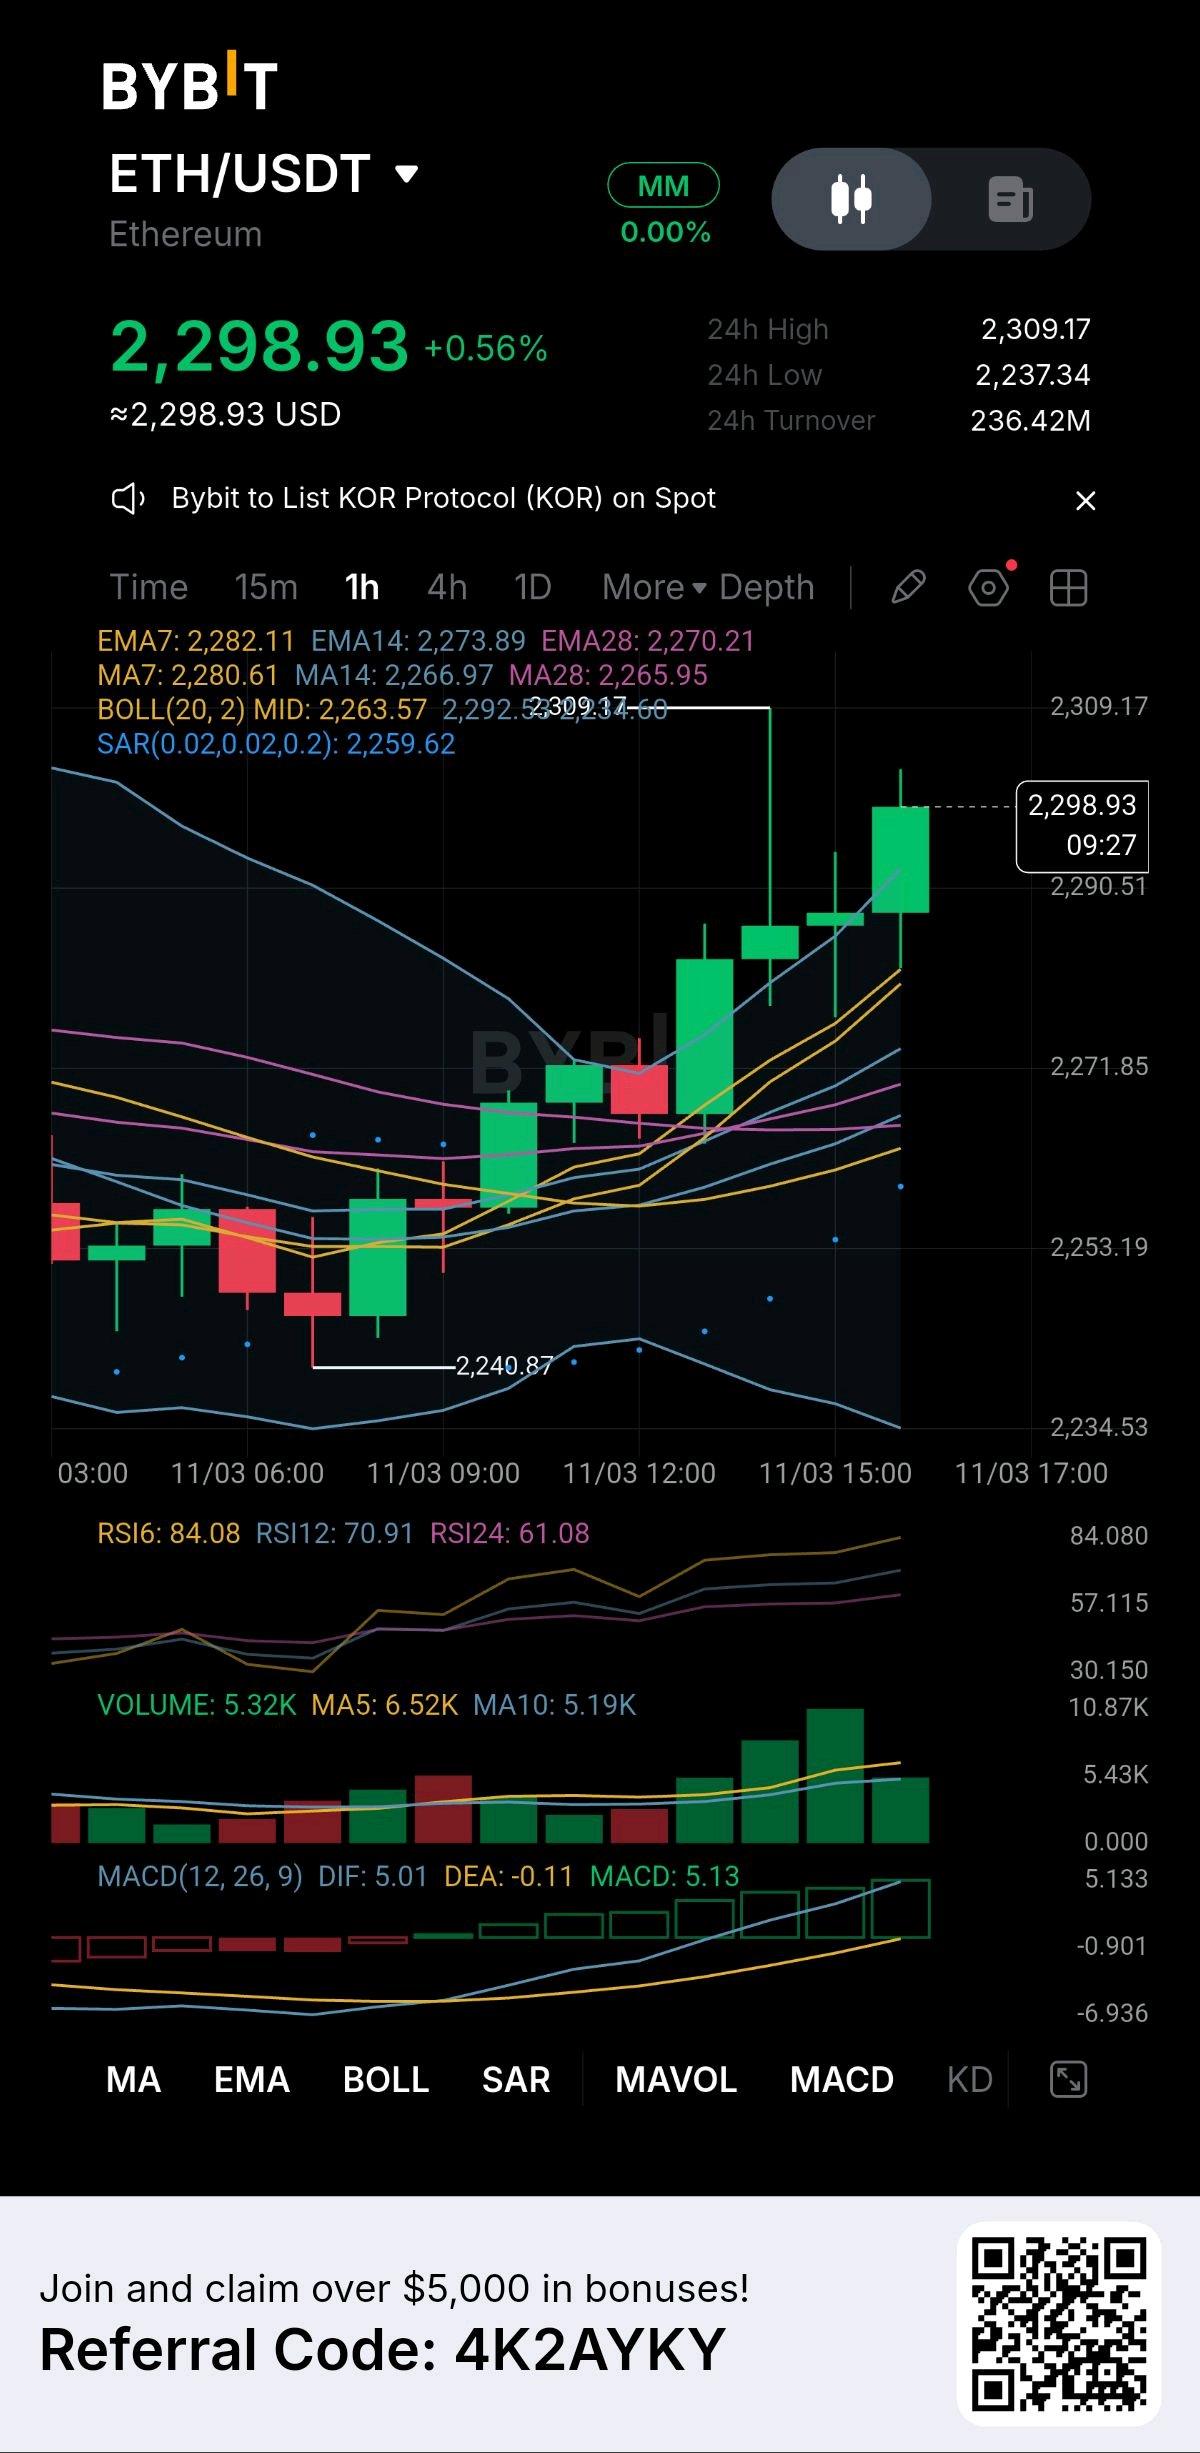
ETH is absolutely dominating the charts right now, and my position is sitting deep in the green. This is the reward for trusting the structure, and I am not just sitting back; I am actively managing my trade to maximize this breakout. Look at this explosive 1-hour chart. We launched from the 2,240 base and smashed straight through resistance to hit 2,309. The EMA cluster is fanned out perfectly, the MACD is expanding with massive green momentum, and the volume confirms this is real buying power. Yes, the RSI is screaming at 84.08. But in a breakout of this magnitude, that is pure, unadulterated strength. The buyers have zero intention of backing down. My Execution Strategy and Risk Management: Since I am already deep in this trade, my only job now is capital protection and letting the winner run. My Management Plan: I am aggressively trailing my stop loss up to just below the EMA7 at 2,282. As long as the price holds above this dynamic support, I am giving the trade room to breathe and target new price discovery above 2,309. My Exit Plan: If the price loses this structural floor, the short-term momentum is fading, and I will secure my profits instantly. No hoping, no holding. I am riding the wave, protecting my downside, and letting the market do the heavy lifting. Are you riding this ETH breakout with me? $ETHUSDT $ICNTUSDT #ByXIMPACT #WSOT2026 #MidtermsMarketWatch #USPayrollsAndRateDecisionsDriveMacroWeek #AnthropicIPOTestsTheAIBoom

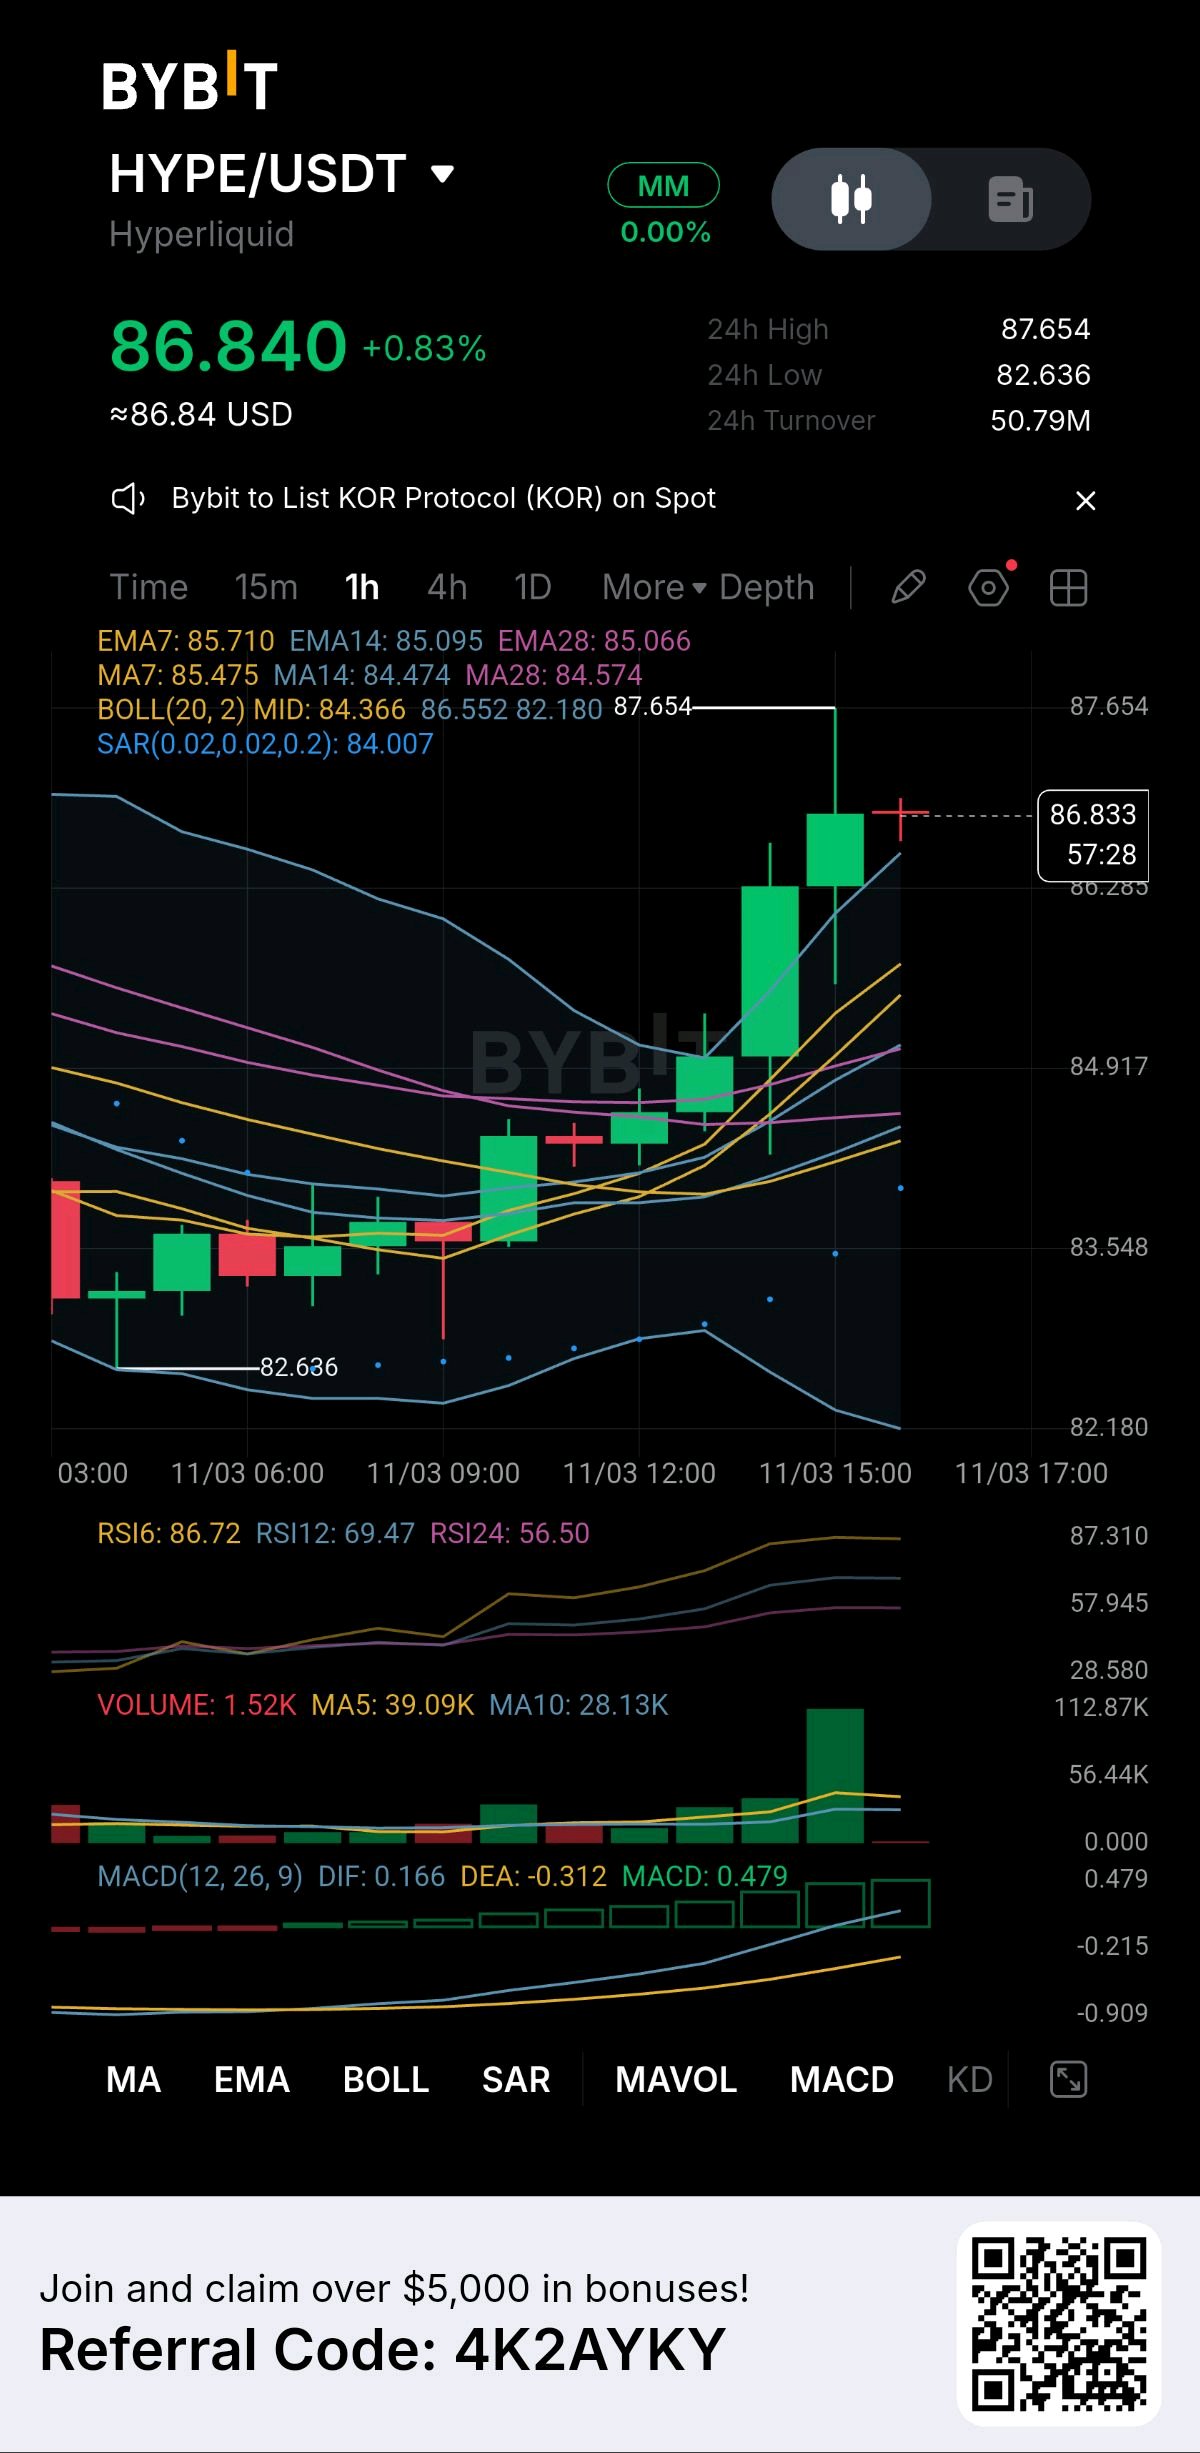
Why do traders always wait for a pullback that never comes? When a chart looks this strong, hesitation costs money. HYPE is breaking out right now, and I am stepping in at the exact ignition point of this new trend. Looking at this 1-hour chart, the bulls have completely taken over. We built a rock-solid floor at 82.636, and the price has now obliterated the entire EMA cluster and the middle Bollinger Band with massive volume. The MACD is expanding aggressively, and the RSI is running hot at 86.72. Yes, it is overbought, but that is the signature of a true breakout. It means the buyers have zero intention of backing down. My Execution Strategy and Risk Management: I am trading the momentum, but my capital is fiercely protected. My Entry: I am entering right here as the price holds above the EMA7 (85.710), confirming the breakout is real. My Ironclad Stop Loss: I am placing my strict stop loss just below the SAR indicator and the EMA structure at 84.000. If the price loses this floor, the launch is a fakeout, and I exit instantly. I do not hold and hope. My Target: My primary target is pure price discovery above the recent high of 87.654. I am catching the initial wave of this new trend, protecting my downside, and letting the market do the heavy lifting. Are you catching this HYPE launch with me? $HYPEUSDT $ETHUSDT #ByXIMPACT

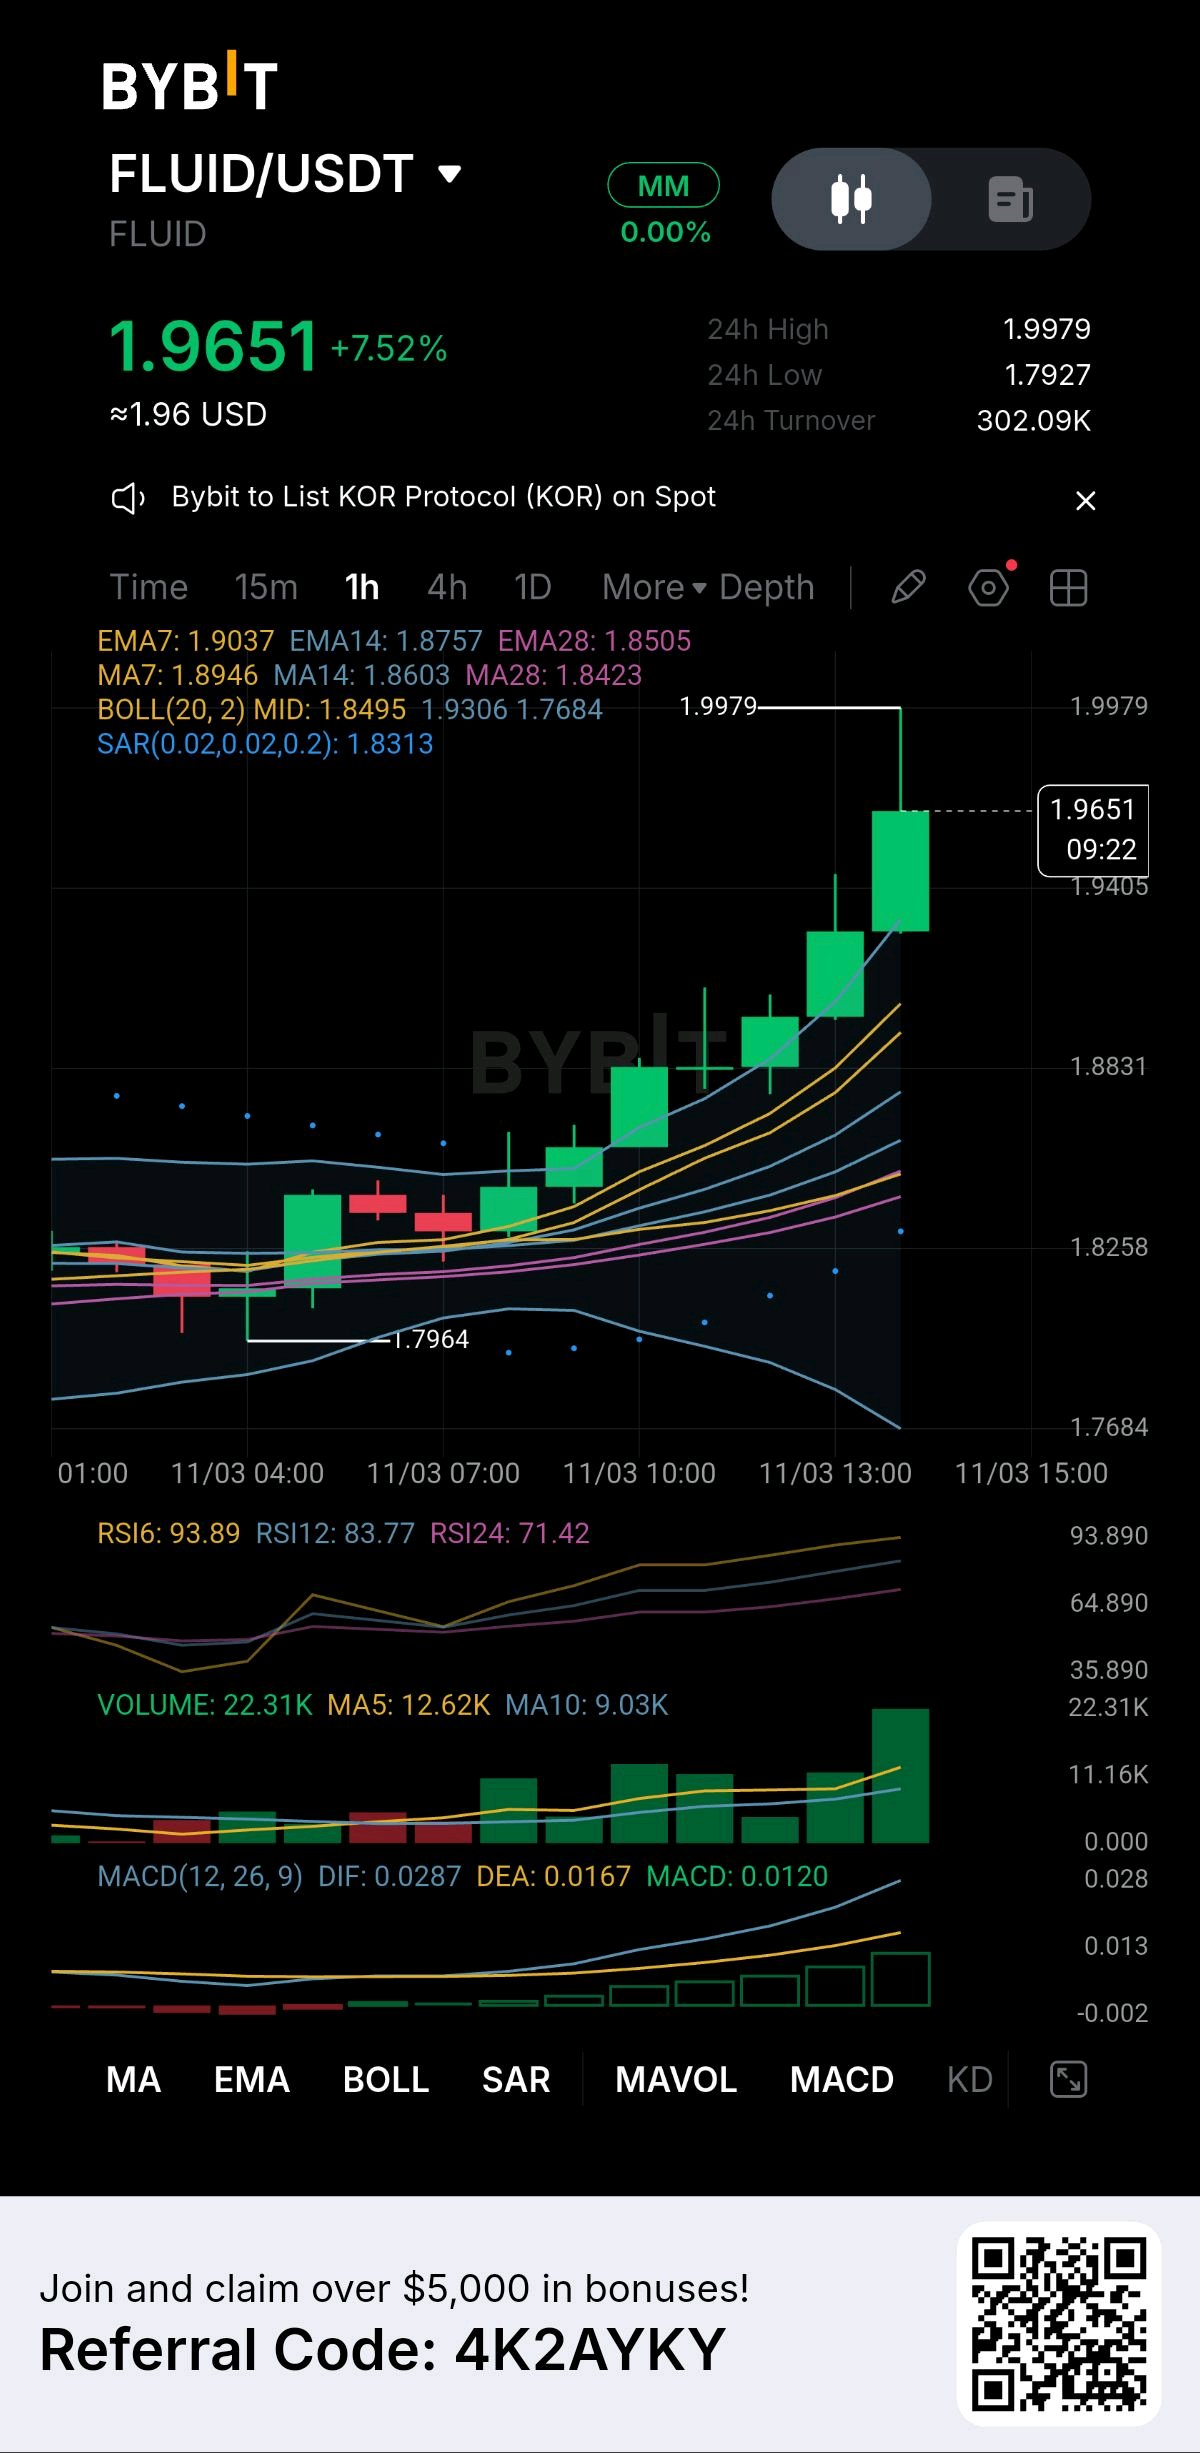
FLUID is moving like an absolute force of nature, and this is exactly where momentum traders thrive. I do not fear the vertical green candles; I respect them. When the market shows this level of aggression, you don't fight it, but you also don't trade it blindly. Looking at this 1-hour chart, we have a textbook parabolic launch. We ground our way up from 1.7964, and the volume just exploded. The EMA cluster is fanned out like a rocket launcher, and the MACD is wide open to the upside. The buyers are in total, absolute control. Here is my technical reality check: The Strength: The trend structure is flawless. Every indicator is screaming bullish. The Danger: The RSI is screaming at 93.89, and the price is pushing hard against the upper Bollinger Band. We are in extreme, unsustainable overbought territory. My Execution Strategy and Risk Management: I am not here to FOMO and buy the absolute top of this green wick. That is how accounts get liquidated. I am trading the continuation, but with surgical discipline. My Trigger: I am waiting for the market to catch its breath. I want to see a tight bull flag form or a micro-pullback to test the EMA7 (1.9037). If the buyers defend that dynamic support, I will execute my long position for the next push higher. My Ironclad Stop Loss: I am placing my strict stop loss just below the SAR indicator and the EMA14 at 1.8700. If the price loses this structural floor, the parabolic momentum is dead, and I exit instantly. I never hold and hope. My Target: Once we clear the 1.9979 high, it is pure price discovery. I am trading the strength, protecting my capital, and letting the market do the heavy lifting. Are you riding this FLUID momentum, or waiting for the retest? $FLUIDUSDT $ETHUSDT #ByXIMPACT

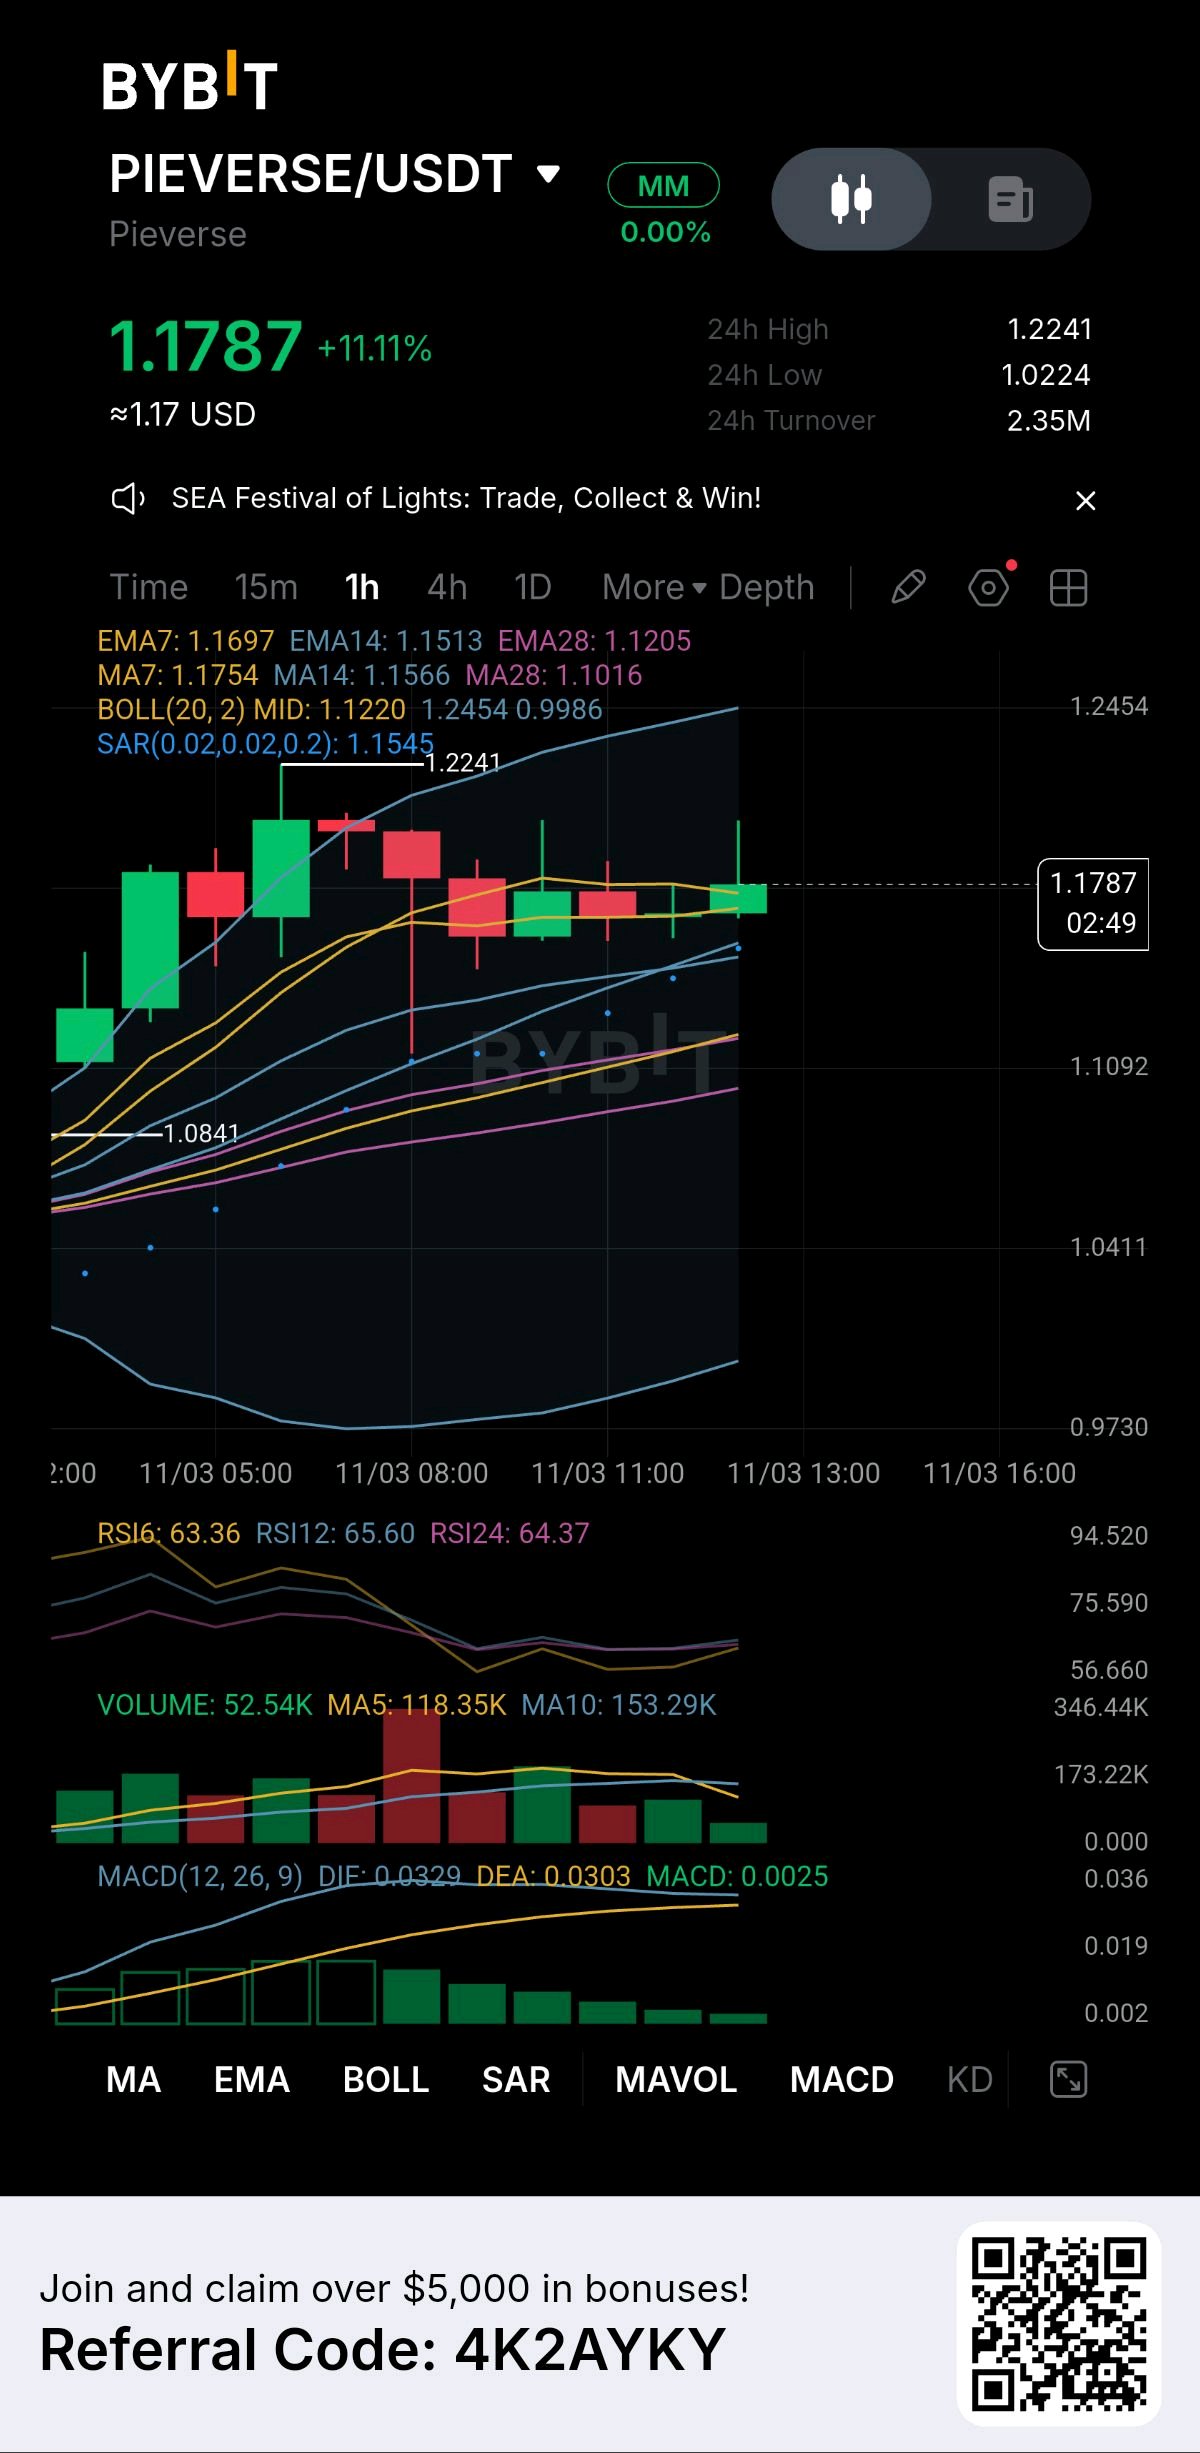
PIEVERSE is proving that true strength doesn't wait around, and I am positioning myself to ride the next wave of momentum. I don't just hunt for dips; I trade confirmed strength. When the market shows this level of dominance, I press the advantage. Looking at this 1-hour chart, the bulls have complete control. We had a massive 11% surge to 1.2241, and instead of a heavy dump, the price is holding incredibly strong at 1.1787, consolidating right above the EMA cluster. This isn't weakness; this is a high-tight flag ready to launch. Here is my technical read on this momentum play: The Fuel: The MACD is holding firmly in positive territory, confirming the underlying buying pressure is still intact. The Strength: The RSI is sitting perfectly at 63.36. It has cooled off from the peak but remains firmly in bullish territory, leaving massive room for another leg up. The Floor: The EMA7 (1.1697) and EMA14 (1.1513) are acting as a powerful dynamic springboard. My Execution Strategy and Risk Management: I am trading the breakout continuation. I am waiting for the bulls to trigger the next move. My Trigger: I am watching for a strong 1-hour candle to break and close above the current consolidation zone, targeting the recent high at 1.2241. My Ironclad Stop Loss: I am placing my strict stop loss just below the SAR indicator and the EMA cluster at 1.1450. If the price loses this structural floor, the momentum is dead, and I exit instantly to protect my capital. No hoping, just pure discipline. My Target: Once we clear 1.2241, it is pure price discovery. I am trading the strength, protecting my downside, and letting the trend do the heavy lifting. Are you ready for this PIEVERSE breakout continuation? $PIEVERSEUSDT $XRPUSDT #ByXIMPACT #IMPACTbyTrade

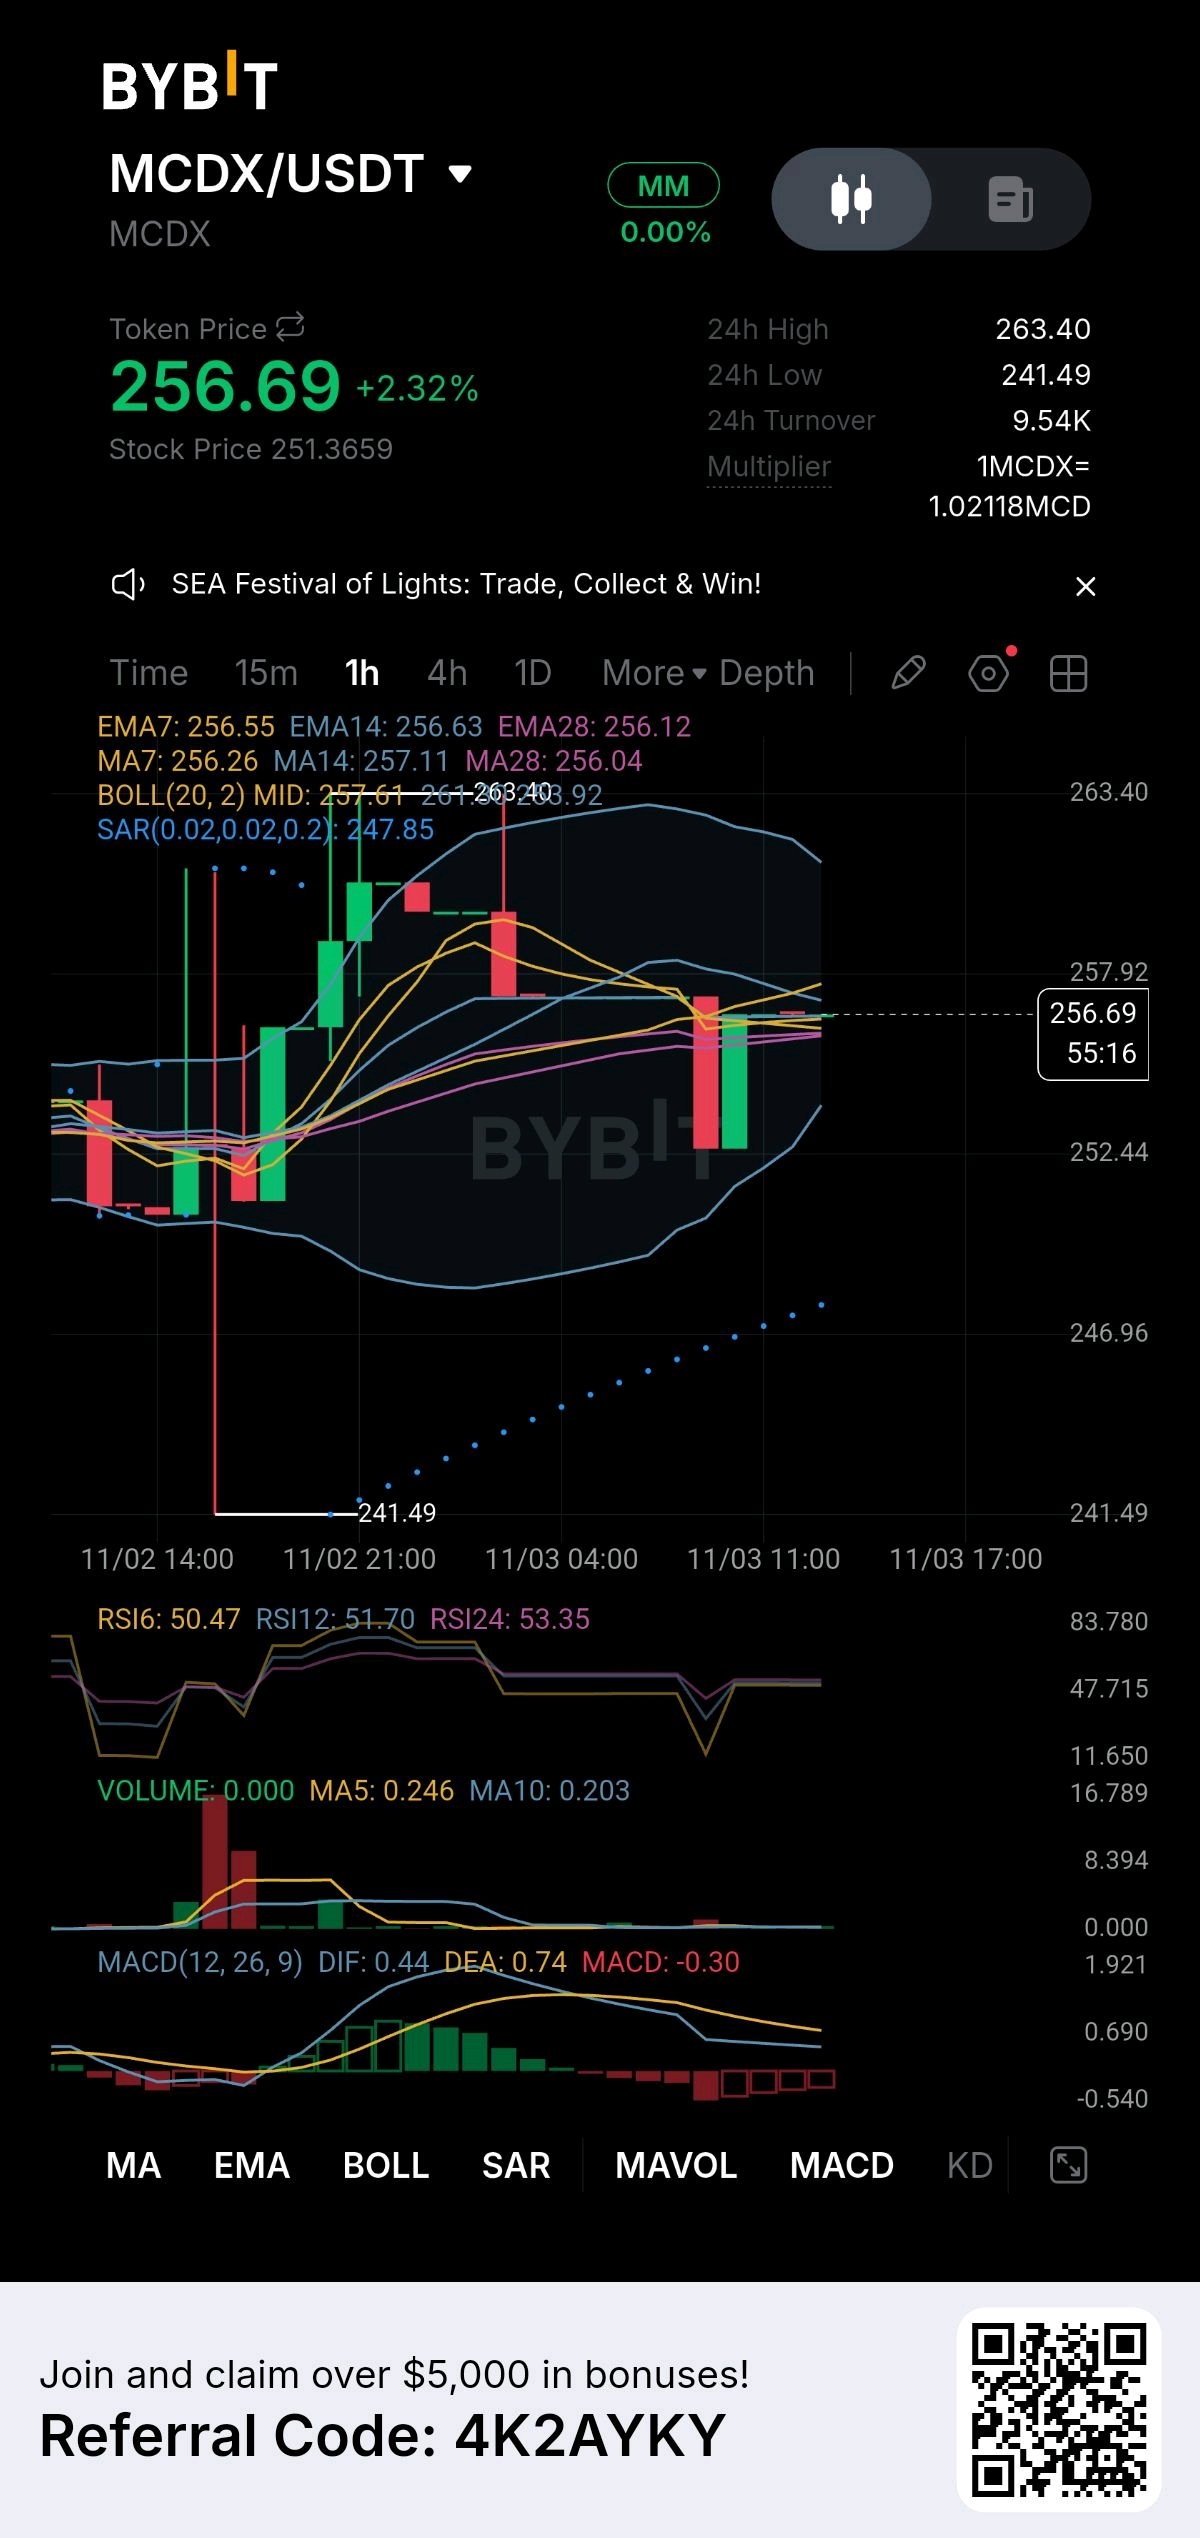
MCDX is completely flatlining right now, and this is the type of extreme silence that makes me lean in. The market is taking a deep breath, and a violent expansion is building right beneath the surface. Looking at this 1-hour chart, we just witnessed a massive liquidity sweep down to 241.49, shaking out the weak hands and grabbing stops. But the reaction was instant. The bulls bought it all back, and the price is now trapped in an incredibly tight compression zone around 256.69. Here is my technical read on this equilibrium: The Coil: The EMA7, EMA14, and EMA28 are glued together, and the Bollinger Bands are squeezing tight. When price action compresses this much, an explosive move is imminent. The Reset: The RSI is sitting dead neutral at 50.47. The MACD is flat. There is zero momentum pushing the price down, meaning the buyers are quietly holding the floor. My Execution Strategy and Risk Management: I do not trade in the middle of a chop. I set my traps and wait for the market to show its hand. My Trigger: I am watching for a clean 1-hour candle close above the local resistance at 257.92. Once the bulls break that ceiling, the spring snaps, and I will execute my long position to ride the volatility expansion. My Ironclad Stop Loss: I am placing my strict stop loss just below the SAR indicator at 247.80. If the price loses this structural floor, the bullish setup is completely invalidated, and I exit instantly to protect my capital. No hoping, just discipline. My Target: My primary target is a clean sweep of the recent high at 263.40. I am buying the calm before the storm, protecting my downside, and letting the market do the heavy lifting. Are you watching this MCDX squeeze with me? $MCDXUSDT $MCRTUSDT #ByXIMPACT #IMPACTbyTrade

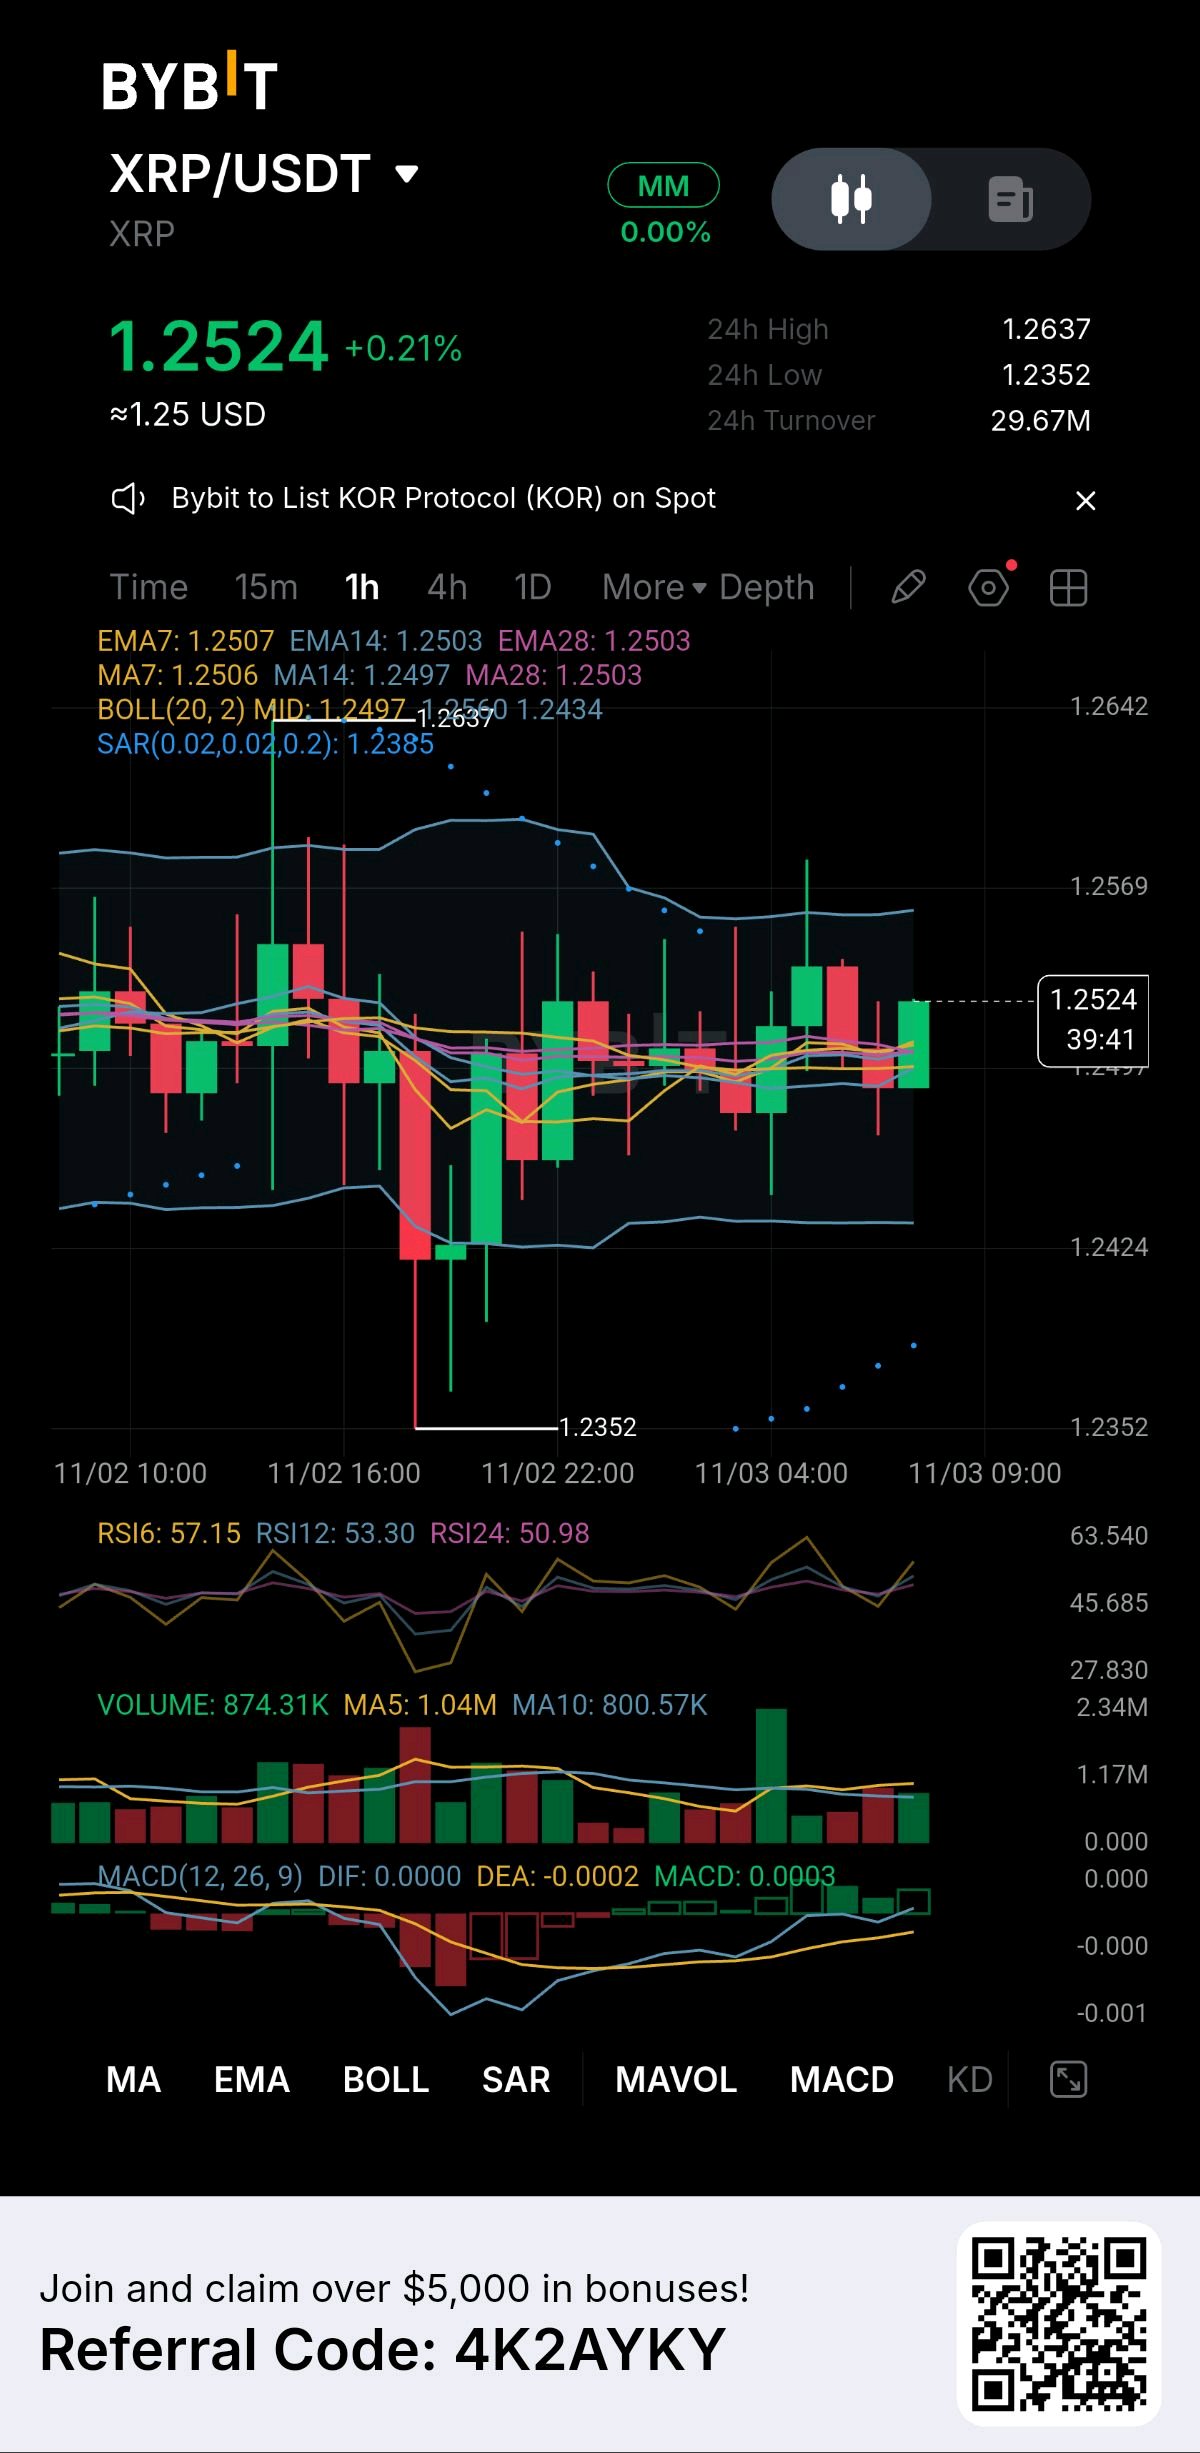
XRP flushed to $1.2352 on Nov 2, and the way buyers reacted is why I think that low matters. It tagged $1.2637 at 14:00, slid, and at 18:00 one red candle dumped it down to $1.2352, the low of the 24h. The next two candles both left long lower wicks and closed higher, and since then XRP has been building a tight range between about $1.2440 and $1.2580, with every short-term average stacked around $1.2503 and the SAR sitting under price. At 08:00 it's at $1.2524, and a stacked base right after a flush looks like a bottoming zone to me. The zone worth watching for a dip entry is $1.2420 to $1.2460, just above the Bollinger floor and the range lows, and the idea is wrong if it closes under $1.2340, below the flush low. The first target is the $1.2637 high, then $1.2730, where XRP traded on Oct 26, which is about 2 to 1 and 3 to 1. The range is tight, so I'd keep size modest. How many tests of a low do you need before you trust it? Just my read, not advice. $XRPUSDT $ETHUSDT #ByXIMPACT #IMPACTbyTrade

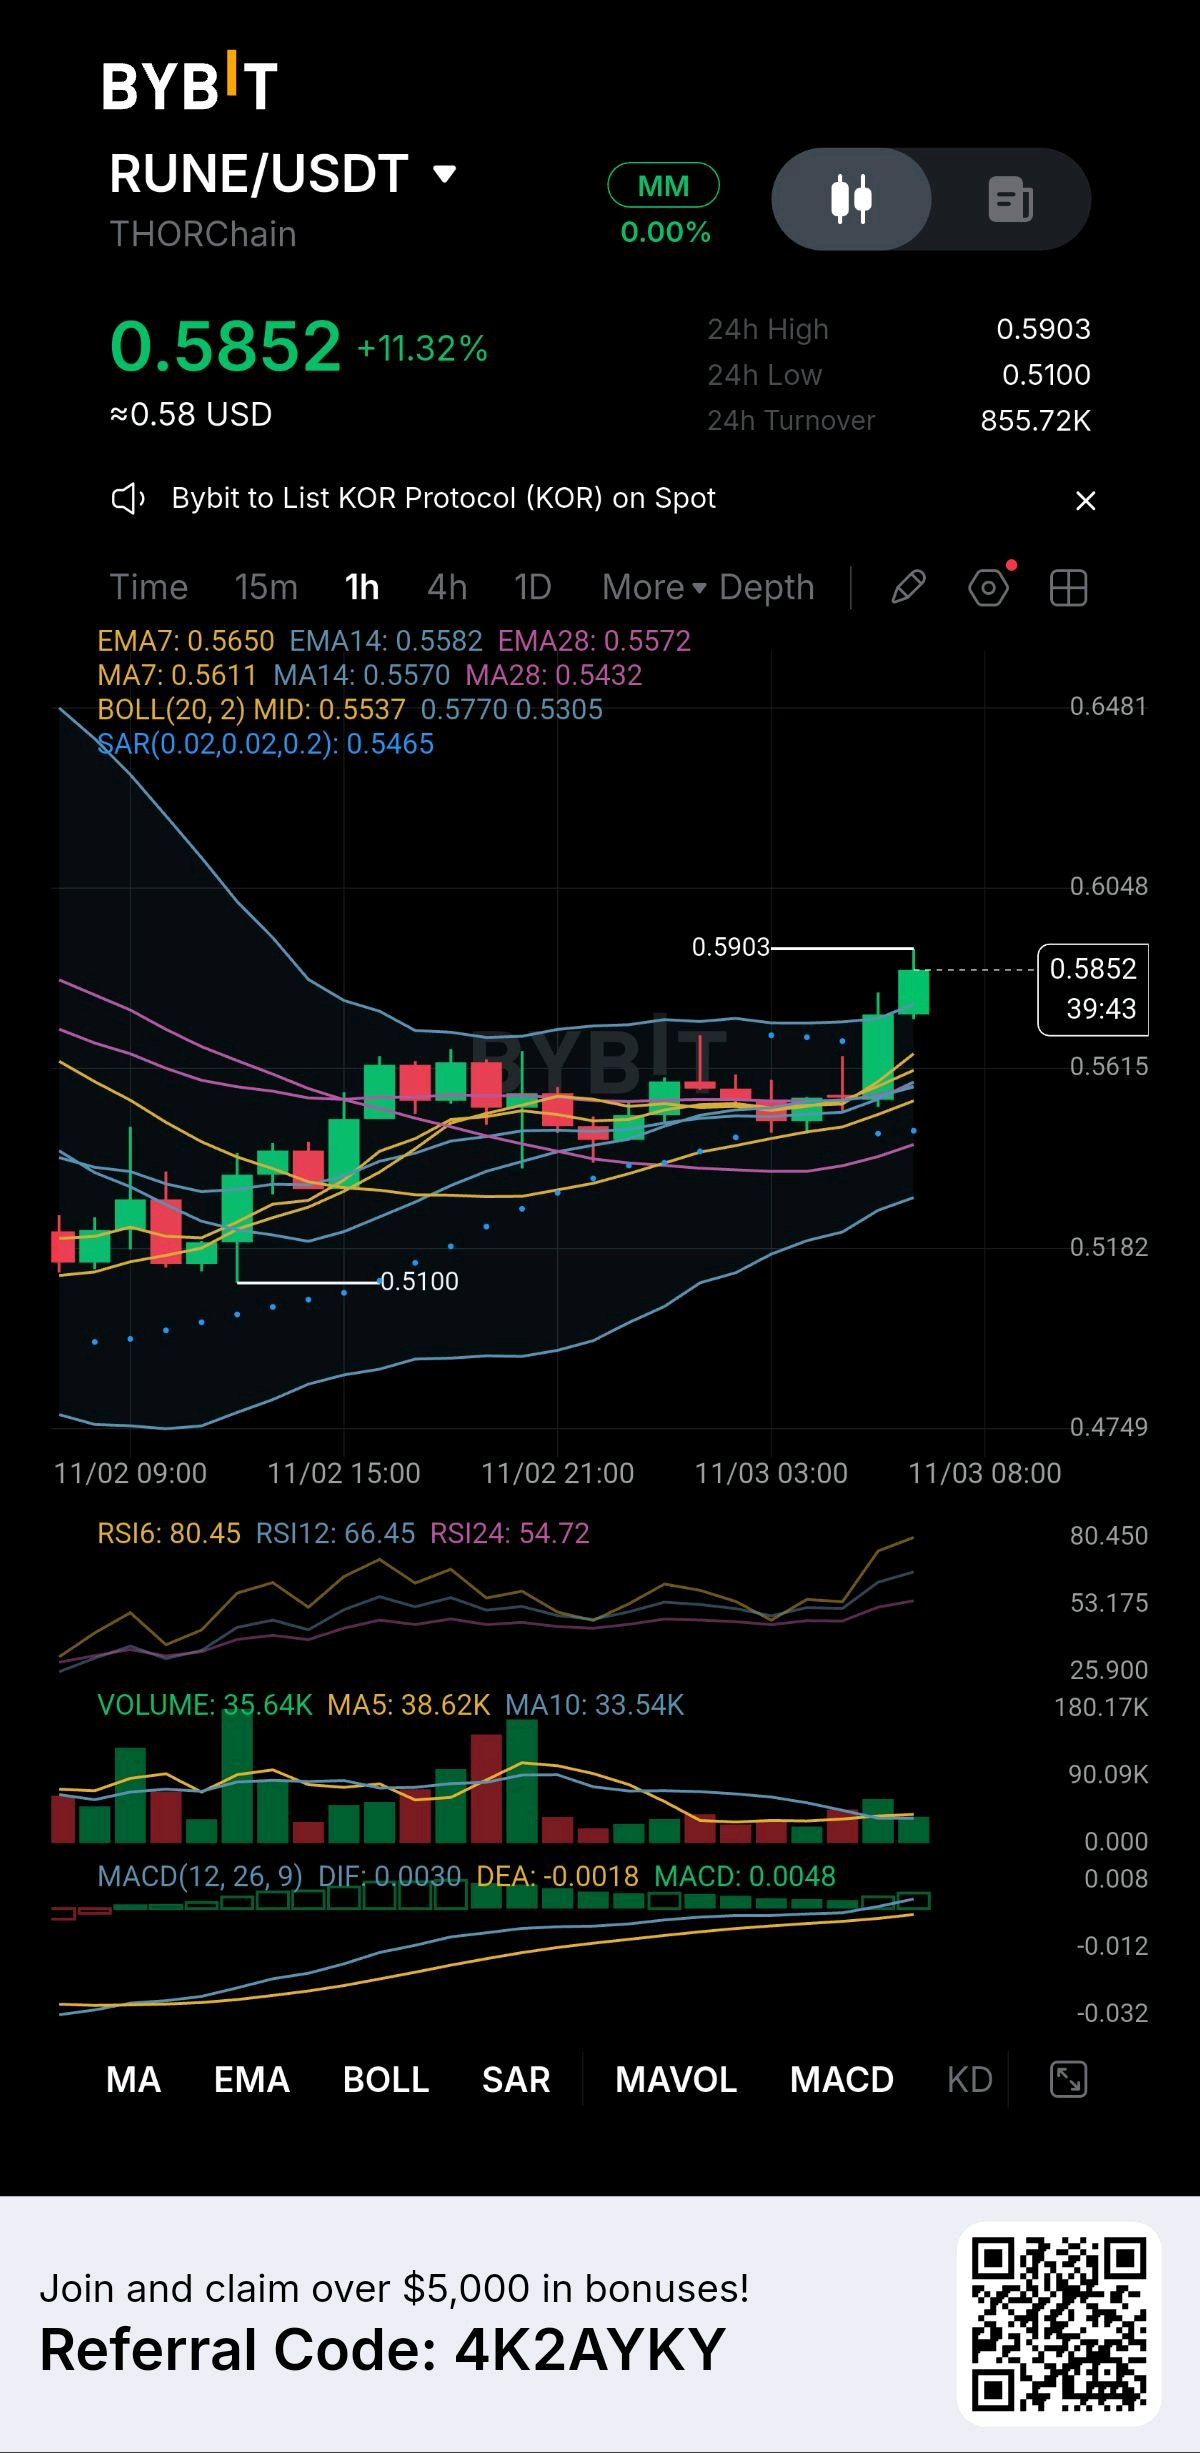
RUNE is putting on a spectacular display of bullish dominance, surging over 11% and shattering resistance. I am fully locked into this momentum, but my discipline is keeping me grounded. When a trend gets this aggressive, managing risk becomes more important than chasing gains. Looking at this 1-hour chart, the structure is undeniably powerful. We blasted from the 0.5100 base straight to a high of 0.5903. The EMA cluster is fanned out perfectly, acting as a launchpad, and the MACD is expanding with strong green momentum. Here is my technical reality check: The Strength: Buyers are in total control. The trend is our best friend right now. The Warning: The RSI6 is screaming at 80.45. This is clear overbought territory. Price is also riding the upper Bollinger Band, meaning a sudden snapback is a real possibility. My Execution Strategy and Risk Management: I am riding the wave, but I am not reckless. My Entry: I am not buying the absolute peak of this candle. I am waiting for a micro-retest of the EMA7 at 0.5650 to confirm the buyers are still defending the trend. My Ironclad Stop Loss: I am placing my strict stop loss just below the SAR indicator and the EMA cluster at 0.5450. If the price loses this structural floor, the momentum is officially dead, and I exit instantly. No hoping, no holding. My Target: My primary target is a clean sweep of the recent high at 0.5903, opening the door for the psychological 0.60 level. I am respecting the trend, protecting my downside, and letting the market do the heavy lifting. Are you riding this RUNE momentum, or waiting for the retest? $RUNEUSDT $PIEVERSEUSDT #ByXIMPACT #IMPACTbyTrade

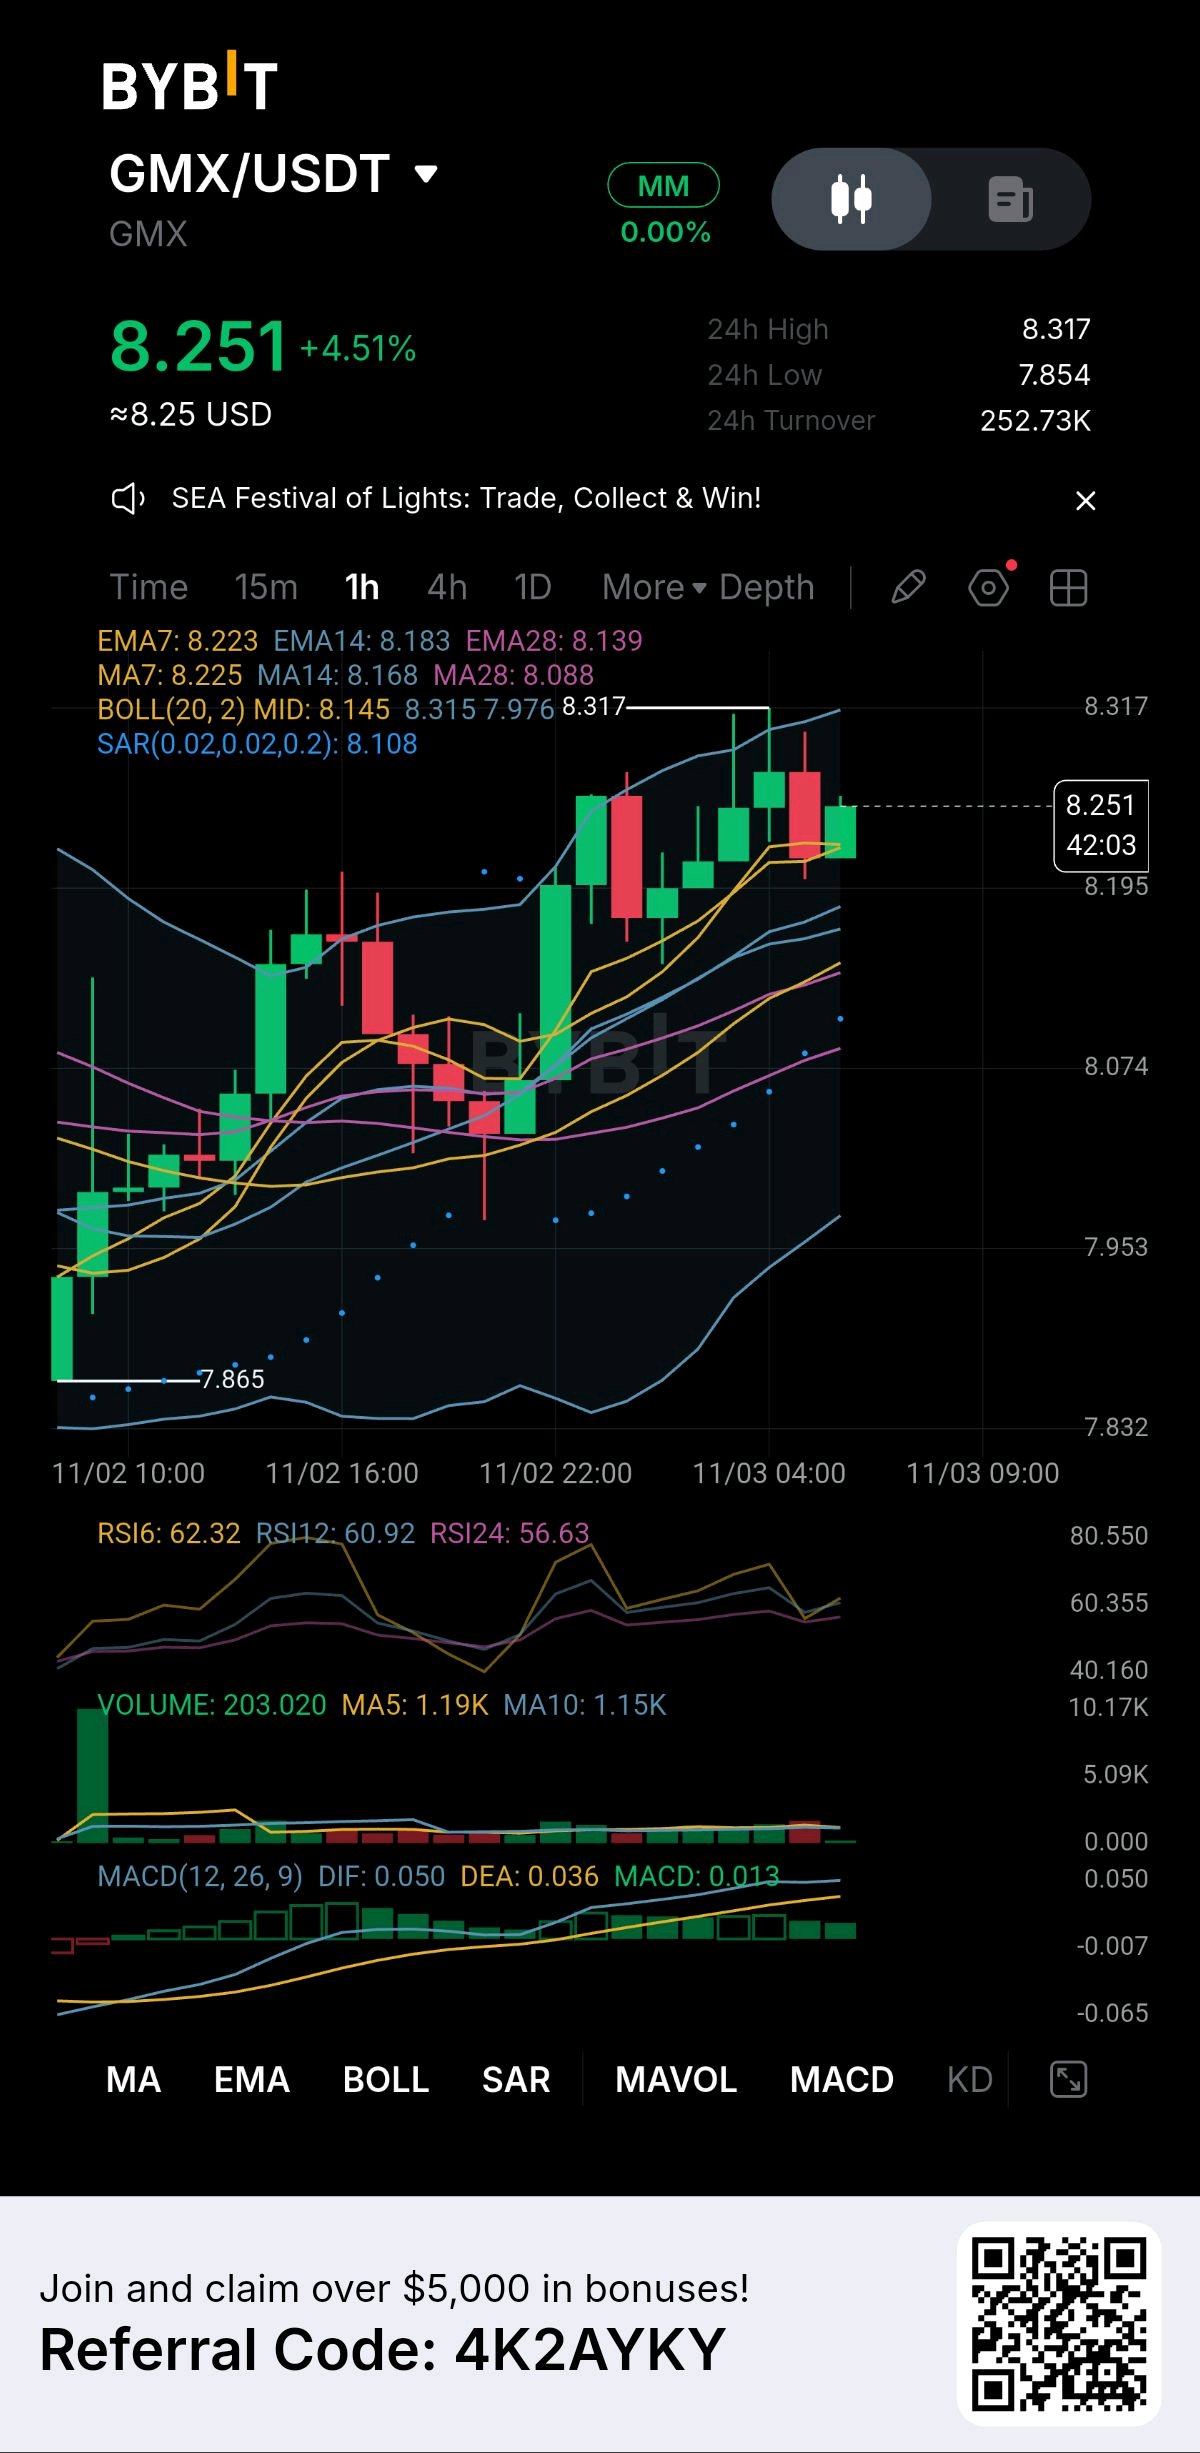
The market is handing me a perfect rhythm to trade, and GMX is my vehicle today. I am not chasing breakouts or guessing tops. I am buying the exact structural higher low before the next leg up. This is the art of the pullback trade. Looking at this 1-hour chart, the bulls have established a clear staircase pattern. We rallied to 8.317, and instead of crashing, the price is simply stepping back to test the EMA7 at 8.223. This is a textbook continuation setup. Here is my technical read on why I am treating this dip as a prime entry: The Trampoline: The EMA cluster (7, 14, and 28) is fanned out flawlessly. The EMA7 is acting as a dynamic floor, catching the price and refusing to let it drop. The Reload: The RSI is sitting at a very healthy 62.32. The brief overbought phase has cooled off, meaning the engine is completely reloaded for the next push. The Momentum: The MACD remains firmly in positive territory, confirming the buyers are still in total control of this trend. My Execution Strategy and Risk Management: I am accumulating right here at the pivot, but my capital remains fiercely protected. My Entry: I am buying at the current level (8.251) as the price bounces off the EMA support. My Ironclad Stop Loss: I am placing my strict stop loss just below the SAR indicator and the EMA28 at 8.080. If the price loses this structural floor, the higher-low thesis is invalidated, and I exit instantly. No hoping, just pure discipline. My Target: My primary target is a clean sweep of the recent high at 8.317, opening the door for new price discovery. I am buying the dip, protecting my downside, and letting the trend do the heavy lifting. Are you catching this GMX higher low with me? $GMXUSDT $ETHUSDT #ByXIMPACT #IMPACTbyTrade

Last Week's ETF Flows: Stocks Bought the Dip While Crypto Funds Headed for the Exit I put the two sets of ETF numbers side by side for the same week, and the gap was bigger than I expected. Between October 26 and 30, US spot Bitcoin ETFs lost $202.6 million and spot Ether ETFs lost $431.5 million, while equity ETFs took in about $27.4 billion over the five sessions through October 29. The crypto side came down to one day. Bitcoin funds had four straight days of inflows worth about $441 million, then Friday, the first full session after the Binance hack, brought $643.3 million of outflows, the biggest since June 25. BlackRock's IBIT led with $233.7 million and Fidelity's FBTC followed with $201 million. That pushed October to net outflows of $515 million, the first negative month since June, and total assets slipped to $98.14 billion, the first close below $100 billion this month. Ether funds had it worse, with a record $1.61 billion of outflows in October, which erased their entire 2026 inflow total. Stocks behaved differently under pressure. Technology fell 1.88% on the week, yet US tech ETFs still took in $2.1 billion, and sector funds as a group gathered $6.3 billion. Equity investors treated the earnings selloff as a place to add, while crypto fund holders treated the hack as a reason to reduce. I would keep it in proportion, though. The $643 million is under 1% of Bitcoin ETF assets, as an analyst at Laevitas pointed out, and spot ETF holders have no direct exposure to Binance because the Bitcoin sits with regulated custodians. Bitcoin ETFs are still up about $361 million for the year, and BTC has bounced three days in a row to around $78,600. This week I'm watching whether Bitcoin ETFs flip back to inflows now that the headline shock is fading, because that would show institutional demand returning. Do you read last week's flows as the start of a longer trend or a one-day reaction? Tell me what you're seeing. $BTCUSDT $AMZNXUSDT #ByXIMPACT

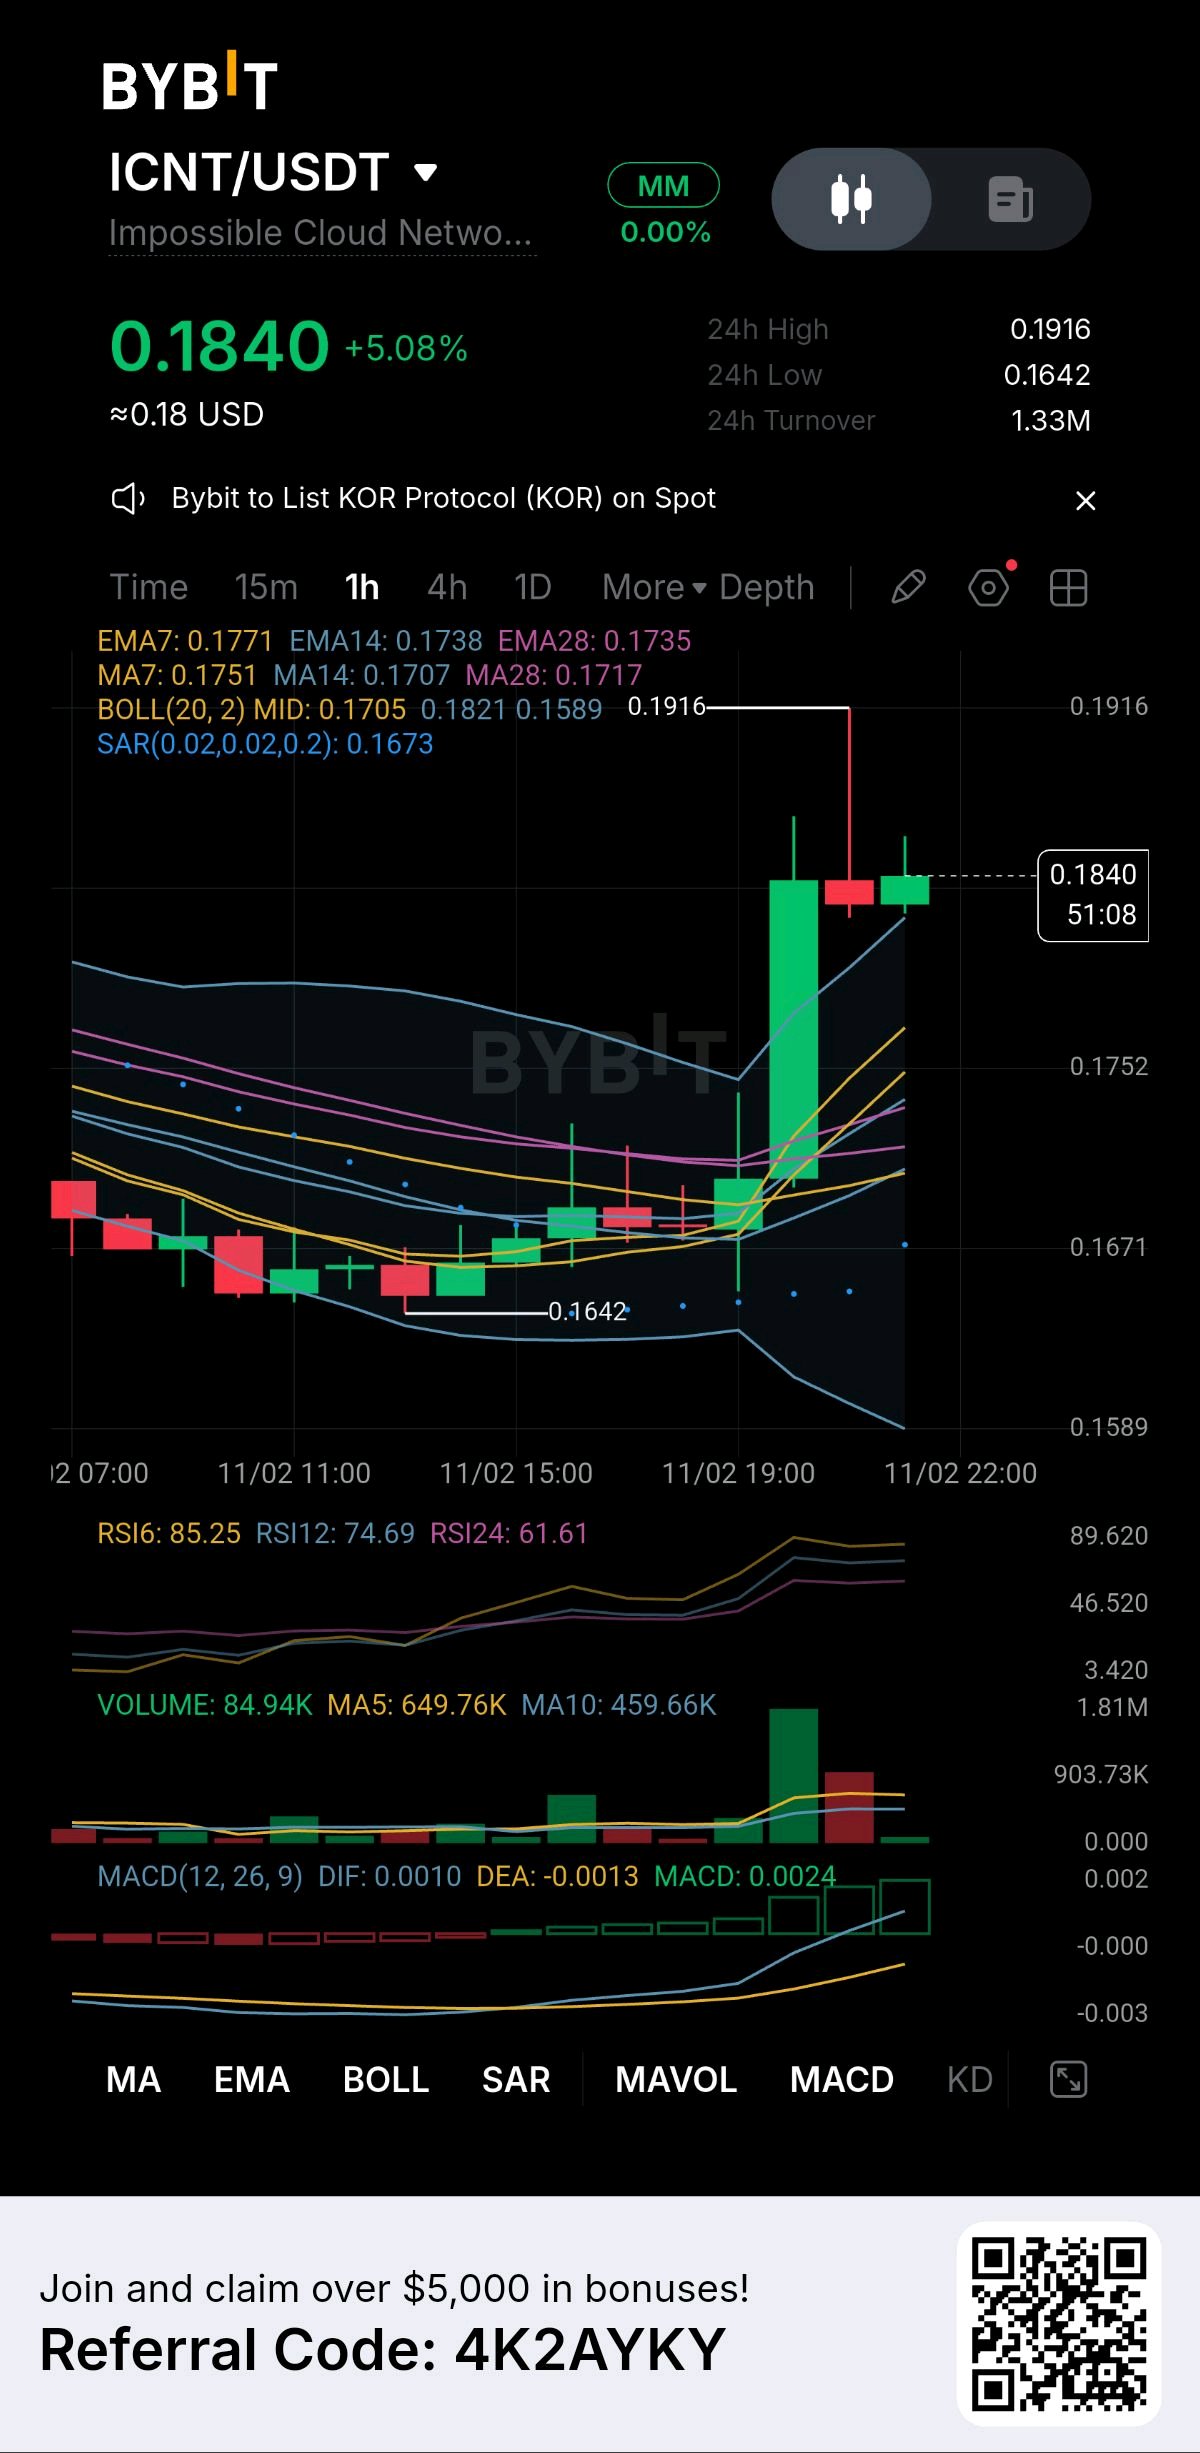
ICNT just pulled off a masterclass in market manipulation, and I am stepping in right now to ride the violent reversal. I absolutely love trading these setups where the market flushes out the weak hands before launching. Look at this 1-hour chart. We saw a brutal capitulation wick down to 0.1642, trapping the bears and stopping out the longs. But the reaction was instantaneous. The bulls stepped in with massive volume, erasing the entire drop and blasting straight through the EMA cluster to a high of 0.1916. Here is my technical read on why I am treating this as a prime buying opportunity: The Structural Reclaim: The price has completely engulfed the EMA7, EMA14, and EMA28. What was resistance is now our support floor. The Ignition: The MACD just executed a sharp bullish crossover, and the green histogram is expanding aggressively. The Reality Check: The RSI is running extremely hot at 85.25. Because of this, I am not chasing the top of that massive green candle. I am buying the current consolidation/retest. My Execution Strategy and Risk Management: I am stepping in to catch the continuation, but my capital is fiercely protected. My Entry: I am accumulating right here as the price stabilizes above the EMA cluster, holding the breakout. My Ironclad Stop Loss: I am placing my strict stop loss just below the SAR indicator and the recent swing low at 0.1640. If the price loses that structural floor, the reversal is a fakeout, and I exit instantly. No hoping, just pure discipline. My Target: My primary target is a clean sweep of the recent high at 0.1916, opening the door for new price discovery. I am buying the foundation of the reversal, protecting my downside, and letting the market do the heavy lifting. Are you catching this ICNT V-shaped recovery with me? $ICNTUSDT $DIAMUSDT #ByXIMPACT #IMPACTbyTrade

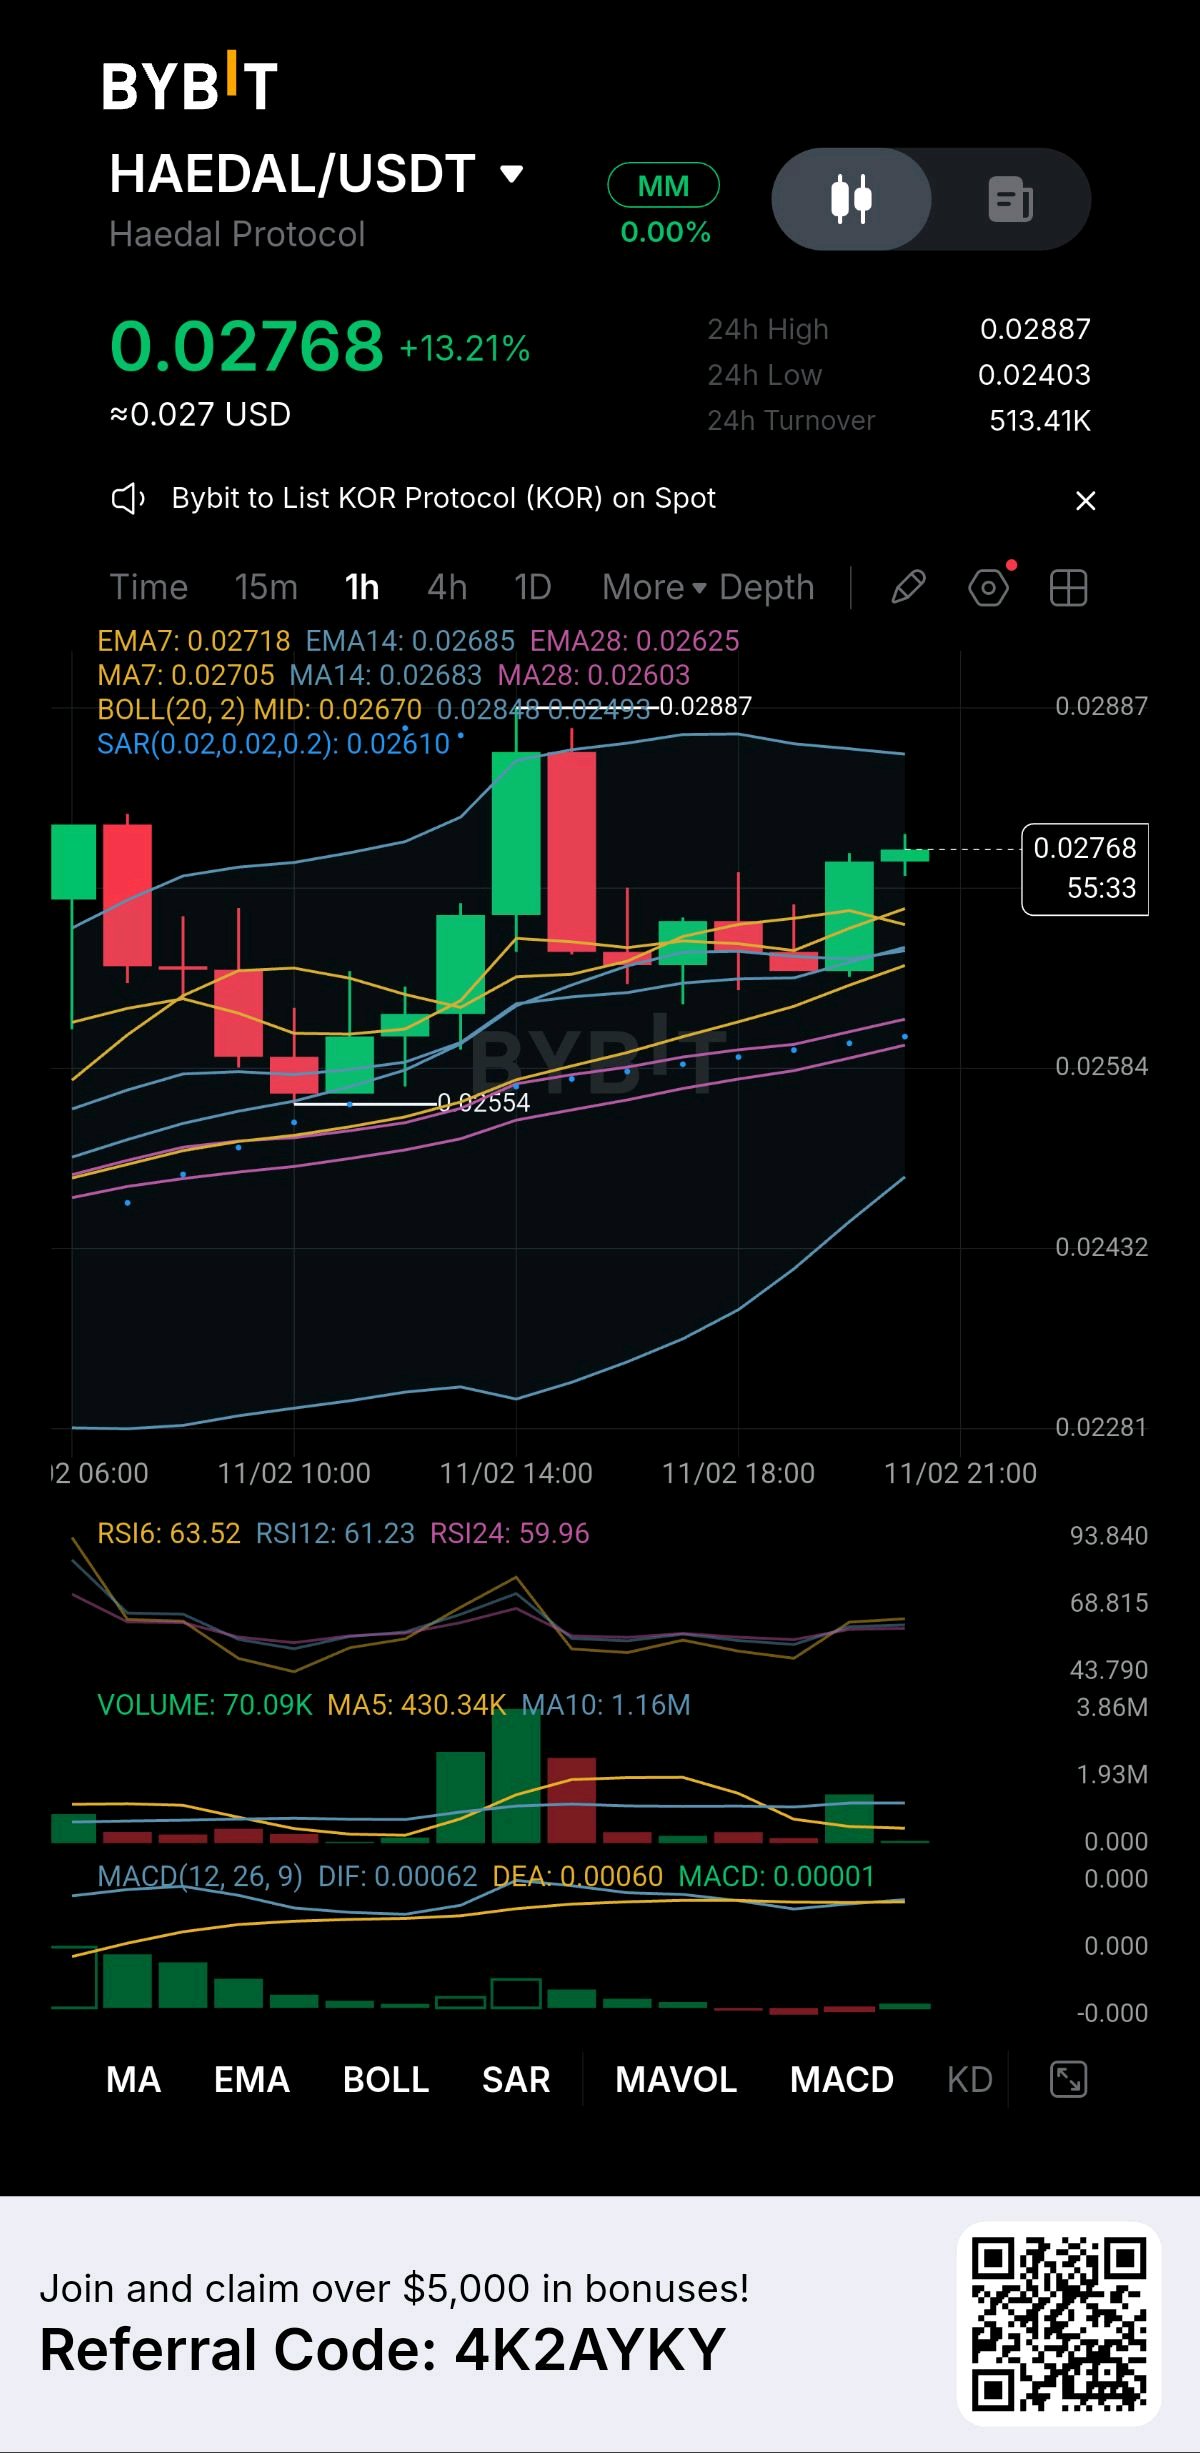
HAEDAL is showing absolute resilience, and I am stepping in right now to secure my position at this new floor. While others are waiting for another explosive green candle, I am buying the foundation of the next leg up. This is exactly how smart money operates. Looking at this 1-hour chart, we had a massive breakout to 0.02887. The market is taking a breath, but look at the structure. The price is refusing to drop, holding perfectly above the EMA7 at 0.02718. This is a textbook higher low forming right in front of us. Here is my technical read on why this is a prime entry: The Springboard: The EMA cluster (7, 14, and 28) is fanned out beautifully, with the price using the EMA7 as dynamic support. The Reset: The RSI has cooled perfectly from the overbought zone down to a healthy 63.52. The engine is reloaded, and the bulls have all the room they need to push higher. The Safety Net: The SAR dots are resting far below at 0.02610, confirming the macro trend is completely intact. My Execution Strategy and Risk Management: I am aggressively buying this bottom, but my capital is always protected. My Entry: I am accumulating right here at the current support level (0.02768). My Ironclad Stop Loss: I am placing my strict stop loss just below the EMA28 and the SAR indicator at 0.02600. If the price loses this structural floor, the bullish momentum is completely invalidated, and I exit instantly. I never hold and hope. My Target: My primary target is a clean sweep of the recent high at 0.02887, opening the door for pure price discovery. I am buying the dip, keeping my downside razor-thin, and letting the trend pay me. Are you securing your position at this HAEDAL bottom too? $HAEDALUSDT $ETHUSDT #ByXIMPACT

SPACEX (NASDAQ: SPCX): A 29% Drop From Its High. Opportunity or Warning Sign? SpaceX entered the public market with enormous expectations. But the stock's journey since its IPO has been anything but smooth. Here's what investors need to look at. 1. The IPO was historic - IPO price: $135 per share - IPO date: June 12, 2026 - Capital raised: approximately $85.7 billion, including the underwriters' overallotment. 2. The post-IPO reality - Record closing price: $201.80 on June 16 - Recent market quote: around $139 - That's approximately 29% below its record closing high, putting the stock close to its IPO price again. The initial excitement has cooled, and investors are now demanding more than a powerful story. 3. What could drive the next move? Three major factors deserve attention: - Starlink: Can recurring connectivity revenue continue scaling? - Starship: Can reusable launch technology deliver commercially meaningful progress? - AI infrastructure: Can SpaceX turn its ambitious space-based computing vision into a profitable business? MY TAKE A 29% decline from the peak does not automatically make SPCX undervalued. The real opportunity depends on whether revenue growth, execution, and future profitability can justify the market's expectations. I'm watching whether the stock can build a stable base near its IPO price rather than simply chasing another speculative rally. Would you buy SPCX near its IPO price of $135, or wait for stronger financial confirmation? $SPCXXUSDT $XAUTUSDT #ByXIMPACT #IMPACTbyTrade

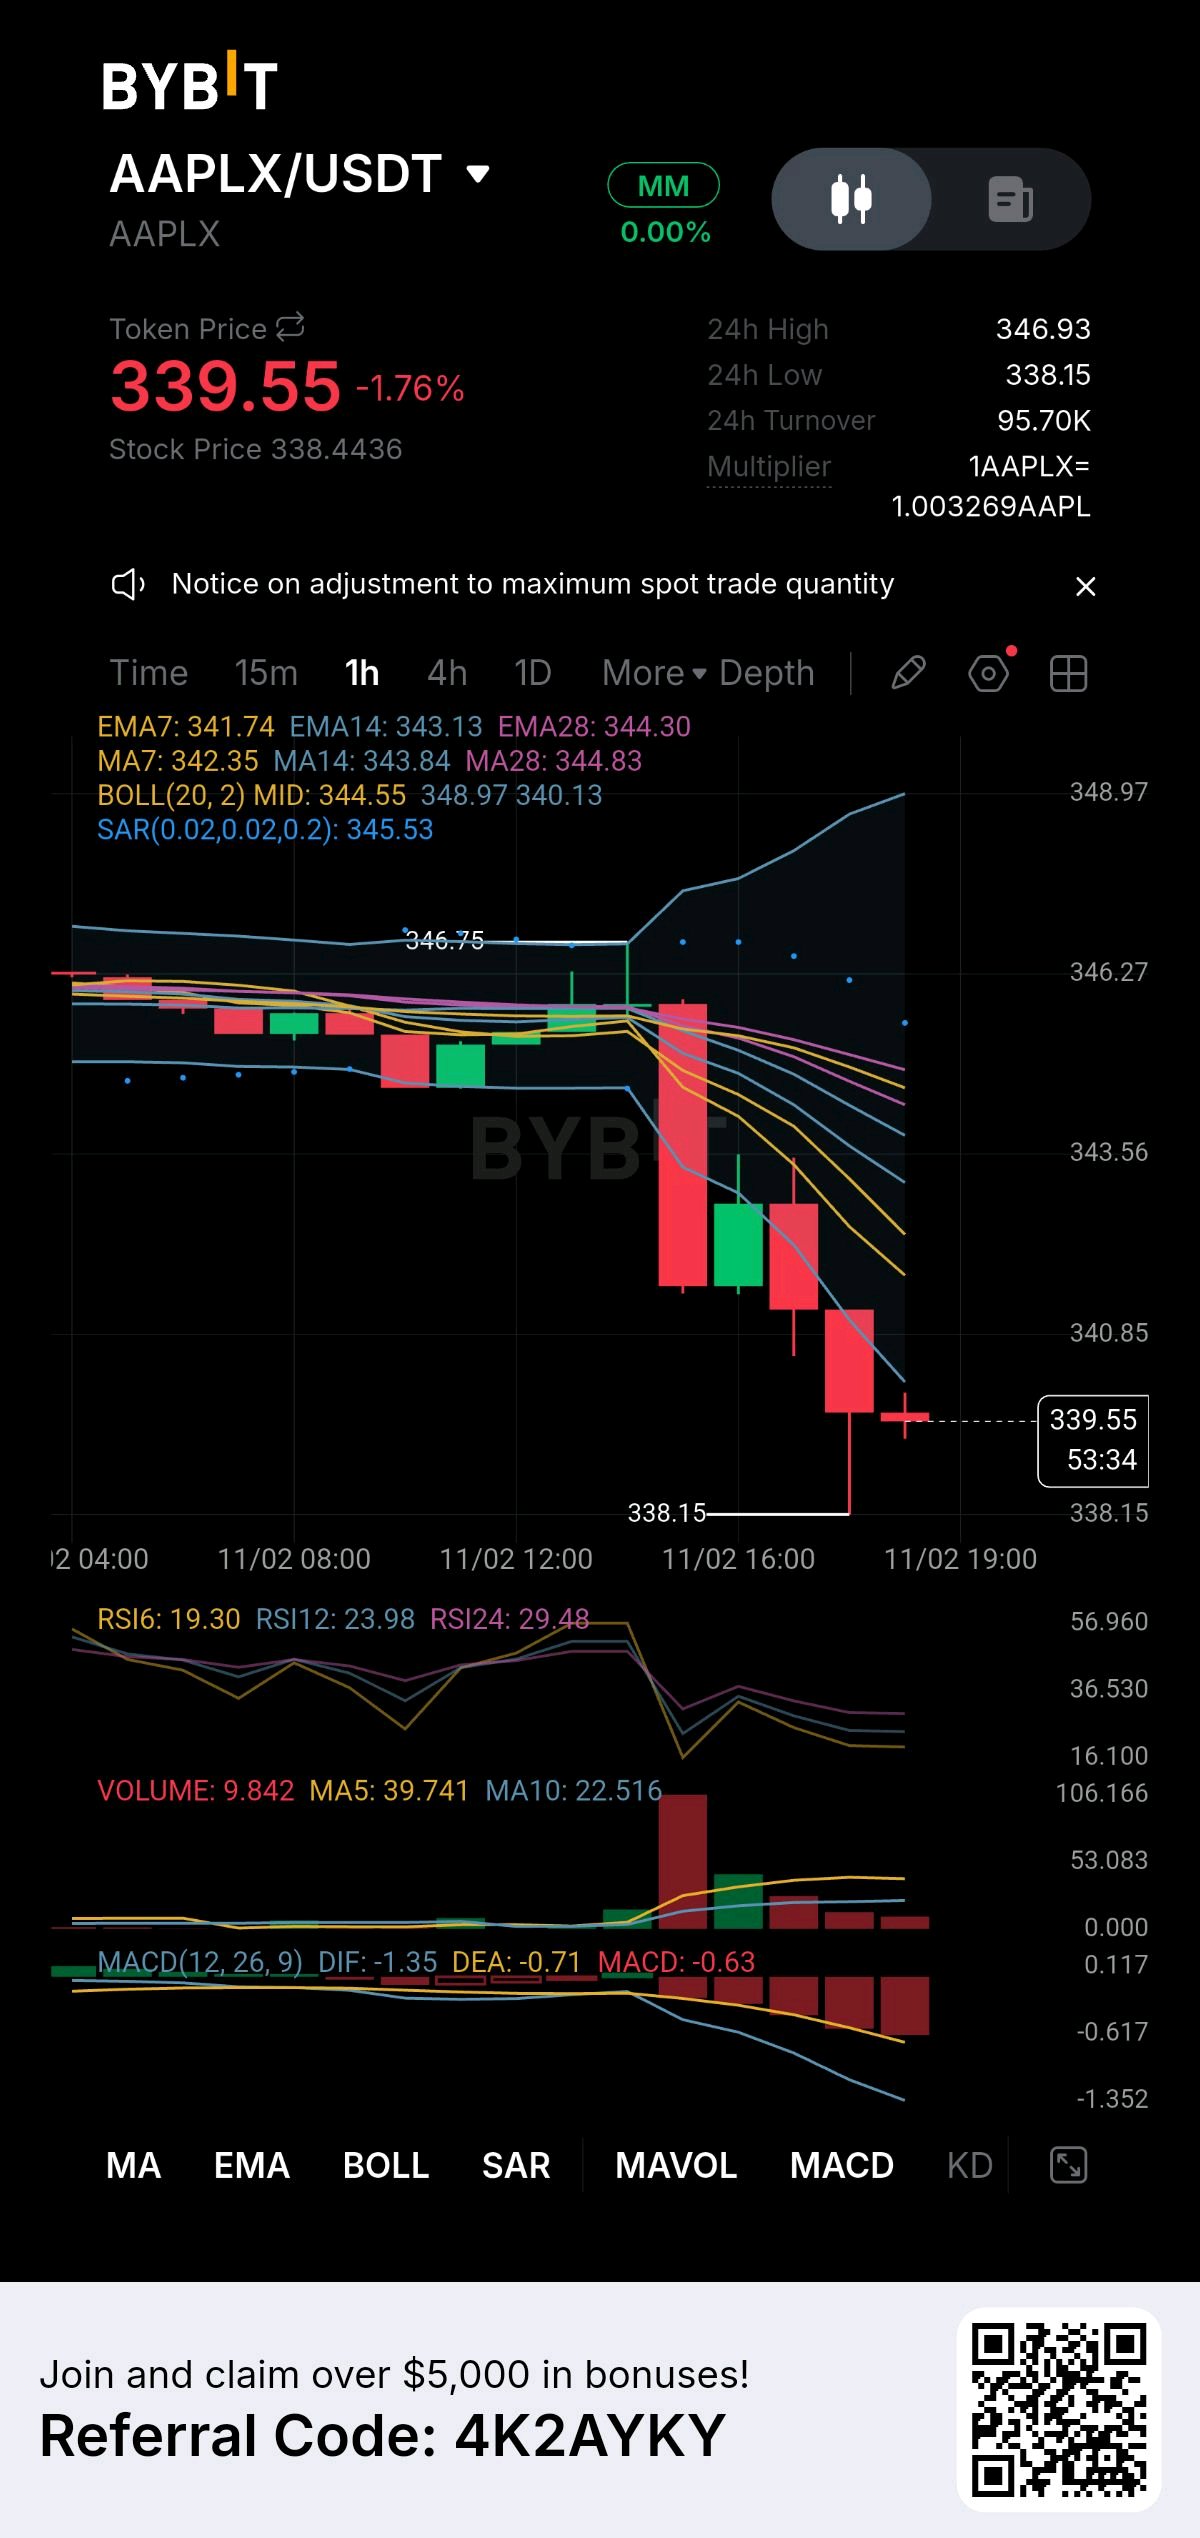
AAPLX just flushed out the weak hands with a brutal drop, and I am stepping right into the fire. While the crowd is panicking and dumping their bags, I am looking at a prime, historical bottoming opportunity. This is where real value emerges. Look at this 1-hour chart. We saw a violent sell-off straight down to 338.15. But look at the data screaming at us right now: The Extreme Exhaustion: The RSI is completely broken, sitting at a massive 19.30. This is pure, unadulterated panic selling. Historically, when the RSI drops this deep, sellers are entirely exhausted, and a violent snapback is imminent. The Stretched Rubber Band: The price is trading far, far outside the lower Bollinger Band and completely detached from the EMA cluster. The market always reverts to the mean. My Execution Strategy and Risk Management: I am hunting this reversal with surgical precision. I don't catch a falling knife blindly; I use strict risk management. My Entry: I am accumulating right here at the 339.55 level, anticipating the dead-cat bounce and mean reversion. My Ironclad Stop Loss: I have placed my strict stop loss just below the absolute wick low at 337.50. If the price breaks below this final floor, the bottoming thesis is dead, and I exit instantly. My capital is fiercely protected. No hoping, just discipline. My Target: My first target is a quick retest of the EMA7 at 341.74, followed by the middle Bollinger Band at 344.55. I am buying the blood, protecting my downside, and waiting for the inevitable bounce. Are you catching this AAPLX bottom with me? $AAPLXUSDT $NVDAXUSDT #ByXIMPACT

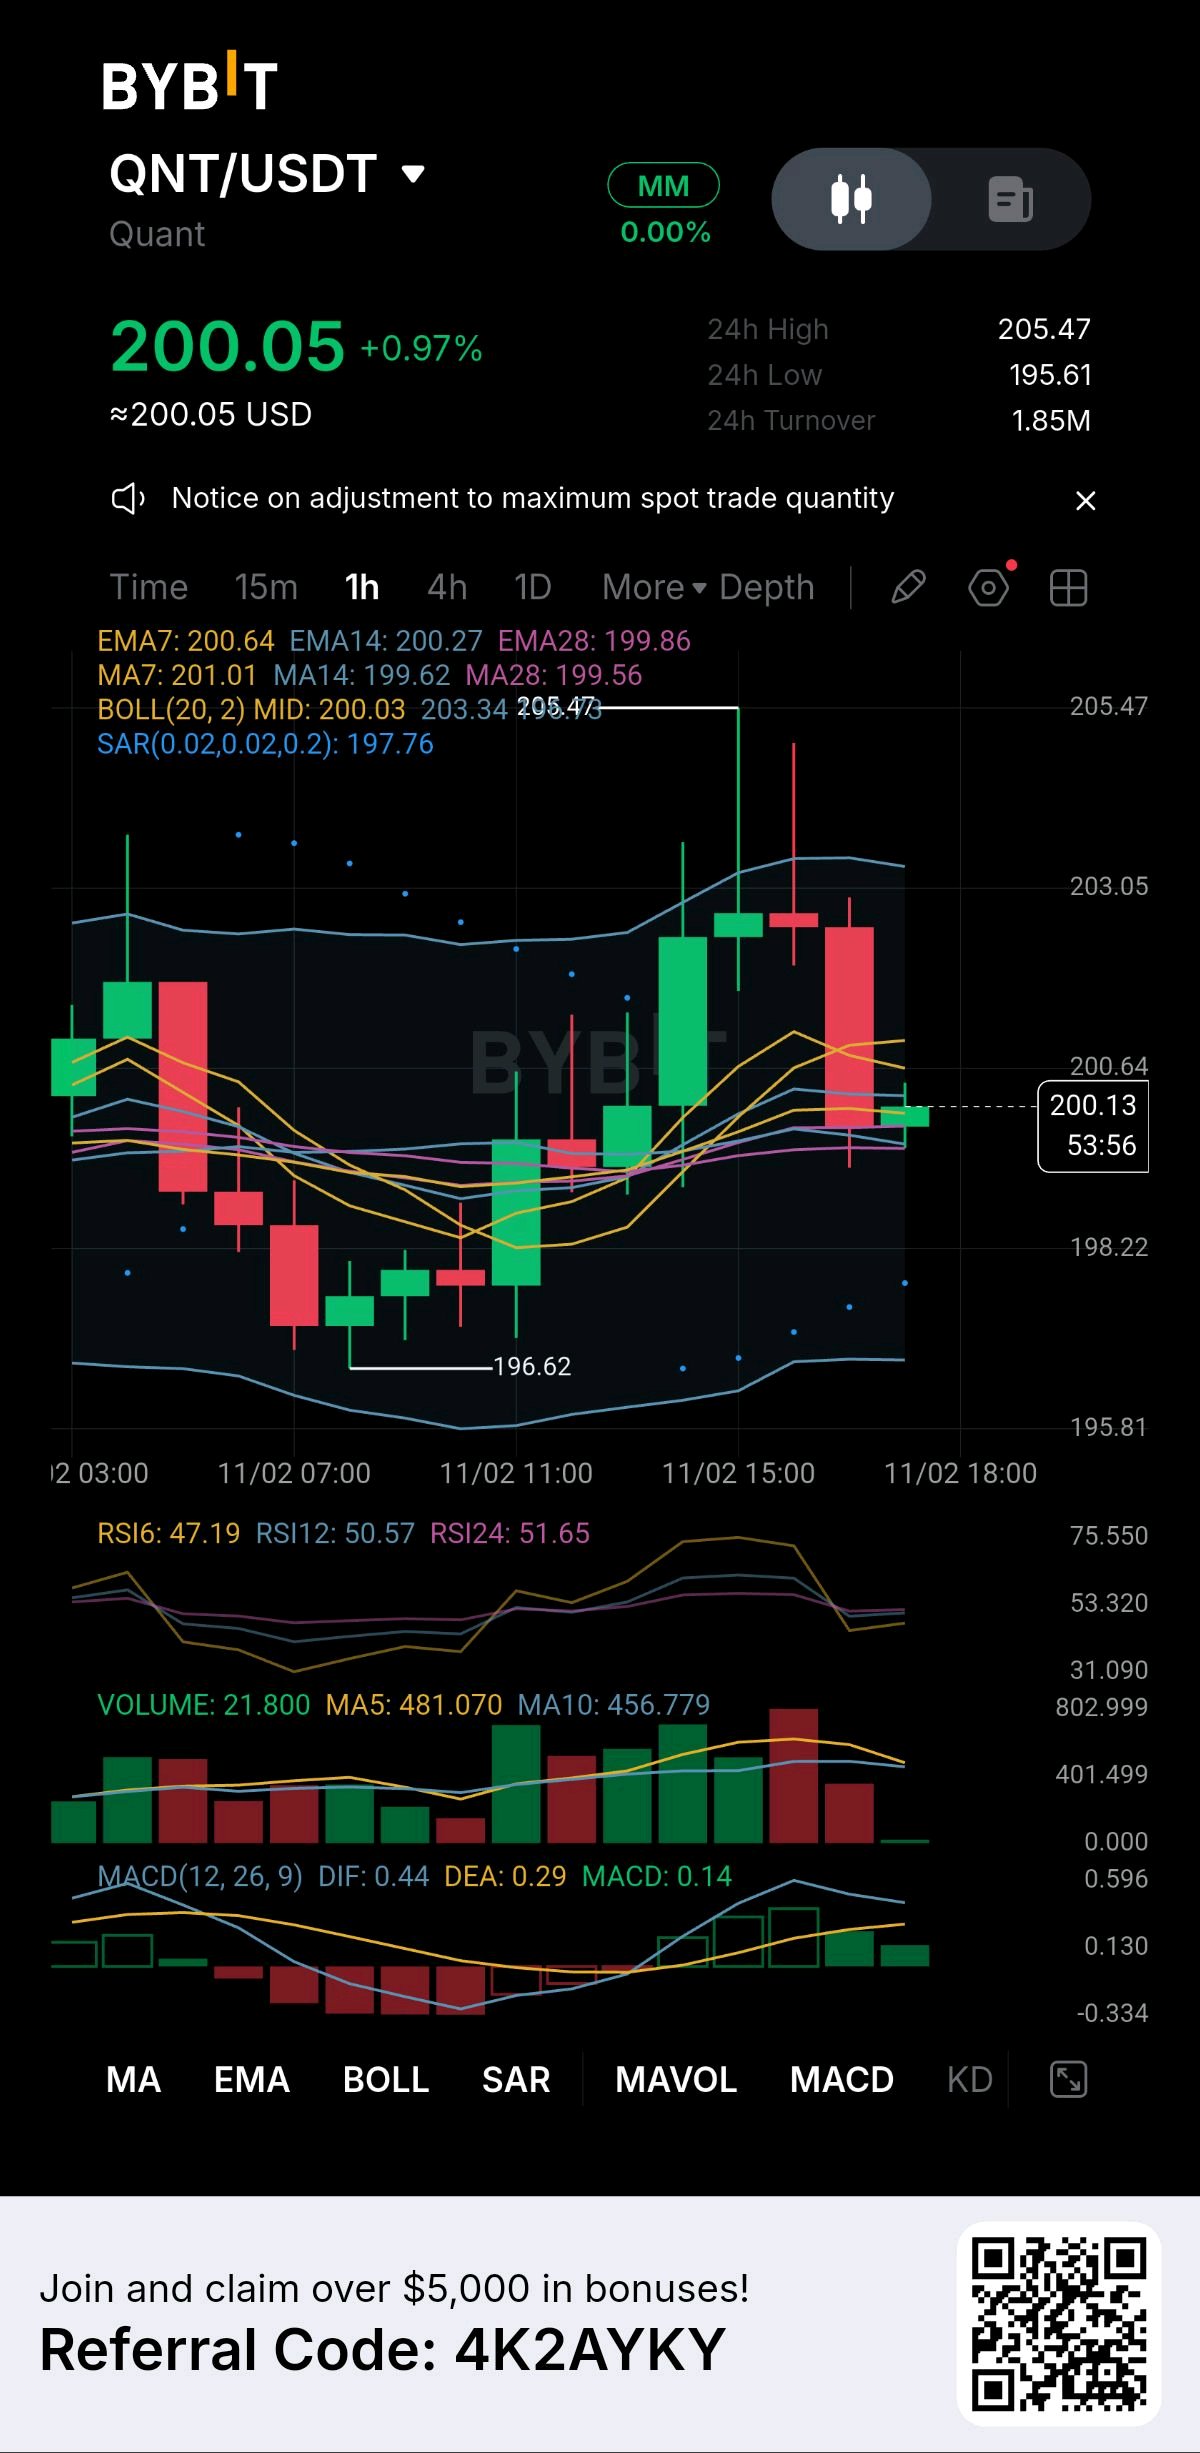
QNT just experienced a sharp rejection from the highs, and this pullback is exactly the opportunity I have been waiting for. I don't panic when I see red candles; I look at where the price lands. Right now, it has landed perfectly on a structural floor. Looking at this 1-hour chart, after a strong push to 205.47, the price retraced and is now stabilizing at 200.05. This is a classic setup for a high-probability bounce. Here is my technical read on why I am accumulating this dip: The Support Cluster: The price is resting exactly on the EMA7 (200.64) and EMA14 (200.27), with the EMA28 just below at 199.86. This tight convergence creates a powerful dynamic support zone. The Neutral Zone: The RSI is sitting perfectly balanced at 47.19. The selling pressure from the recent drop is completely exhausted, leaving no downward momentum. The Bullish Structure: The MACD remains in positive territory, and the SAR dots are safely below at 197.76, confirming the broader trend is still intact. My Execution Strategy and Risk Management: I am treating this support level as a prime buying opportunity, but my capital remains my top priority. My Entry: I am scaling into a long position right here as the price tests the EMA cluster. My Hard Stop Loss: I am placing my strict invalidation level just below the SAR and the recent swing low at 196.50. If the price breaks below this structural floor, the bullish setup is dead, and I exit instantly. No holding and hoping. My Target: My first target is a clean reclaim of the recent high at 205.47, opening the door for new price discovery. I am buying the foundation, protecting my downside, and letting the trend do the heavy lifting. Are you picking up QNT at this support level? $QNTUSDT $ETHUSDT #ByXIMPACT #IMPACTbyTrade

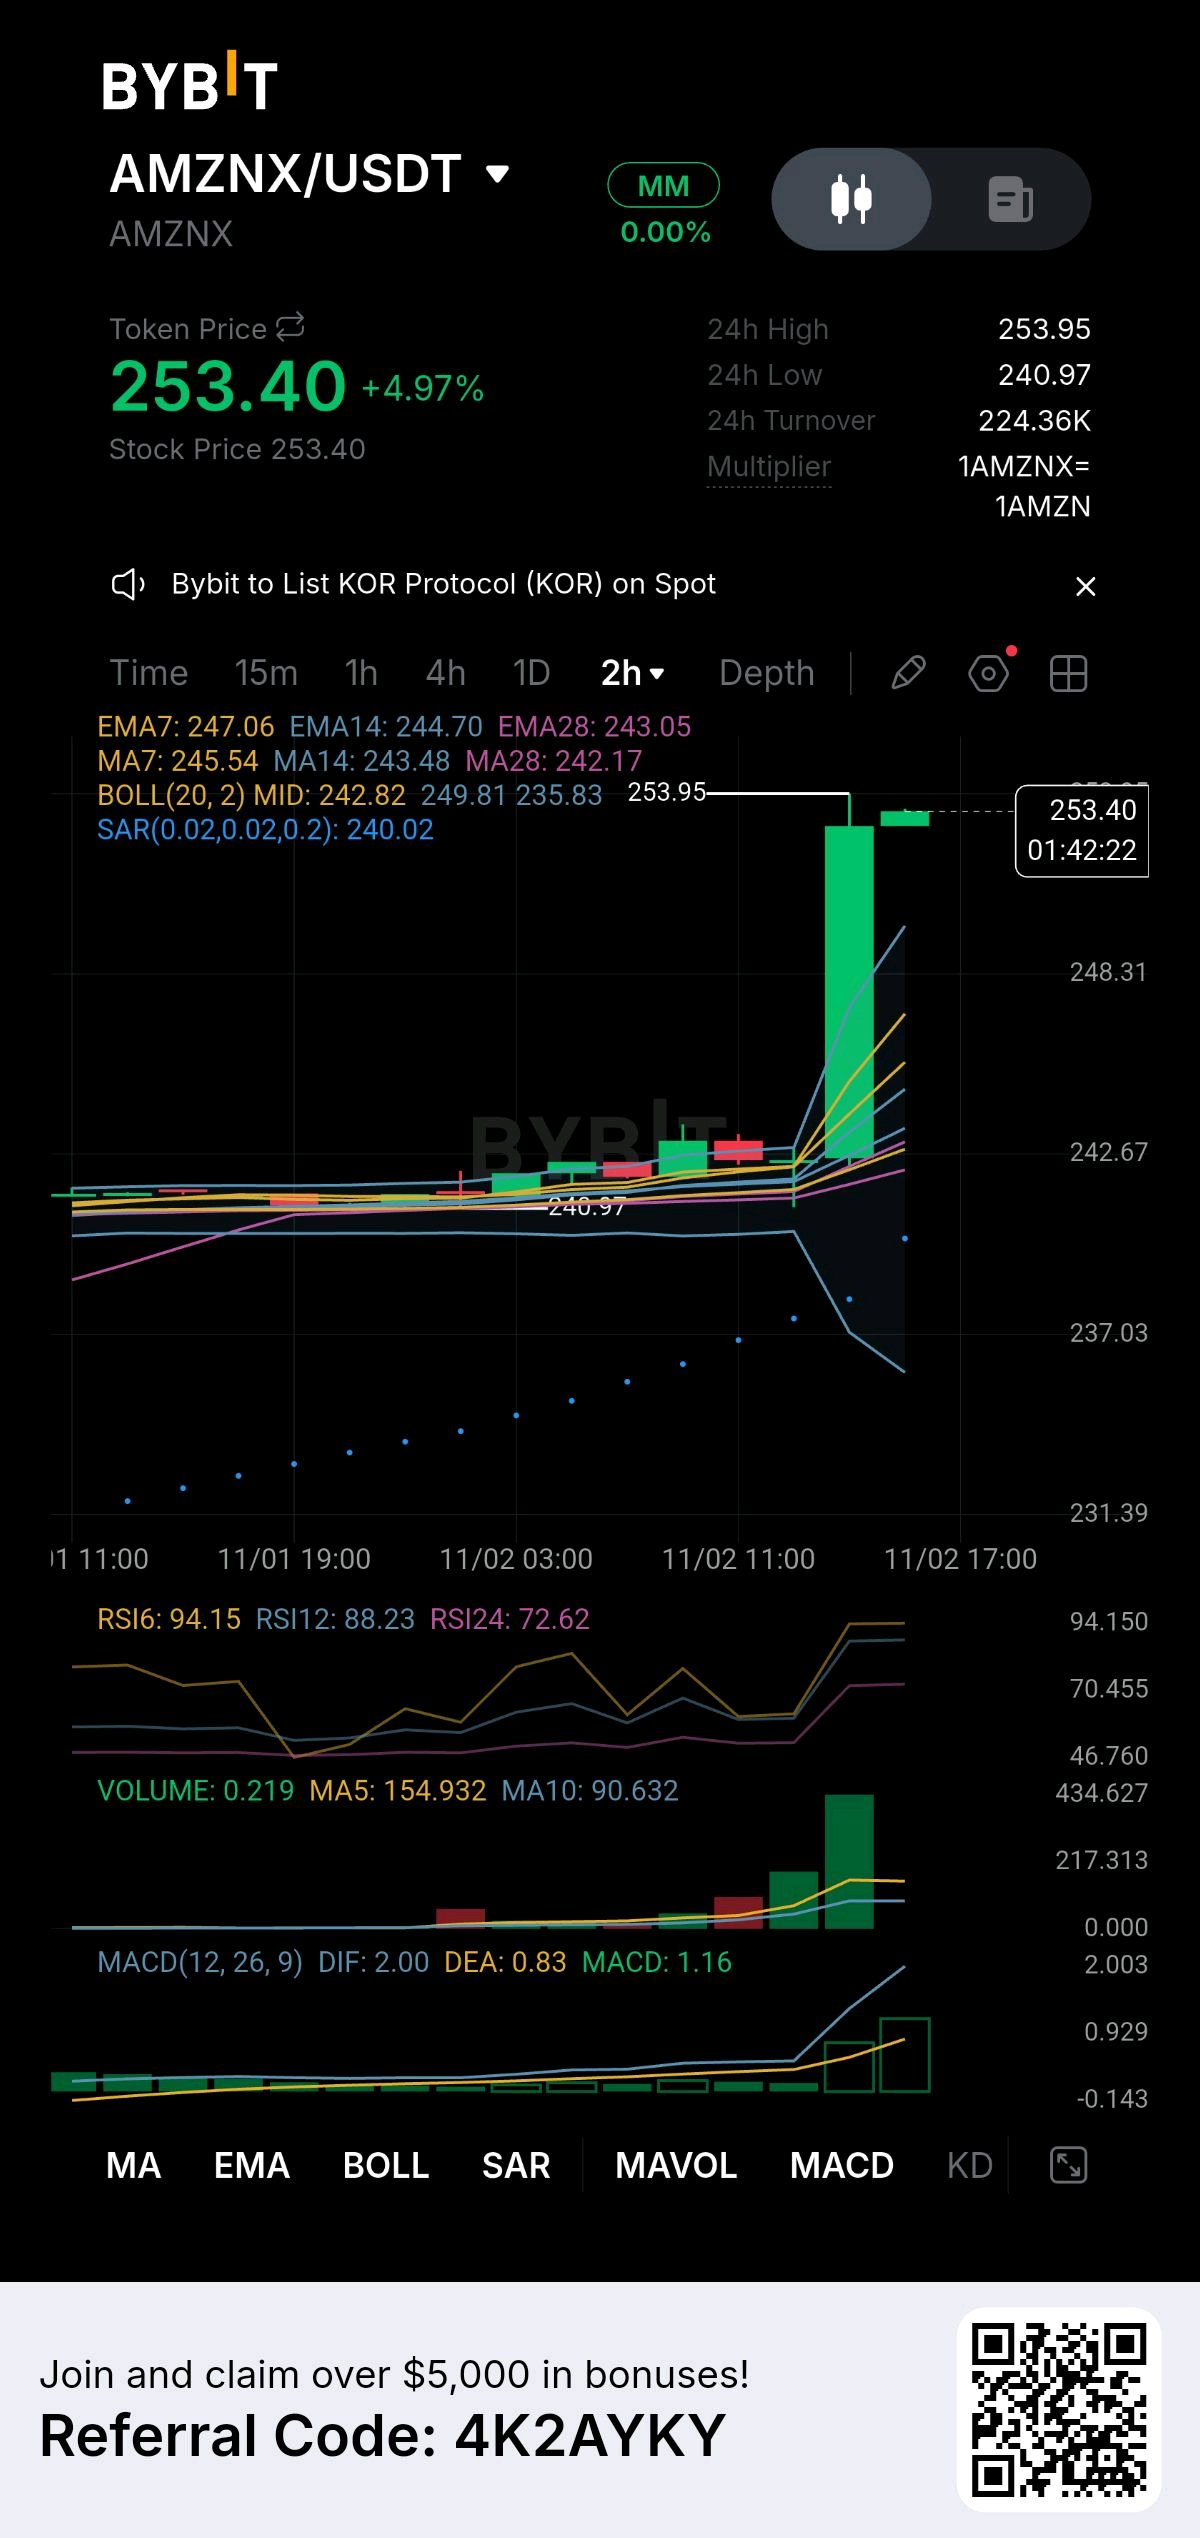
AMZNX just woke up with a thunderous breakout, and I am already mapping out my plan to catch the perfect entry. I do not chase runaway green candles; I buy the foundation of a new trend. This is exactly where discipline creates real opportunity. Look at this 2-hour chart. We broke out of a long, agonizing flatline (240.97 - 242.67) and exploded straight to 253.95. The MACD is expanding massively, and the EMA cluster is fanning out beautifully, confirming a major structural shift to the bulls. However, I am also a realist. The RSI is dangerously hot at 94.15. This is why I am not buying the top of this wick. My Execution Strategy and Risk Management: I am treating the upcoming retracement as my prime buying opportunity to catch the new "bottom" of this trend. My Entry: I am setting my orders to accumulate on a controlled pullback to the EMA7 support around 247.00. If buyers defend that level, I strike. My Ironclad Stop Loss: I am placing my hard stop loss just below the EMA14 at 244.50. If the price breaks below this structural floor, the breakout is a fakeout, and I exit instantly to protect my capital. No hoping, just pure risk management. My Target: My primary target is a clean sweep of the 253.95 high, opening the door for new price discovery. I am buying the foundation of this new trend, keeping my downside strictly limited, and letting the market do the heavy lifting. Are you waiting for this AMZNX retest to enter, or are you riding the initial wave? $AMZNXUSDT $XAUTUSDT #ByXIMPACT #IMPACTbyTrade