Cardtonic
8046Like3Shares213Fans7Follow
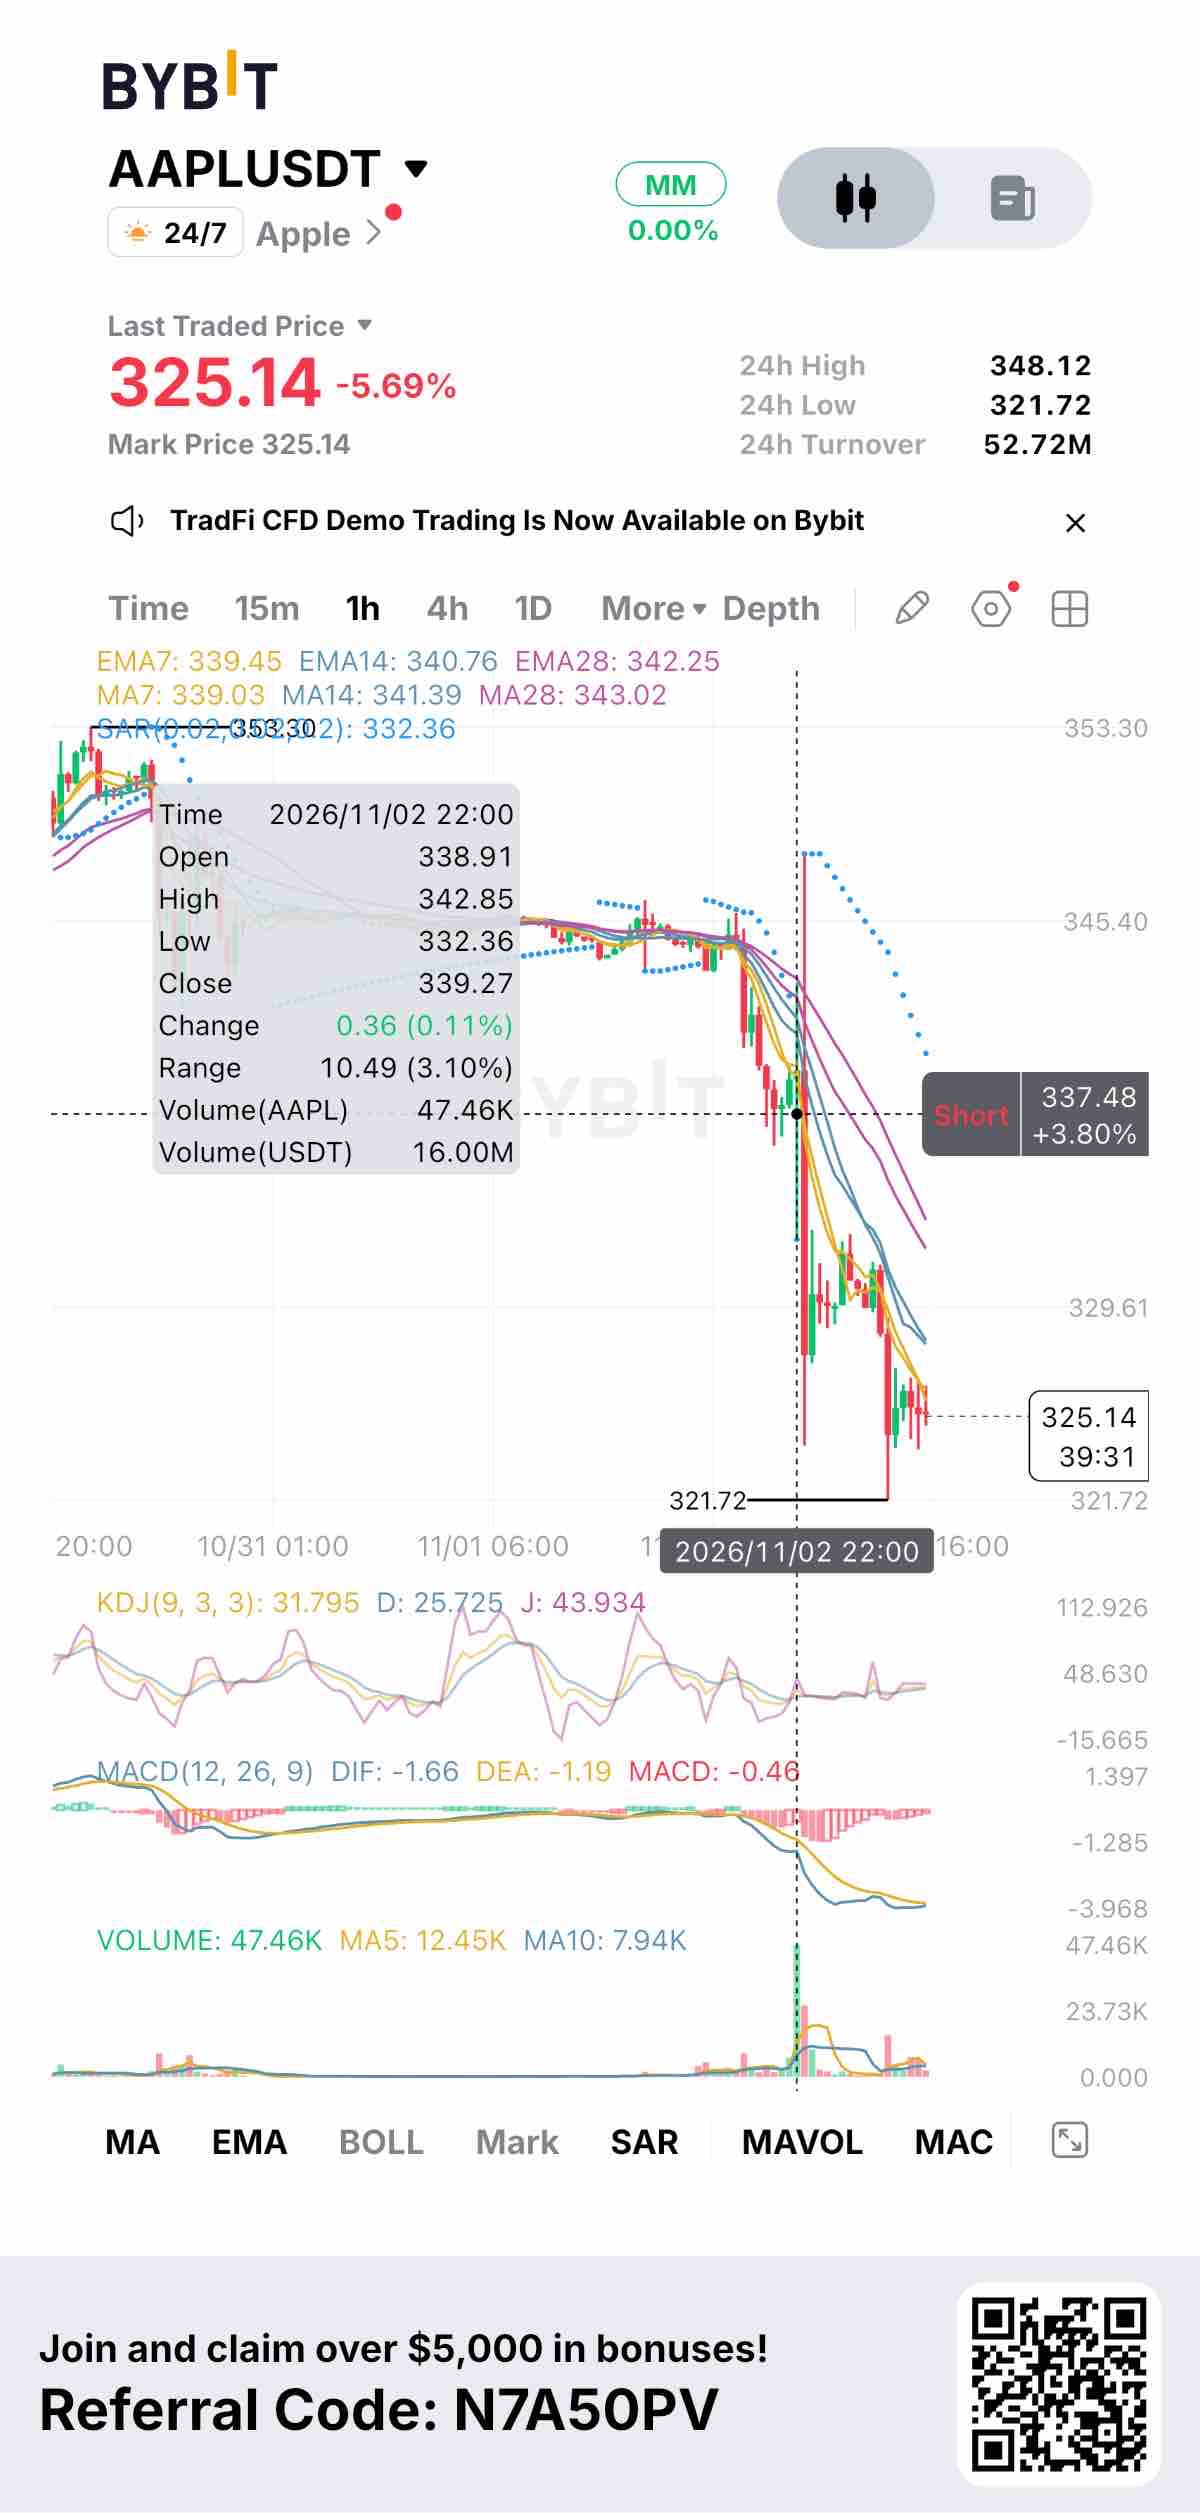
I almost ignored this because -5.69% is a heavy drop, but then I saw the volume structure. $AAPLUSDT -5.69% today price at 325.14, below the 24h high of 348.12 low was 321.72 that's an 8.2% range from bottom to top heavy move turnover 52.72M excellent liquidity. The setup (1h chart): MAs are stacked bearishly: Price is below MA7 (339.03), below MA14 (341.39), and below MA28 (343.02) all three aligned clean bearish structure with wide separation. The EMAs (339.45, 340.76, 342.25) confirm the heavy downtrend. Volume printed 47.46K on the last 1h candle MA5 is 12.45K, MA10 is 7.94K that's above MA5 (381% of average) and above MA10 (597% of average) volume is exploding on a down candle this is a massive red flag indicating heavy distribution or panic selling. What I like: · AAPL is a major stock token with 52.72M turnover excellent liquidity · The massive volume spike could indicate a capitulation event, meaning a short-term bottom might be near · Price is bouncing slightly off the 24h low (321.72) · MM shows 0.00% – low funding/spread cost right now What I don't like: · Bearish MA stack (MA28 > MA14 > MA7) – the trend is heavily bearish · Price is far below all three MAs – massive overhead resistance · Volume on the last 1h candle (47.46K) is absolutely exploding on a red candle – heavy selling pressure · 8.2% range in a single session is a violent move down · 1h timeframe means catching a falling knife is extremely risky · MACD is deeply negative and showing no signs of immediate reversal yet Key levels: · Resistance 339.03 (MA7) then 341.39 (MA14) then 343.02 (MA28) then 348.12 (24h high) – need a massive bounce and volume shift to reclaim these · Support 321.72 (24h low) – lose this and the breakdown accelerates to new lows · Invalidation below 321.72 – that confirms the downtrend continues My play: I'm passing on this one – trying to catch a falling knife with massive volume. If I were to scalp a bounce, I'd place a small spot limit at 321.72–322.00 (24h low area) stop at 318.00 (below support) first target 325.14, second 330.00. R:R: Entry 321.80, stop 318.00 = 1.18% risk first target 325.14 = 1.04% gain → 0.88:1 second target 330.00 = 2.54% gain → 2.15:1 – poor R:R for a scalp, but acceptable on the second target if it bounces. My rule: I need to see volume completely dry up on the red candles and a strong bullish reversal candle (like a hammer or engulfing) with volume >15K before considering a long entry. Without that, this is a hard skip. If price reclaims 339.03 (MA7) with volume >20K, I'll reconsider with 0.5% risk. If we lose 318.00, i'm out. Risk note: Synthetic Apple stock token, excellent liquidity turnover 52.72M, but the chart shows a violent sell-off with volume exploding 381% above MA5 on a down move. AAPL tracks Apple stock, so macro factors likely triggered this dump. MM shows 0.00% – funding/spread cost to consider if trading perpetuals. Not financial advice – just following the volume and it's telling me there's panic selling, so I'm staying away until the dust settles. Gotta watch this one is $AAPLUSDT gonna bounce off 321.72 with renewed buying volume, or just continue to bleed? Volume is telling me heavy selling – 47.46K vs 12.45K MA5 is a massive dump. My levels: 339.03 (MA7) to reclaim with volume 20K, 321.72 support, 318.00 invalidation. For now, i'm firmly on the sidelines – volume is exploding on the downside and it's too risky to catch this falling knife. $AAPLXUSDT #ByXIMPACT
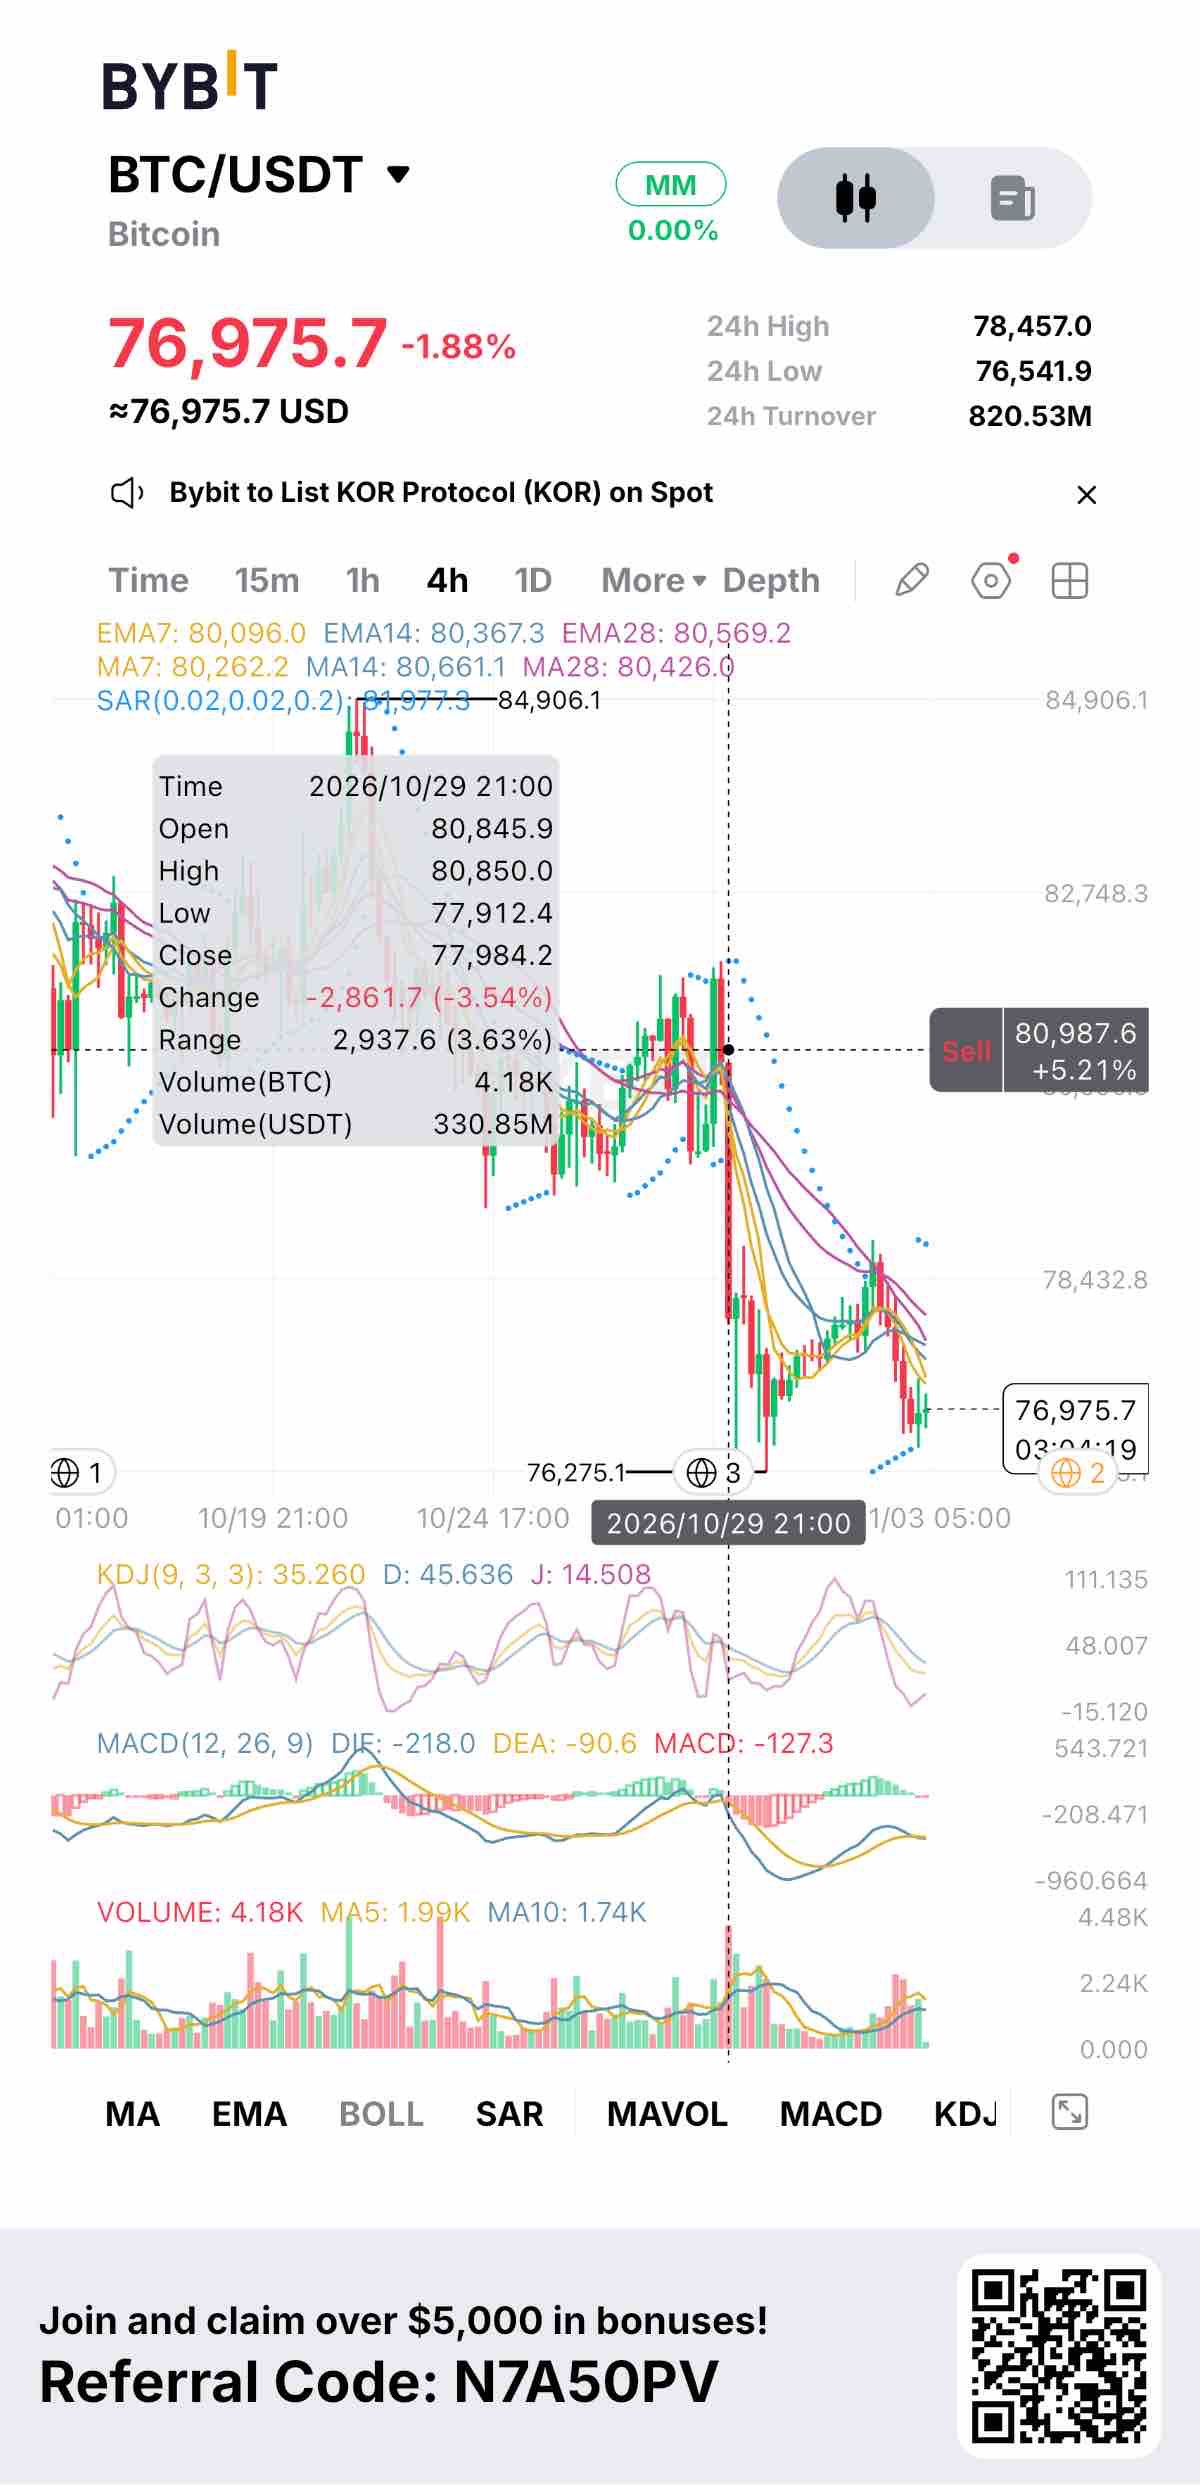
The scary part of the Binance story is over, and the market still hasn't relaxed. Withdrawals reopened over the weekend, about $3.6 billion left in the first nine and a half hours, and nothing broke. Daily net outflows have since eased from a peak near $7 billion to about $3.5 billion, and Binance says it has restored 95% of the affected assets. Access isn't the question anymore. Talos data showed Binance's BTC order-book depth dropped by roughly 30% at one point, which tells you market makers are still being careful, and the exchange is now paying higher rebates to coax them back. The sharper signal is in the ETF numbers. On October 30, the first session after the hack, spot Bitcoin ETFs lost $643 million, the largest daily outflow since June, led by IBIT and FBTC. Laevitas points out that's under 1% of total assets, so it reads as caution, not exodus. Ether is the weaker of the two. ETH ETFs lost a record $1.61 billion in October and have now seen five straight weeks of withdrawals. In the October 26-30 week alone, Ether funds shed about $431 million against roughly $203 million for Bitcoin. BlackRock's ETHA fell from $9.9 billion to $6.9 billion in assets over the month, part outflows and part lower price. ETH sits near $2,250, and its recovery has no institutional bid behind it yet. For Bitcoin, one level matters more than the rest: $76,000, the average cost basis of short-term holders. It's where recent buyers break even, and price has been leaning on it. A close below puts $73,000-$74,000 in view, and one analyst cites $60,000 as the bearish extreme. The upside has resistance at $78,500, then $80,000. The calendar is crowded. U.S. midterm elections are today, the jobs report lands Friday, and Binance's proof-of-reserves updates are still rolling out. Fear & Greed dropped to 26 from 37 in a day. My read is that the access panic is behind us and the demand problem isn't. Until ETF flows turn, rallies look like relief, not conviction. This is analysis, not financial advice. $BTCUSDT #ByXIMPACT $ETHUSDT
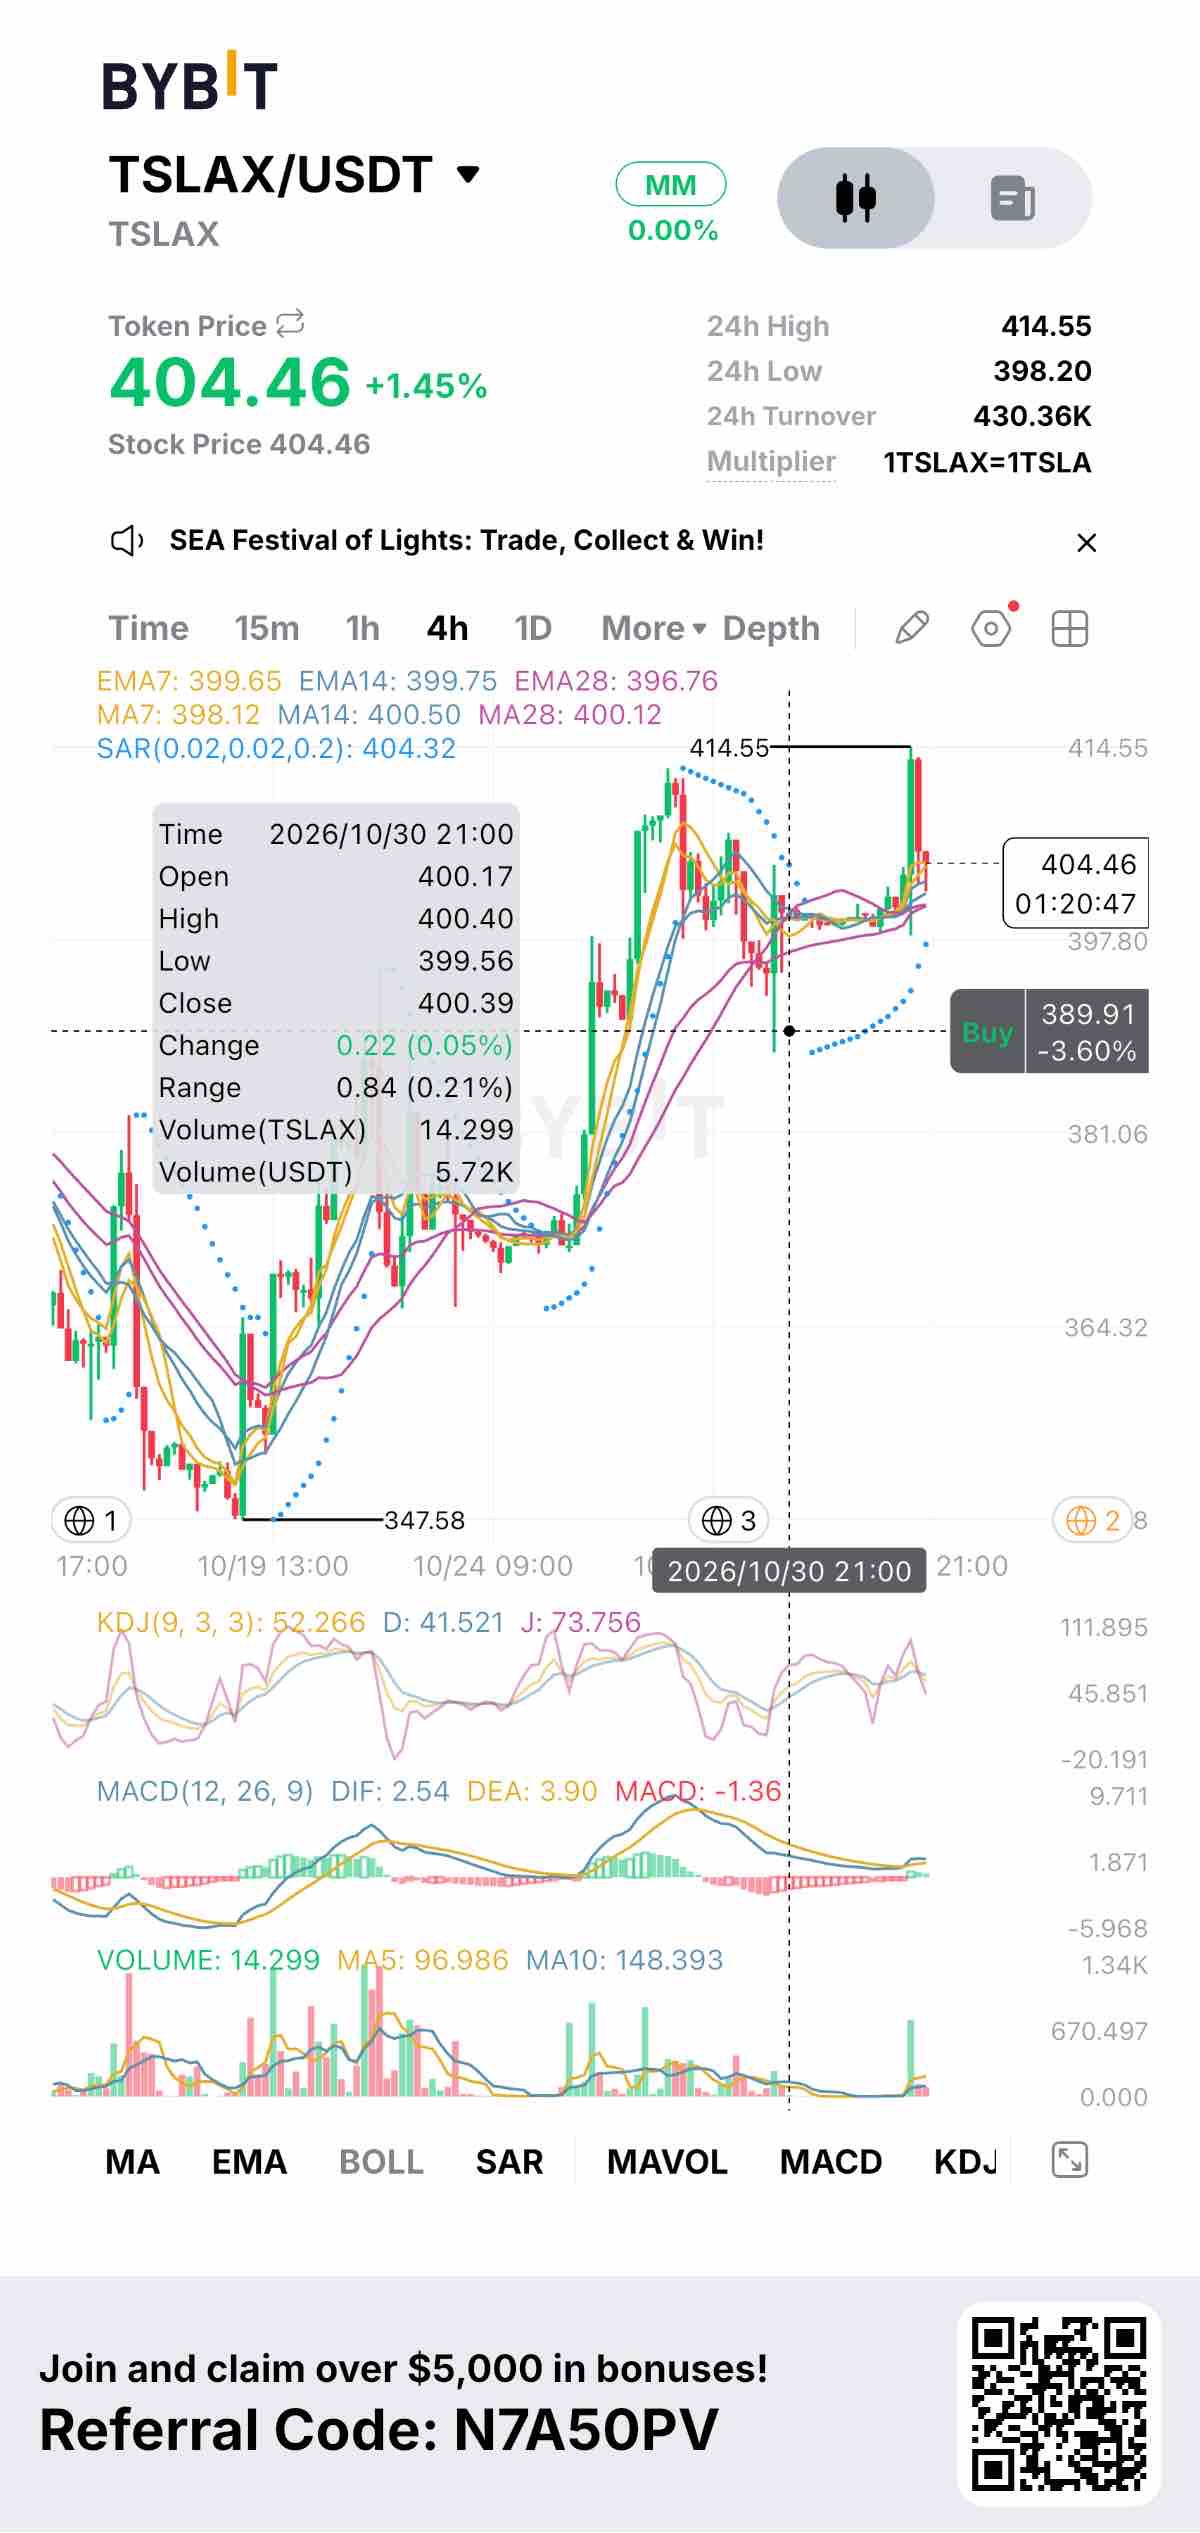
Tesla jumped to about $414 early today and had faded to the low $400s by afternoon, and the headline most people are using for it, Europe's October registrations, is the smaller part of the story. The numbers are real. Registrations rose 248% in Sweden, 131% in Norway, 34% in Denmark and 271% in Spain. But Reuters calls the recovery uneven, and the details support that. In Denmark, Tesla's share is only 0.73%, behind BYD, Leapmotor, Xpeng and MG. Portugal and Italy saw 412 and 497 cars. Big percentages from a small base aren't the same as a turnaround. The story with more weight is the SpaceX merger. On October 20, Musk confirmed that special committees of independent directors at both companies are studying a combination. There are no terms, no price and no date. The vote math is steep too: Tesla would need approval from 50% of all shares, roughly 1.98 billion yes votes, which Musk himself called quite a high hurdle. Kalshi traders priced a deal above 50% for early 2027, and Barclays thinks an announcement could come before the December 3 annual meeting. Gary Black's caution is worth reading carefully. In large all-stock deals with long timelines, he notes, traders tend to sell the acquirer's shares. He cites the market reaction to Marvell's Lumentum purchase and expects SpaceX to pay Tesla holders a 20-25% premium. Whether that's good for Tesla shareholders depends on the price, which nobody has seen. Underneath the headlines, the business has real questions. Capex guidance was cut to about $20 billion from over $25 billion, still more than double last year's $8.5 billion. NHTSA is still reviewing Cybercab certification, U.S. EV share is slipping and Chinese rivals posted strong October sales. On the other side, the Texas robotaxi fleet is up 128% in about a month and Barclays upgraded the stock with a $450 target. Friday also showed resilience, with Tesla down 0.87% while the Nasdaq fell 2.86%. On the 4-hour chart, the stock rallied about 19% from $347.58, then hit roughly $413-$415 twice and was rejected both times. Support sits near $398, with $381 below that. If you trade the tokenized version, TSLAX, the market is thin, about $430,000 in daily turnover. A merger would change what you own, and the terms aren't known yet. This is analysis, not financial advice. #ByXIMPACT $TSLAXUSDT
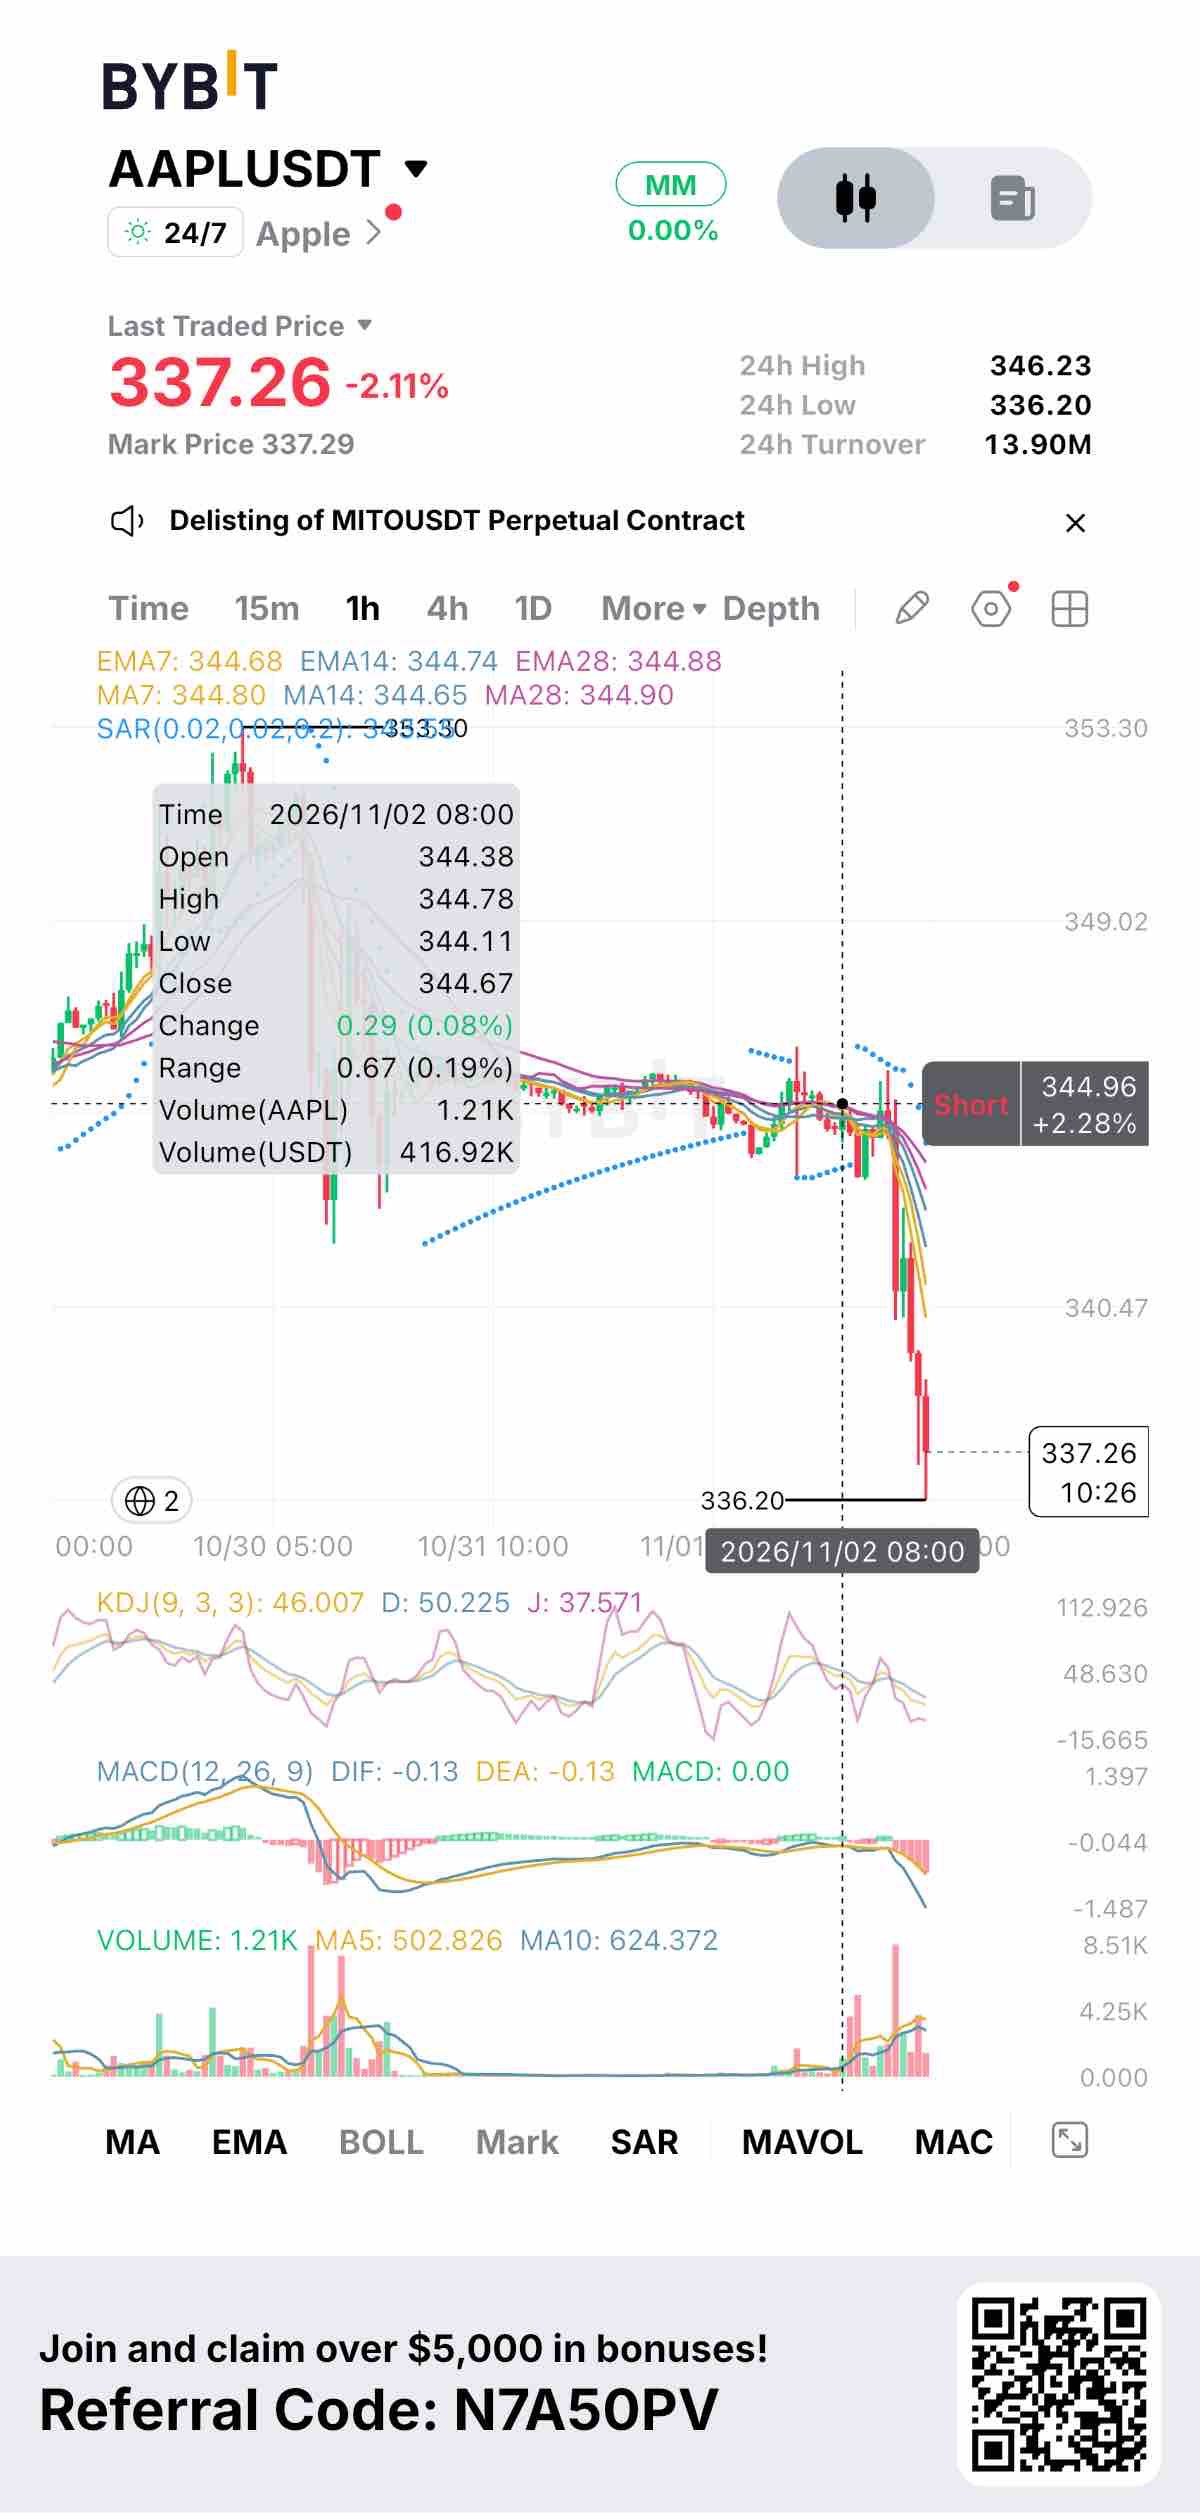
The bell hasn't rung, but AAPL/USDT is already bleeding. Traditional traders are stuck waiting for the market open. But if you're trading the tokenized pair on Bybit, you just watched the 1H chart break its back—slicing straight through the 7, 14, and 28 EMAs clustered at $344.80 to test $336. The market is aggressively de-risking hours before the Q4 print. Here is the reality of what’s happening under the hood: The Margin Squeeze Nobody is Pricing In Wall Street is obsessed with whether Apple hits $113.4B in revenue. But the real bogeyman is the 150 basis point hit to product gross margins. Surging DRAM and NAND prices are squeezing Apple from the inside. New CEO John Ternus has to convince the room that pricing power can offset this. If he doesn't, the "safe haven" narrative dies today. The Valuation Trap Let’s be real: Apple is trading at the top of its 15-year forward P/E range. At a $5T market cap, there is zero room for a miss. Oppenheimer is already flashing warnings that slowing iPhone growth and Services headwinds could keep FY2027 EPS below consensus. This isn't a setup for a "relief rally"—it's a setup for a violent reaction either way. Why the Tokenized Pair Matters Unlike traditional equities, you don’t have to sit on your hands. The 24/7 nature of AAPL/USDT means you can trade the breakdown in real-time. · The Trapdoor: If 316 . · The Squeeze: Bulls need a decisive reclaim of 346 to invalidate this bearish momentum and target the ATH at $351.73. The options market is pricing a ~4.25% move. With 10x leverage available on this pair, gap risk can liquidate you in seconds if you're overexposed. I’m watching the $335 defense closely. Are you fading the breakdown, or waiting for the earnings dust to settle? Disclaimer: This is for informational purposes only. Tokenized equities carry high volatility and gap risk. Always do your own research. #ByXIMPACT $AAPLXUSDT
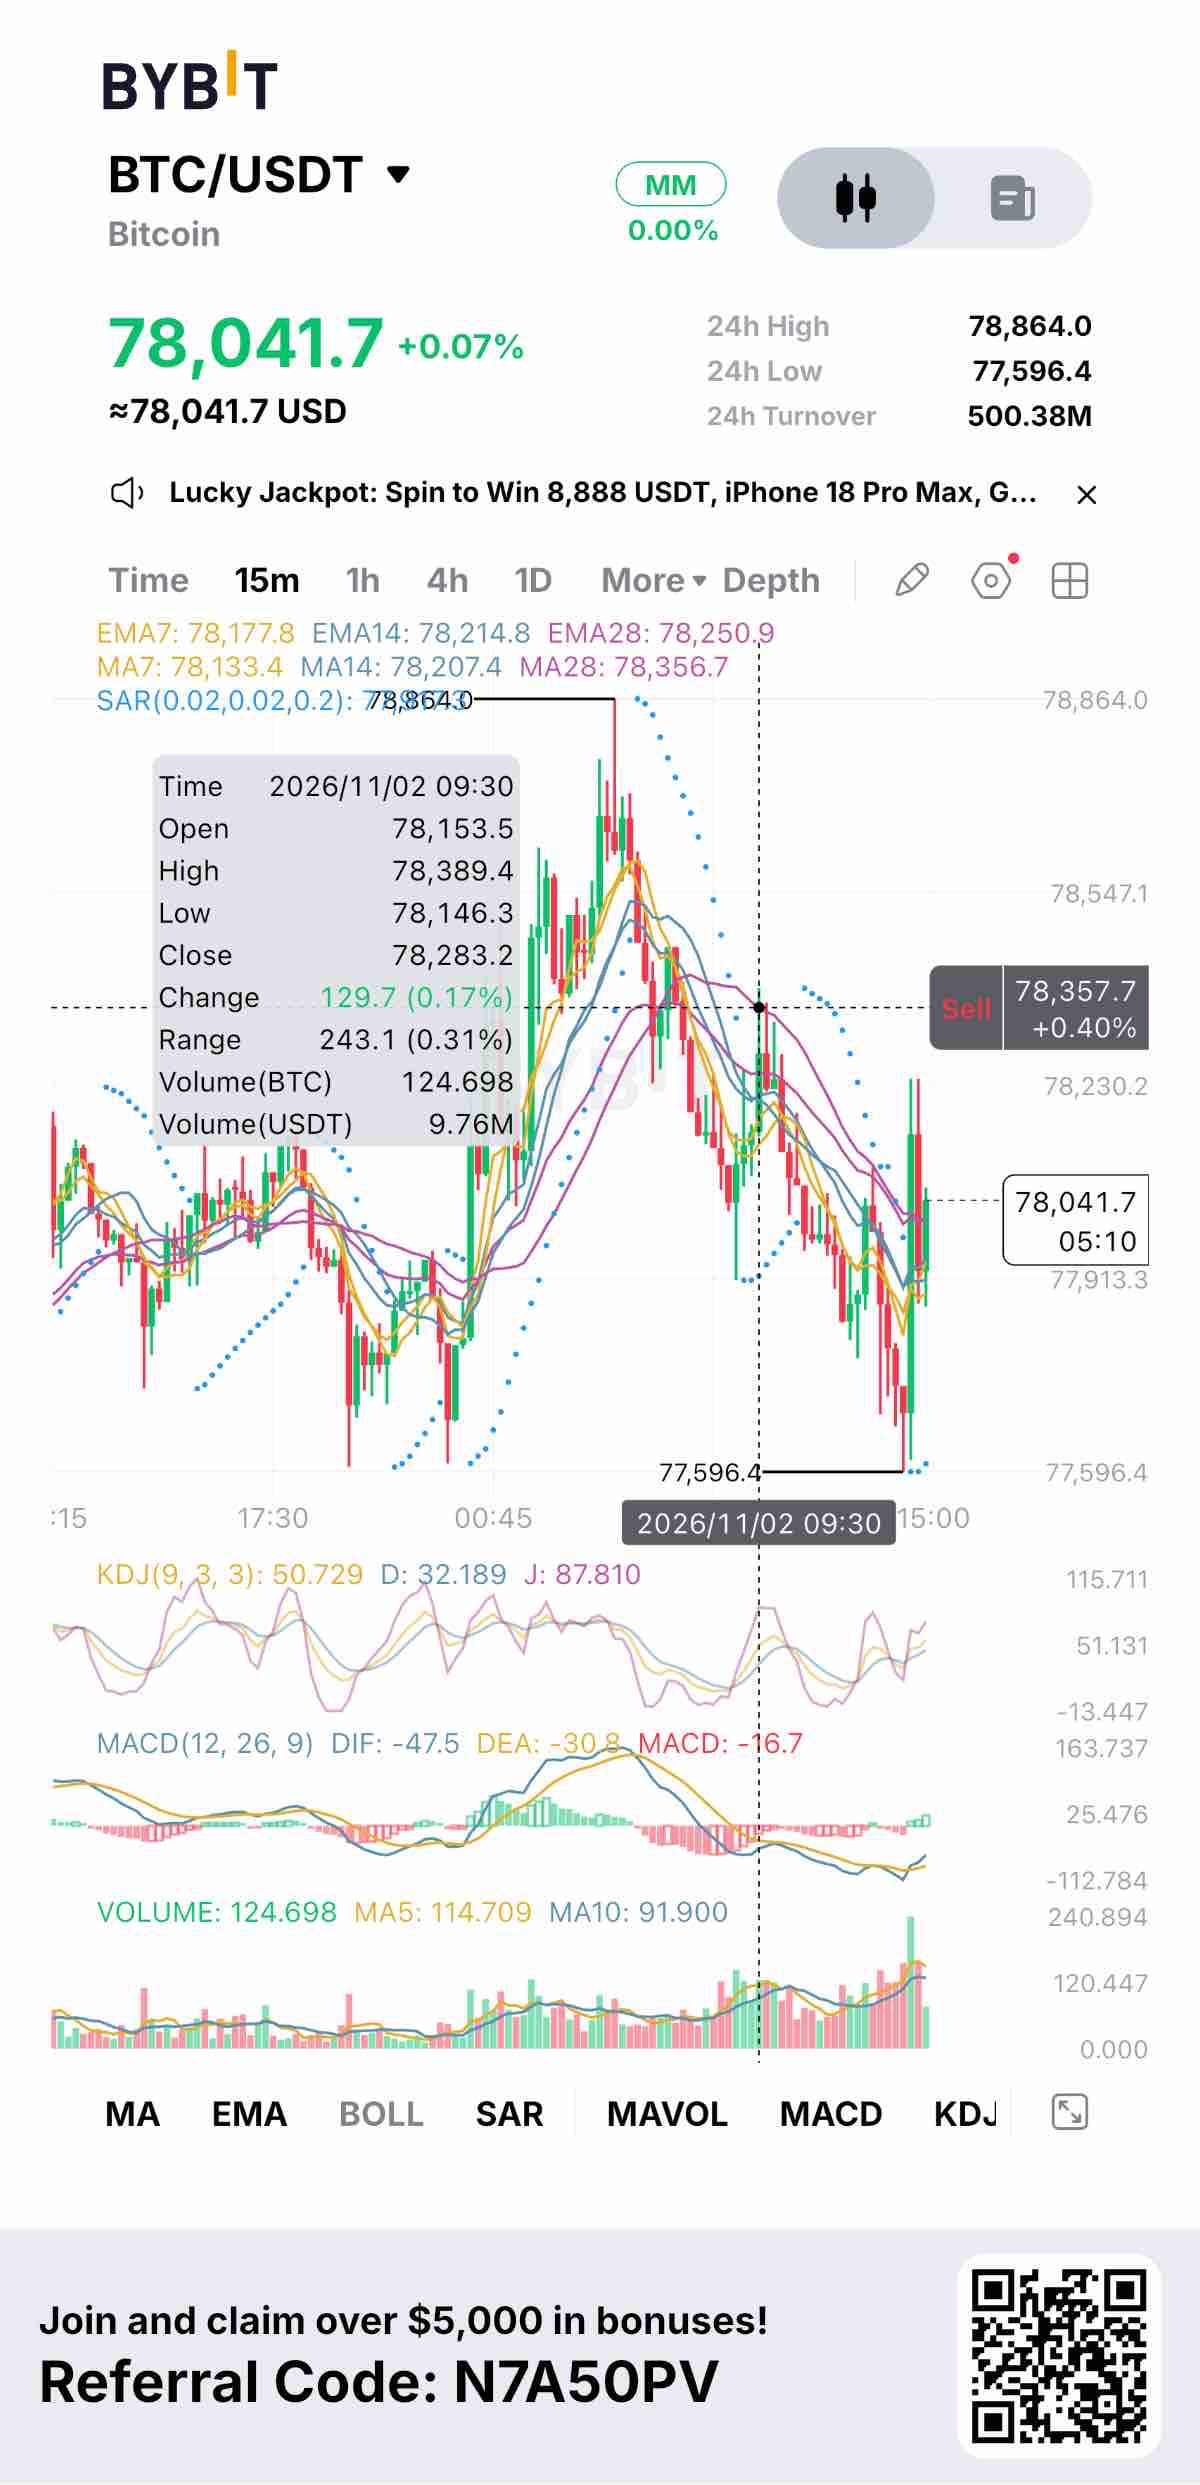
Bitcoin is being squeezed, and the squeeze is unusually tight. For three days it has traded between roughly 77.3k and 78.9k, and it now sits about 0.35% above the 100-day EMA, with the 20 and 50-day EMAs about 2.7% overhead near 80.2k. There's very little room on either side. The most useful candle on the 15m chart is the latest one. A slide to 77,596 ended in a large green reversal on the heaviest volume of the session, so someone wanted that level. The bounce hasn't gone far, though. The 78.25k-78.36k cluster of short averages is still above price, and MACD is only starting to hook up from below zero. Look at what price has absorbed. Binance customers pulled a net $3.64B on reopening day, and a separate wave of hot-wallet drains on older BTCPay servers followed. Neither is a Bitcoin protocol problem, but both are bad headlines, and price barely moved. The demand underneath it isn't from the funds, either. US spot ETFs just posted their first monthly outflow since June, about $515M. Fear & Greed has only recovered to 37. Tomorrow's midterms, Apple's report after the close, and Friday's jobs data are all close enough to break a range this narrow. My stance: I'm not trading inside it. A clean push through 78.9k with volume puts 79.2k and then 80.2k in play. Losing 77.6k opens 77k and the 200-day EMA at 76.46k. Until one of those happens, the range is the trade $BTCUSDT #ByXIMPACT
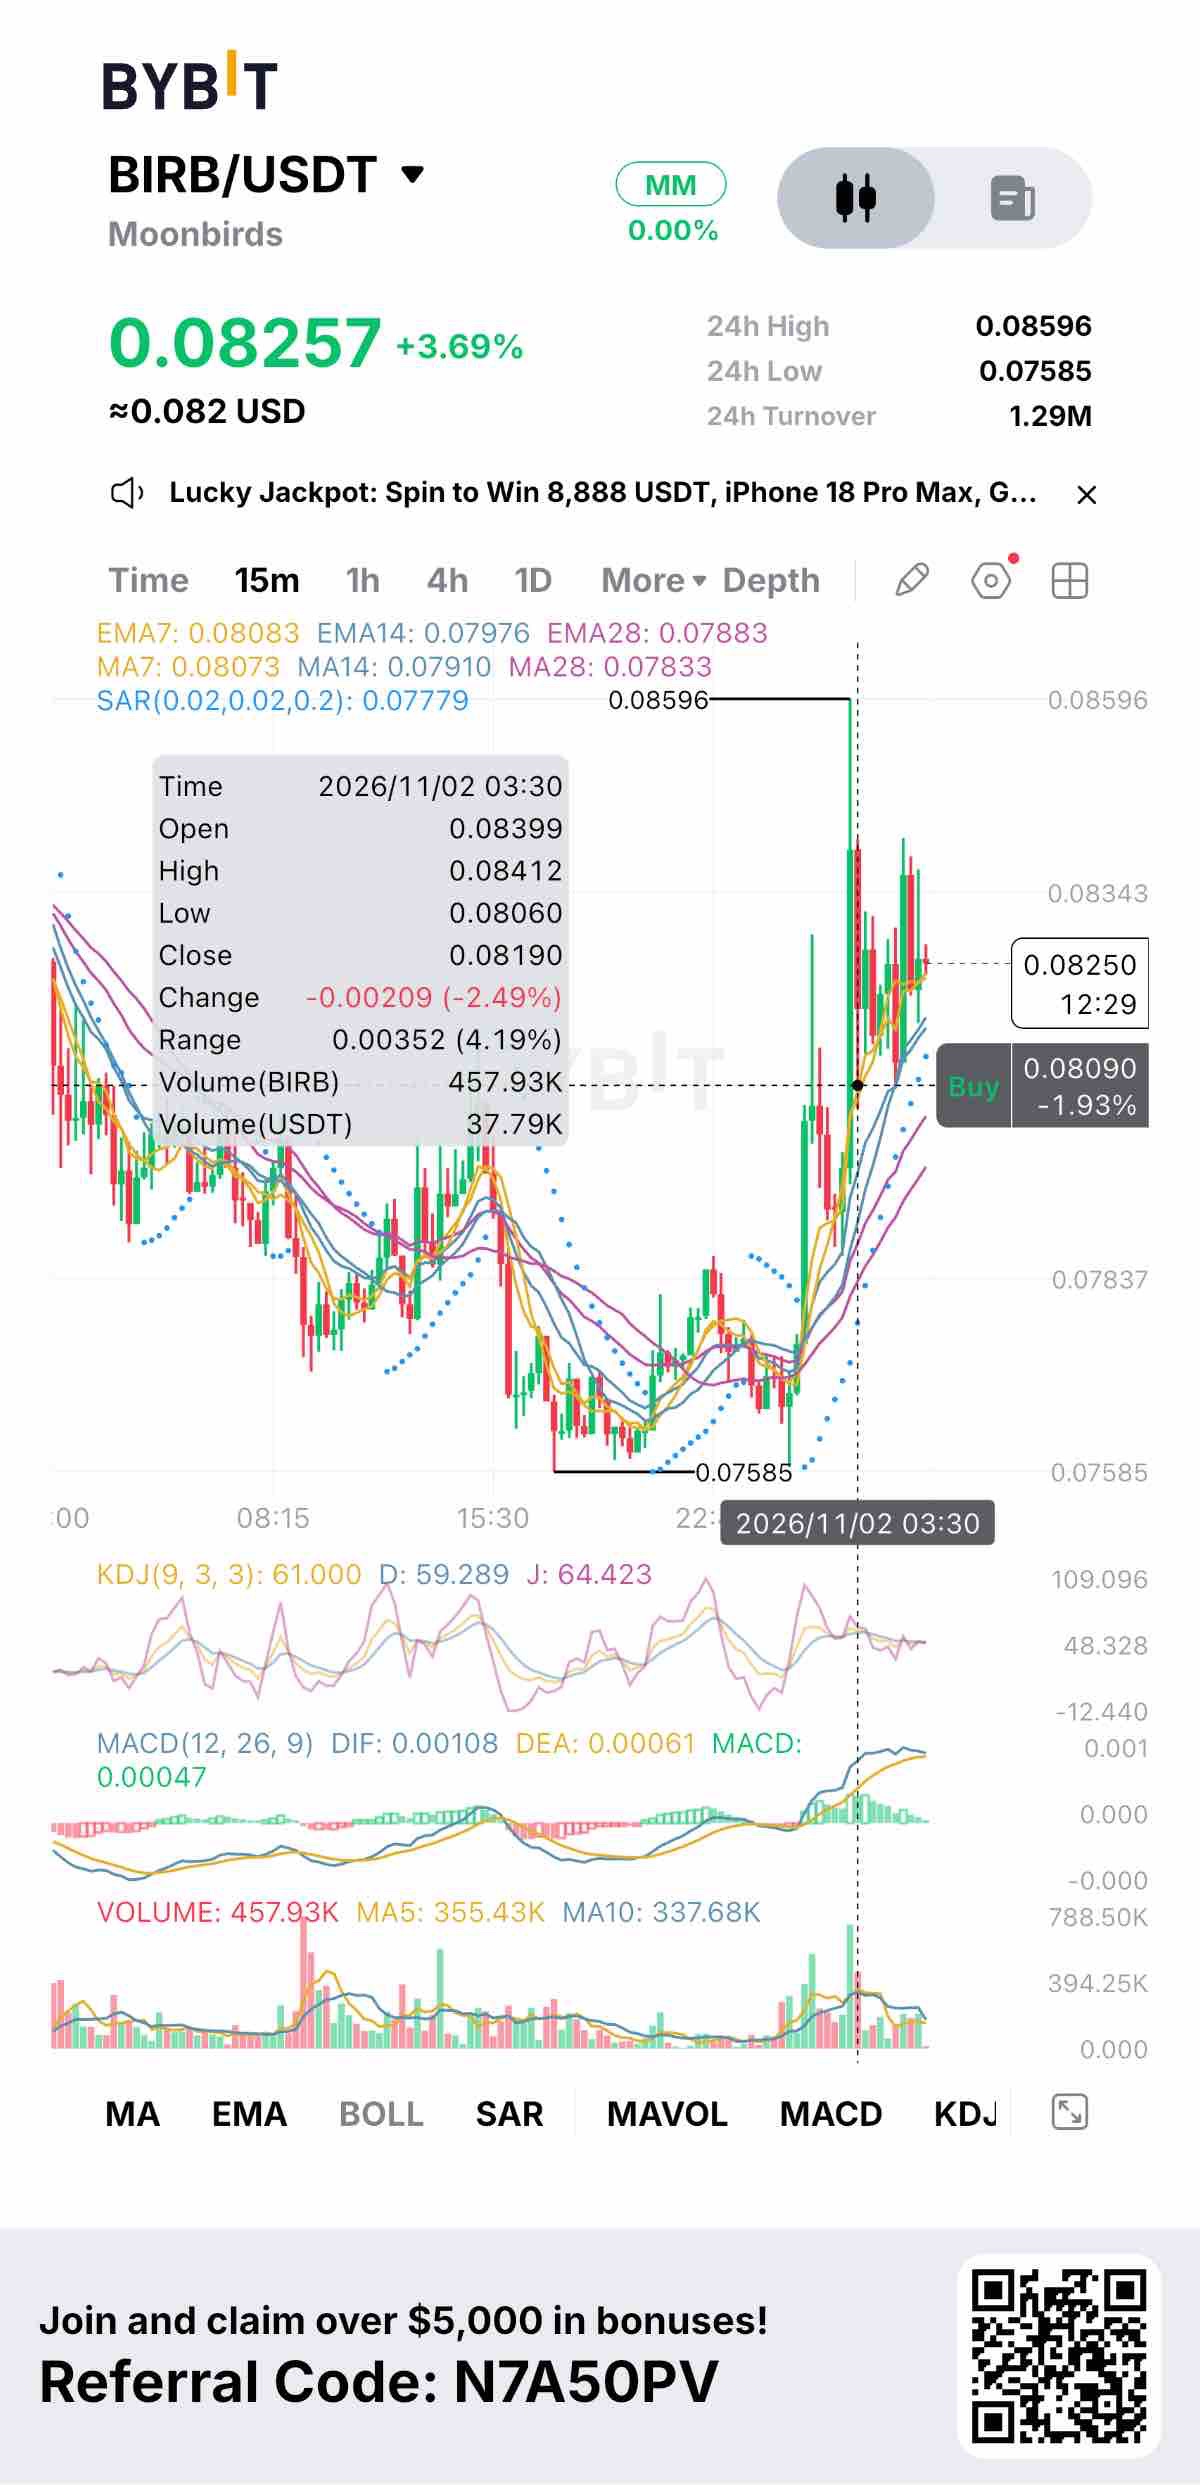
BIRB is up about 3.7% today, and I couldn't find a single announcement behind it. That's worth saying plainly, because the token has had a real run since mid-October. It was around $0.0465 on October 18, spiked toward $0.087 at the end of the month, slid back to about $0.076, and is now bouncing near $0.083. The only thing that lines up in time is a rally in gaming tokens like BEAM, so sympathy buying is a fair guess, but it's a guess. What matters more is the calendar. Most of the circulating story here is an airdrop to Moonbirds NFT holders that unlocks in 24 equal monthly installments on the 28th. The October 28 unlock was the tenth by my count, and the next is November 28. Only about 28.5% of the 1 billion supply is circulating, so unlocks keep arriving whether or not demand does. The price history gives that overhang some context. BIRB peaked at $0.506 on February 3, and even after this month's run it sits roughly 84% below that high. It's also about 84% above its low of $0.045. Both numbers are true at once, which is a fair description of how volatile it has been. The market around it is thin. Daily volume on Bybit is about $1.3 million against a market cap near $23 million, and Coinbase suspended BIRB perpetual futures in August. Orange Cap Games, the company behind Moonbirds, has talked about becoming the "Pop Mart of web3" with consumer products and a trading-card game. That's an ambitious plan, but I found nothing saying token holders have a claim on the company's revenue. On the 15-minute chart, price is working inside a $0.0759 to $0.0860 range. The short-term averages are stacked upward and the parabolic SAR sits below price, but momentum is already shrinking. A break above $0.086 would put the $0.087 spike highs back in play, and a loss of $0.0759 points toward $0.075. A token with a known unlock date 26 days away, no clear driver today, and liquidity thin enough to move on small orders. Worth knowing before you treat the bounce as a trend. This is analysis, not financial advice. $BIRBUSDT #ByXIMPACT
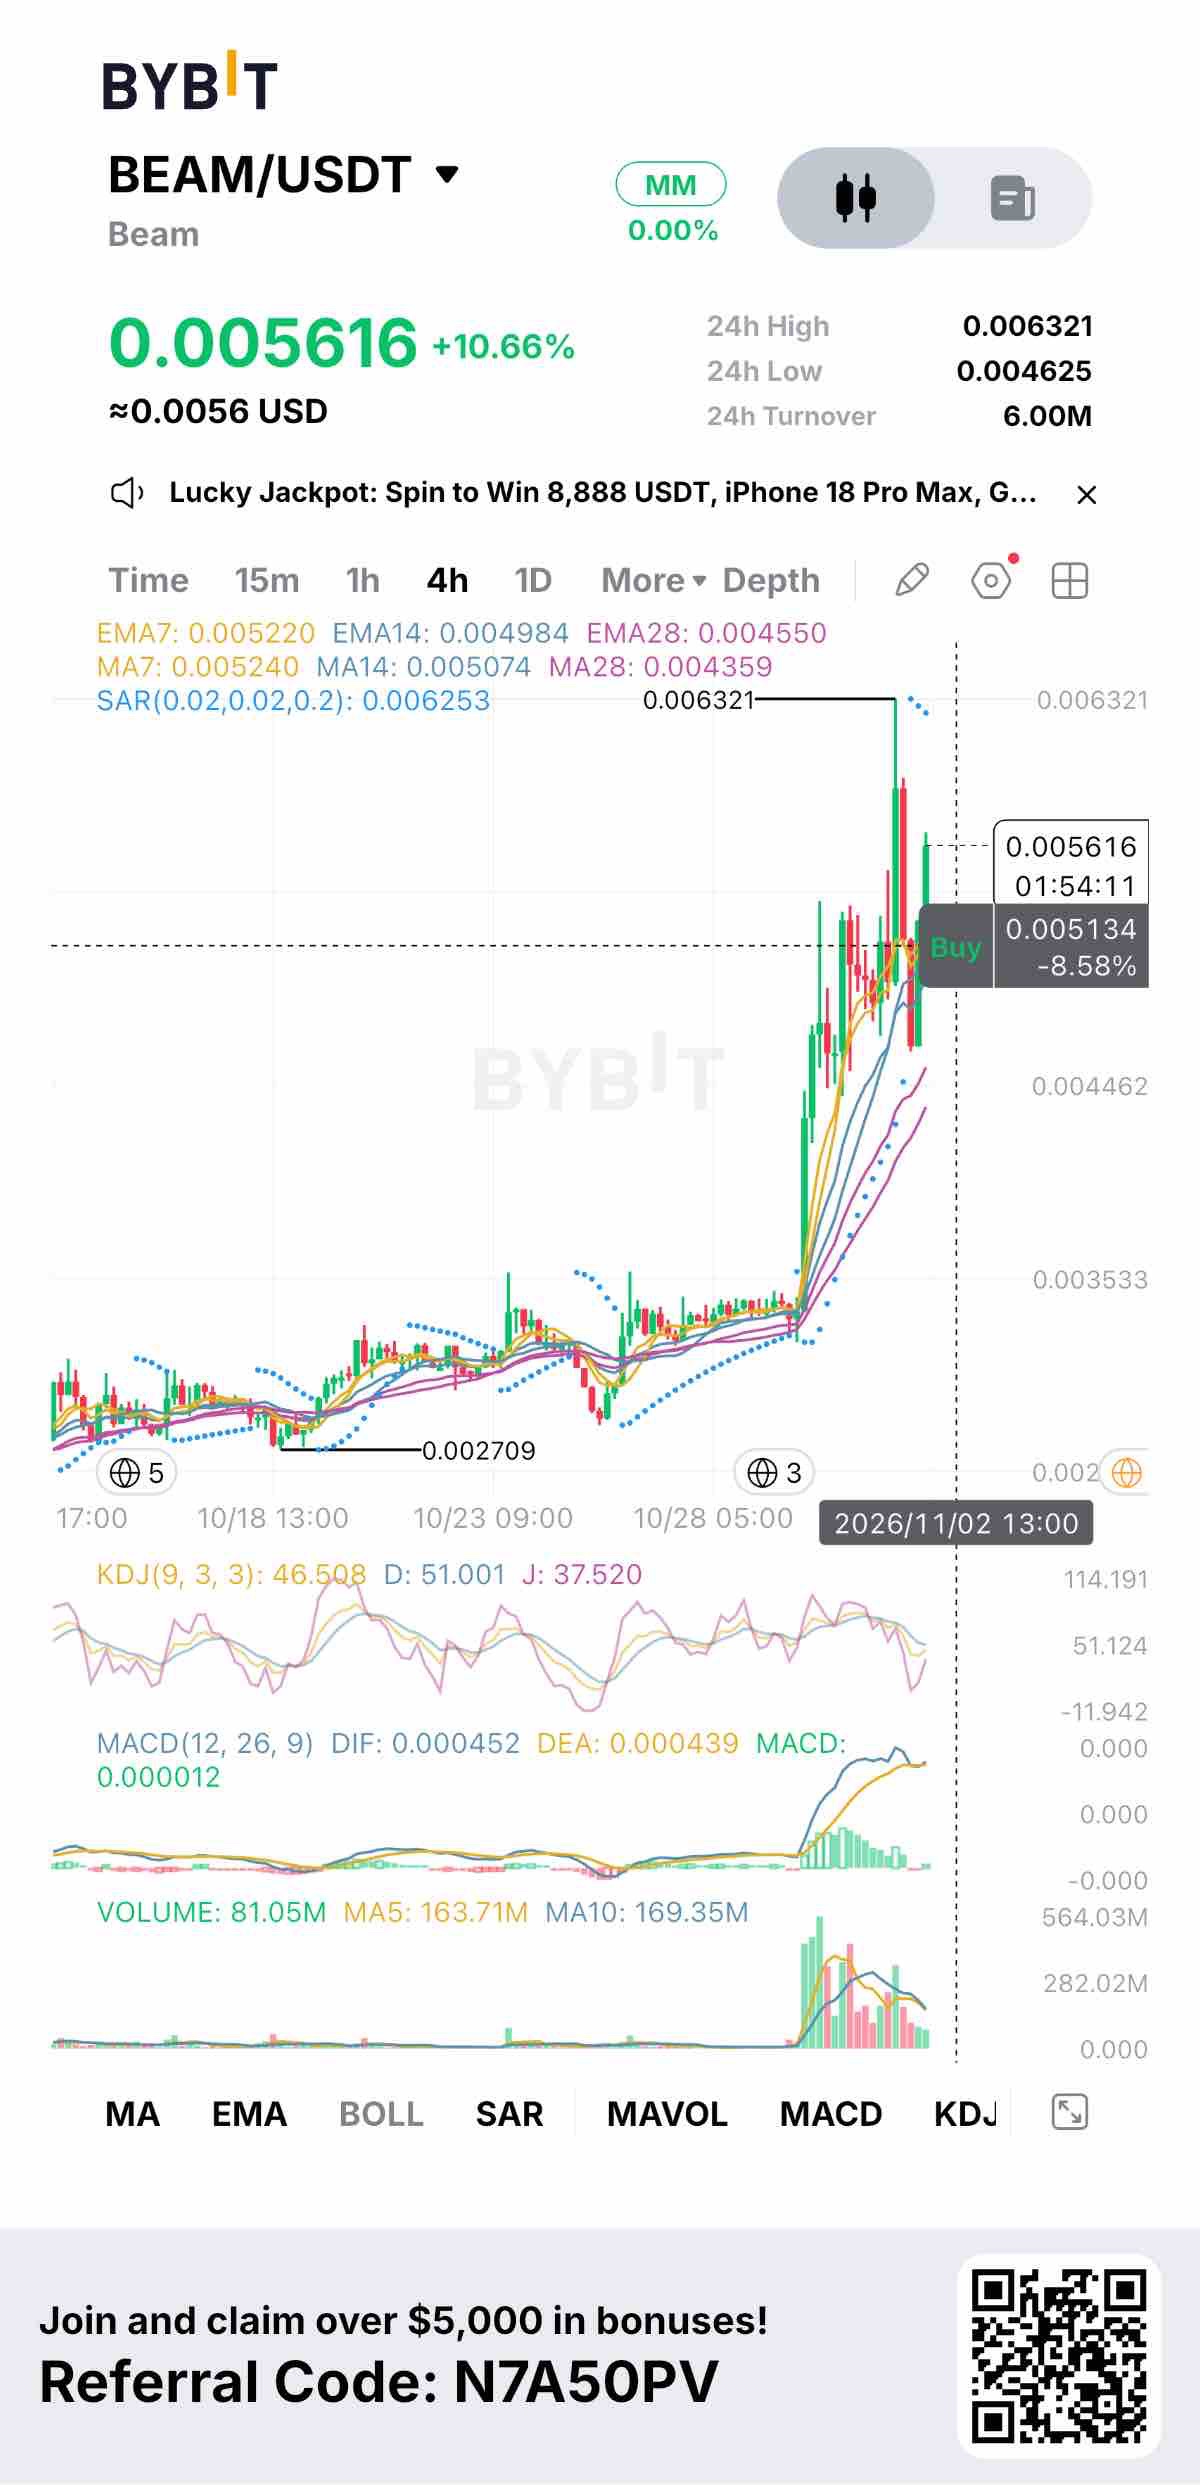
Most tokens fell when the Binance hack broke. BEAM went up more than 40%, and the reason is a decision, not a rumor. The Beam Foundation froze and burned about 984 million BEAM that had ended up in the hacker's wallets, roughly $3.4 million at the time, which stopped them from selling into the market. The volume tells you how big the reaction was. Trading jumped by more than 1,000%, to around $170 million in a day, and about $57 million of it came through Upbit's BEAM/KRW pair. Korean retail flow did a lot of the lifting. Market cap went from about $240 million to roughly $275 million at today's price, and the token is still up about 11% today after a week that was already up 50-60%. It helps that BEAM wasn't starting from nowhere. It had been trending higher since June, and the team has been repositioning it from a gaming chain into a broader platform spanning gaming, AI, DeFi and compute. The burn gave an existing trend a clear trigger. One thing about that trigger deserves attention. The burn worked because the team can remotely freeze and burn tokens, which is useful when a thief is holding them, but it also means the team has powers over holder balances. That's my inference from how the move was reported, not something Beam has stated. It's worth knowing before you decide how much trust to put in the token. The chart is where I'd slow down. On the 4-hour view, price spiked to $0.006321, pulled back toward $0.0047-$0.0050 and has bounced to $0.0056. But volume is already about half its recent average, momentum is flat, and the parabolic SAR has flipped above price, a short-term cooldown signal. Support sits at $0.0046, then $0.0030. A move back to $0.0030 would be roughly a 47% drop from here. A one-time catalyst, a fading volume profile and a token up over 60% in a week. The setup is real, but chasing it isn't the same as understanding it. This is analysis, not financial advice. #ByXIMPACT $BEAMUSDT
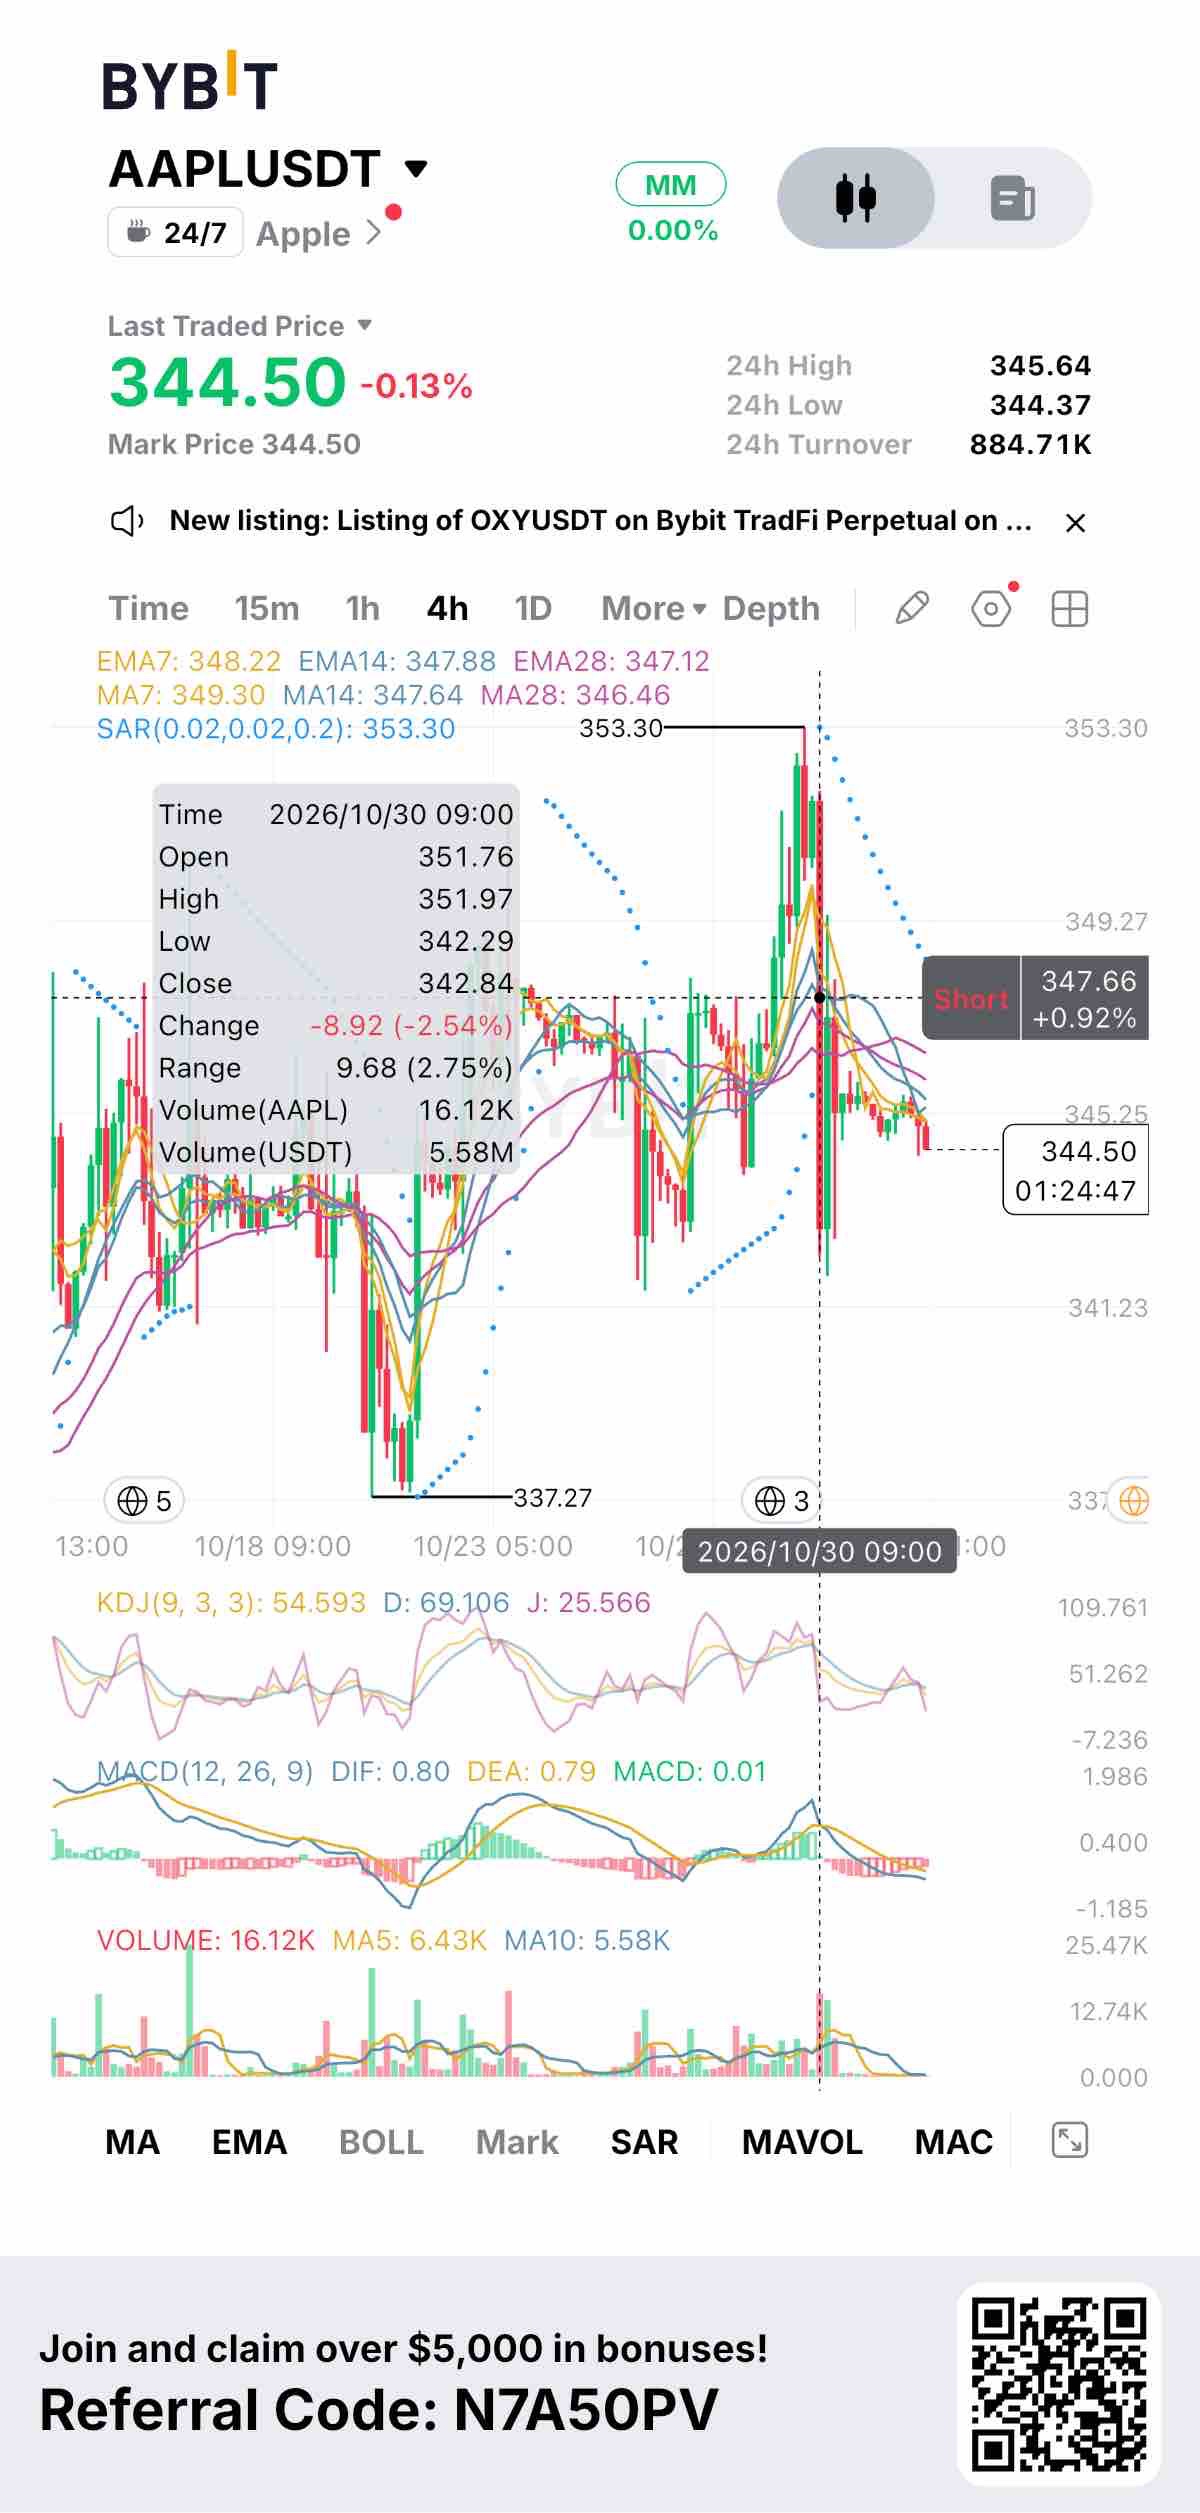
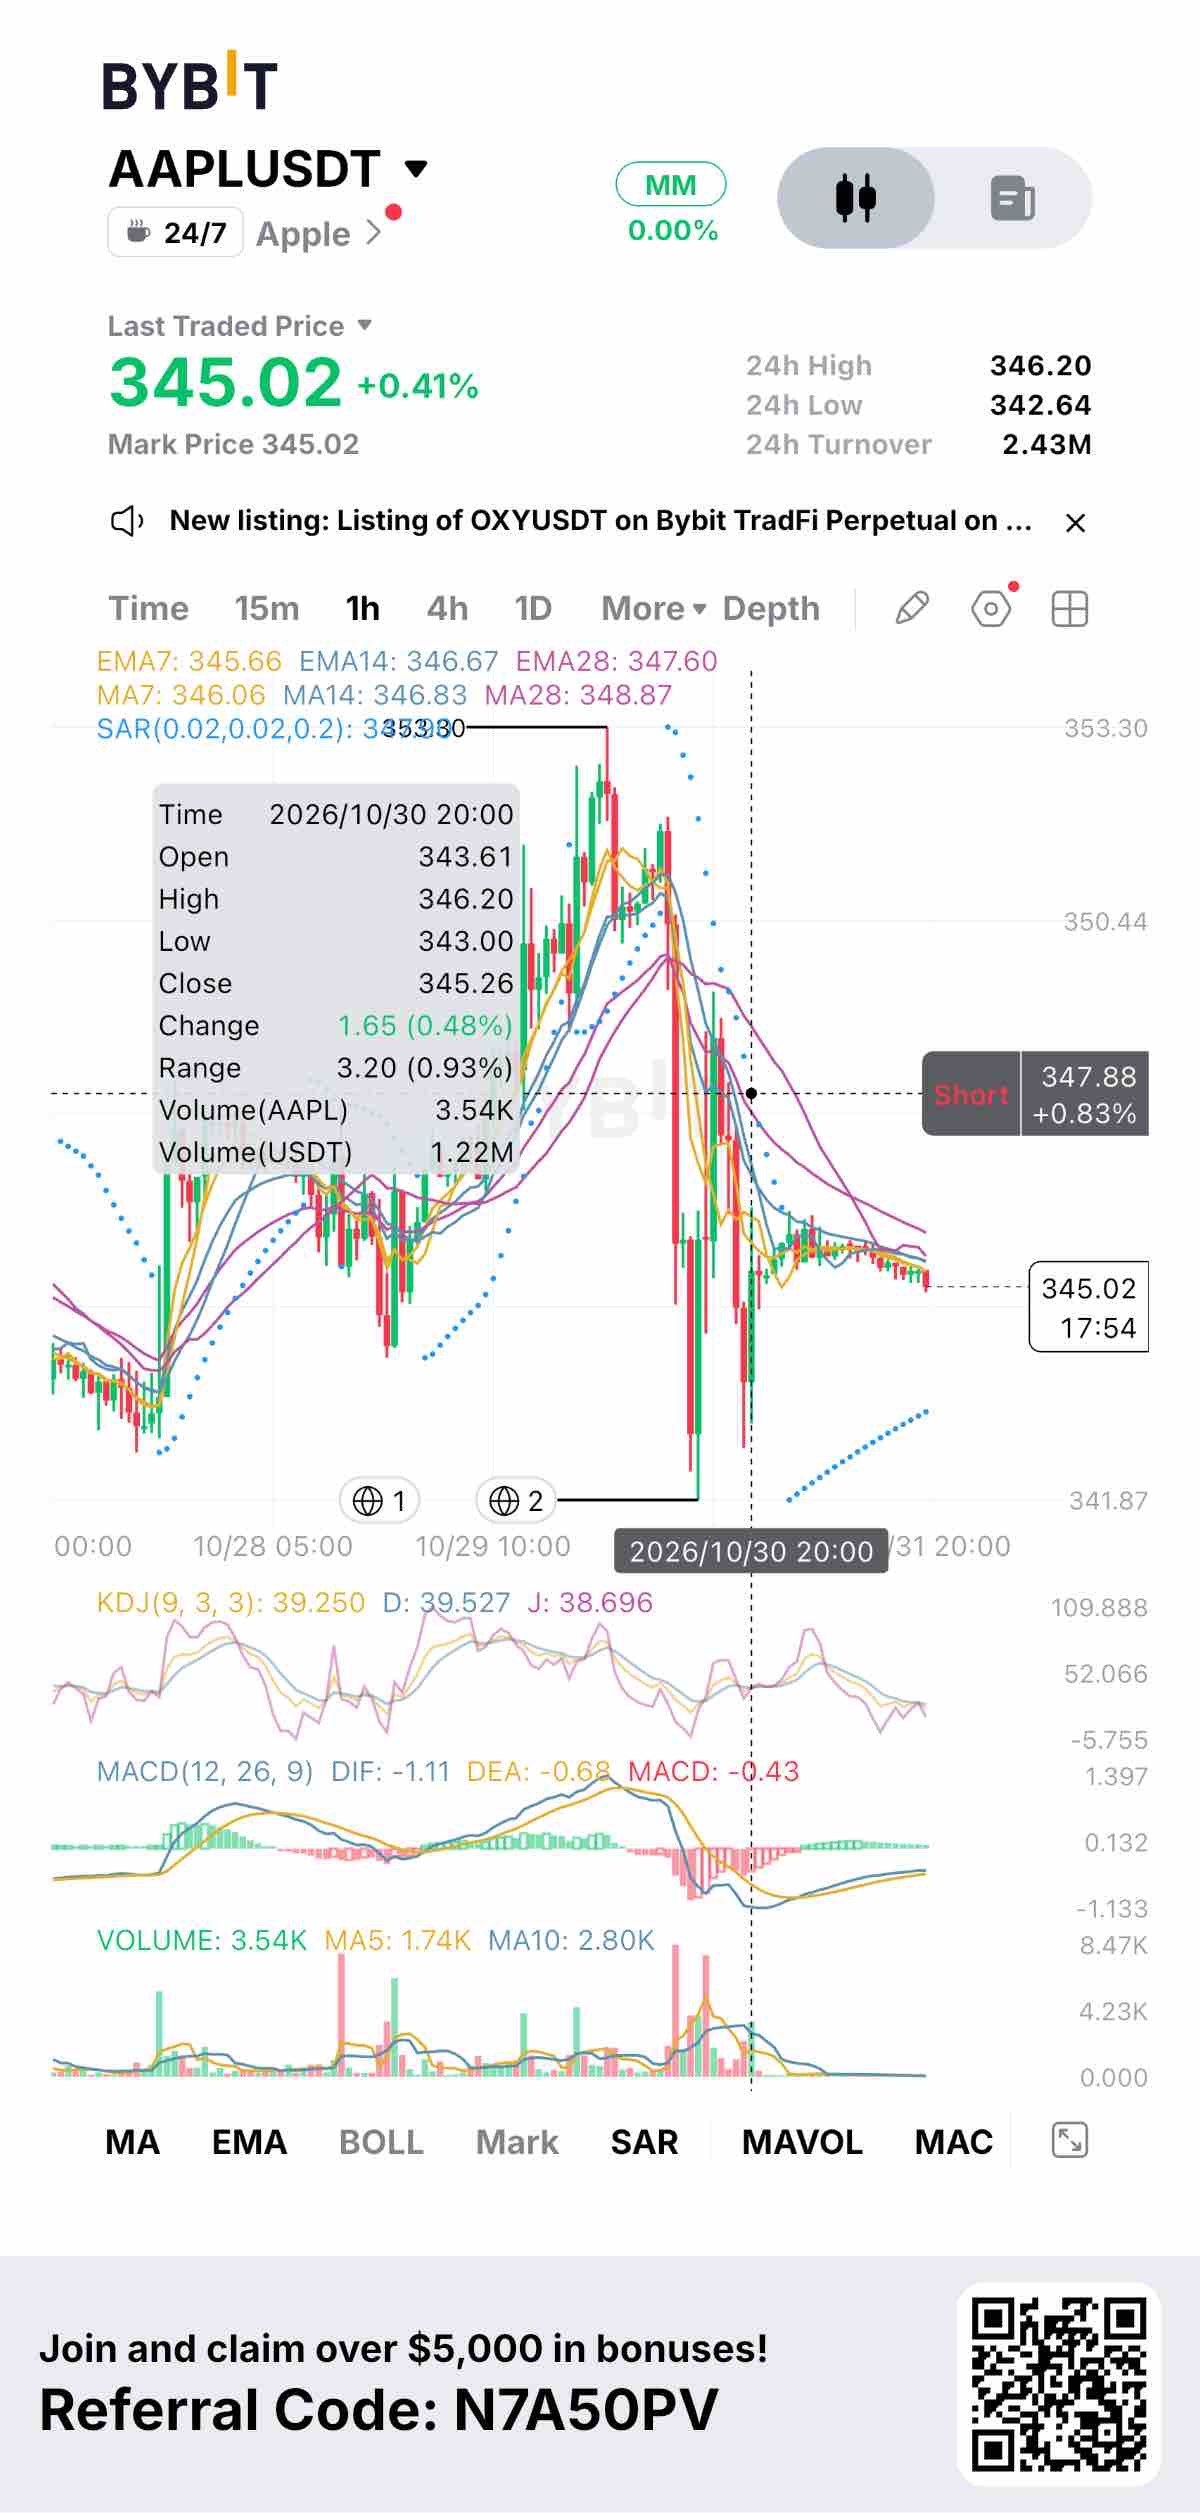
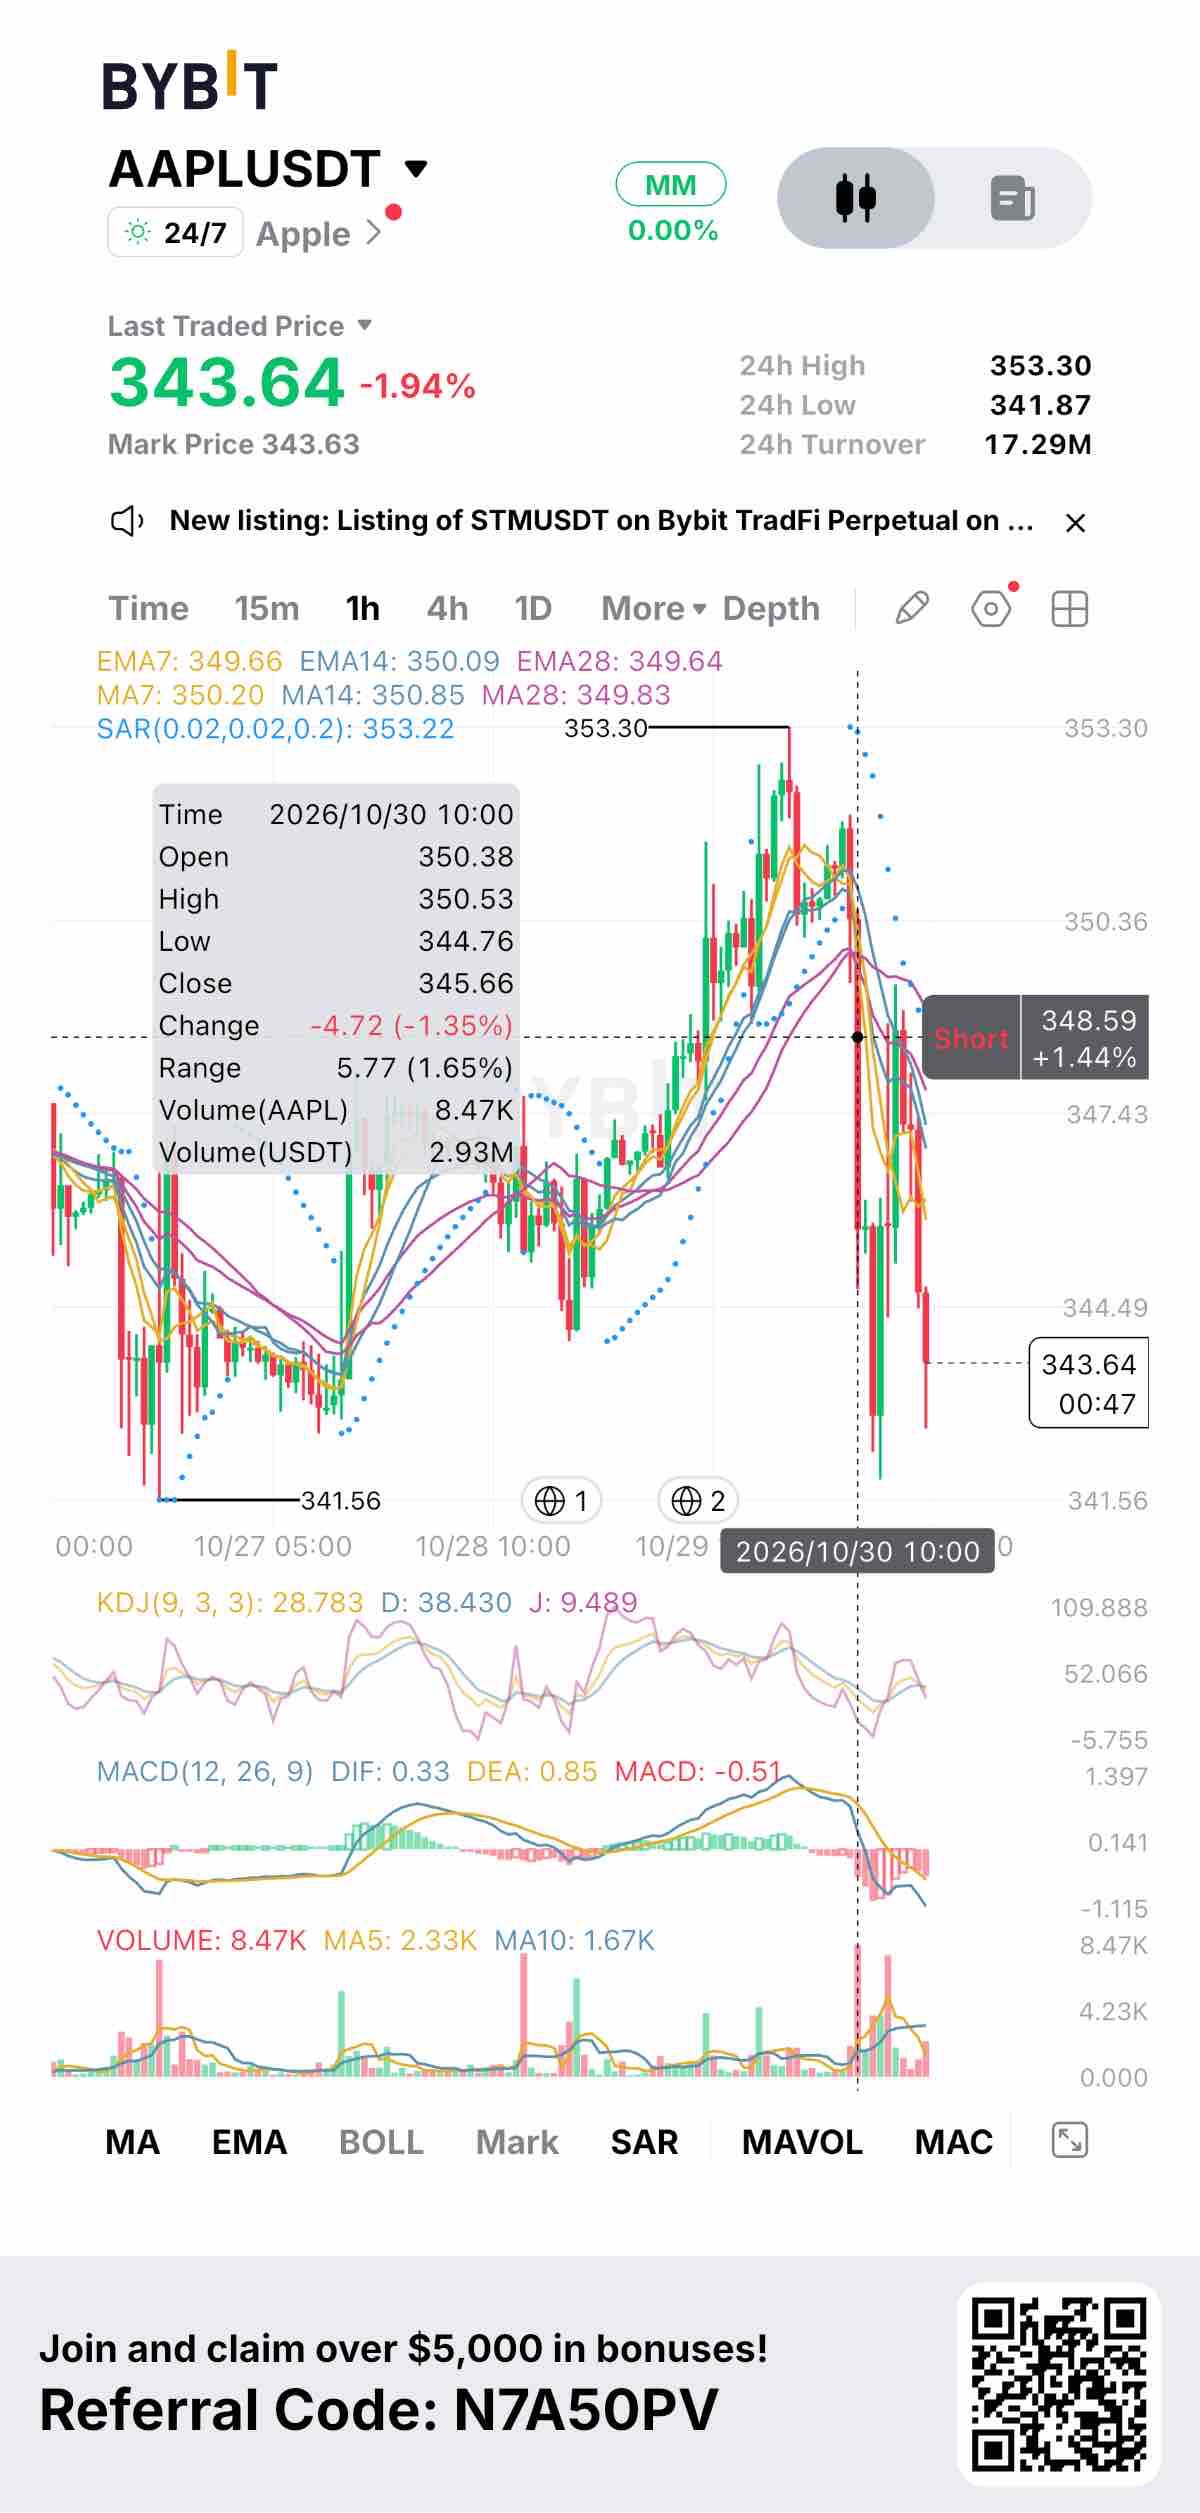
Apple has been the market's quiet refuge this week, and that is what makes tomorrow's report harder. On Oct 30 the Nasdaq fell close to 3% and tech lost more than 4% as Amazon, Alphabet and Intel turned AI spending into a question about returns. Apple slipped only 1.2% while Nvidia dropped 4.2%, and Apple's $5.03T market cap moved ahead of Nvidia's for the first time since late July. The reason is simple. Apple has spent far less on AI infrastructure, so money leaving the heaviest spenders had somewhere to go. The tension is the price. At more than 37x forward earnings and just under its record, Apple is already charging for that safety. The average analyst target sits slightly below the stock, rising memory costs are a margin risk, and last quarter Apple beat estimates and still fell about 7% the next day. Options imply roughly a 4% move either way, so a beat alone may not be enough. Guidance on margins and the holiday quarter probably matters more. On the 4h chart, the perp ran to 353.30, flushed to 342.29 as the Big Tech earnings hit, and now sits at 344.50 under all the moving averages in an unusually quiet weekend range. SAR is above price and MACD is rolling over. That's a market waiting for a catalyst. Because this trades around the clock, Bybit will react to Monday's after-close release before the cash market does, and thin liquidity can exaggerate that first move. 345.6 and the 347-349 average cluster are the first hurdles. Below 342.3, the 337 low is next. #ByXIMPACT $AAPLXUSDT
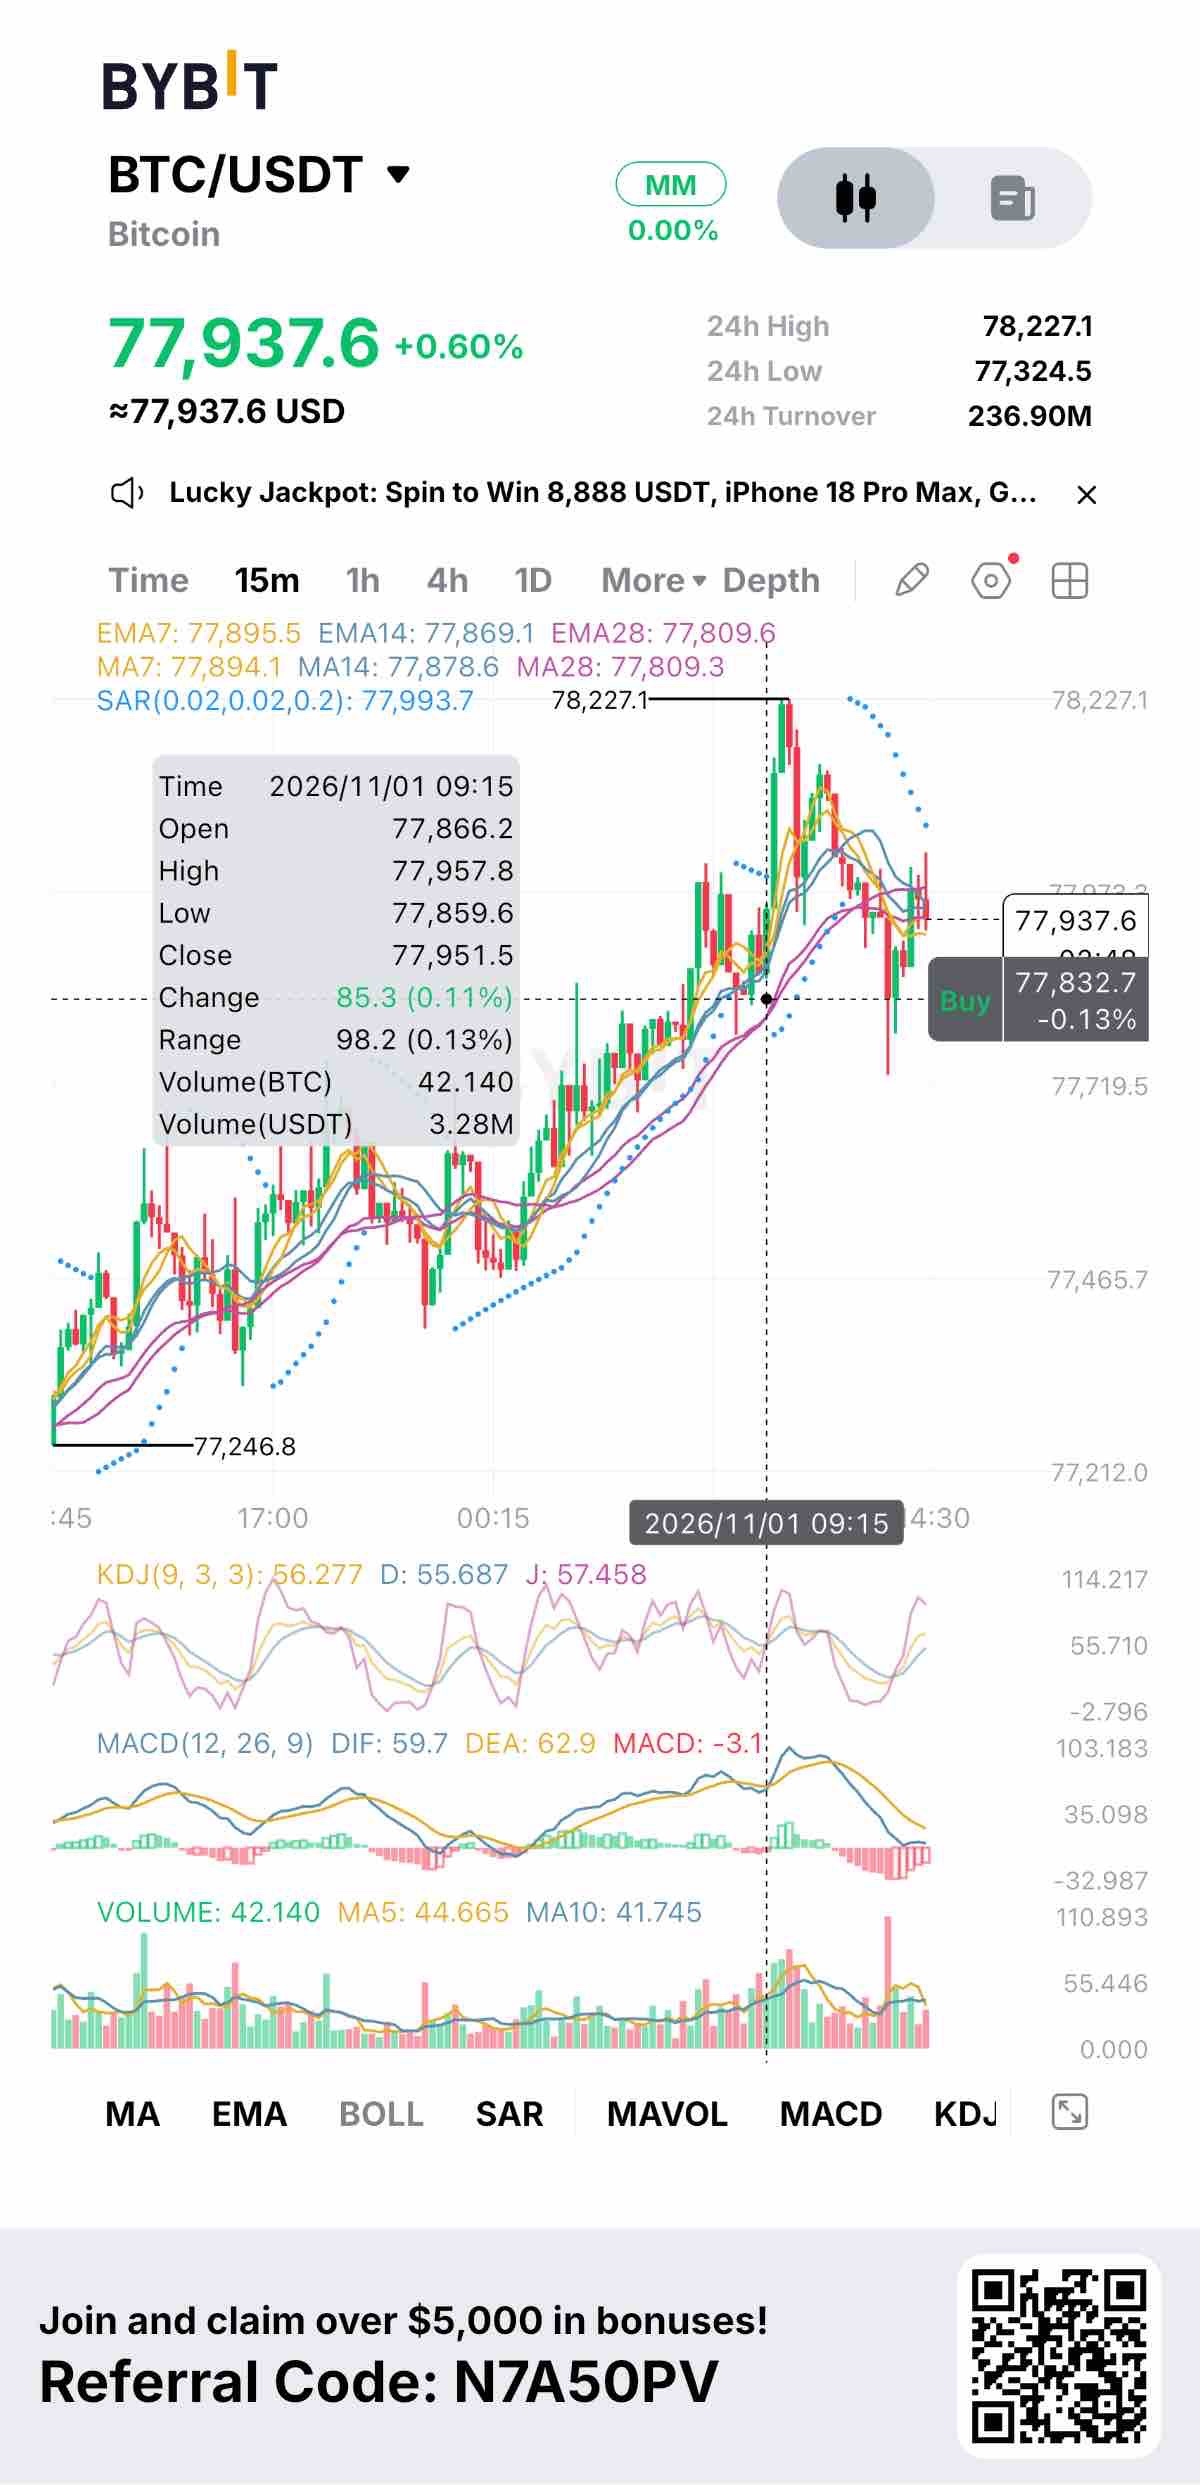
The most telling thing about Binance reopening withdrawals is how little BTC cared. This was the week's biggest confidence event, and it's being resolved faster than most expected. Withdrawals are returning in phases, with Bitcoin first, and Binance says about 95% of the losses are already covered from reserves. Yet price sits near 77.9k, roughly 5% below where it traded before the hack. A relief rally that doesn't show up often means the hack was never the only weight on the market. The ETF data points the same way. Four straight days of inflows were erased in a single session on Friday, with $643M leaving, the largest daily outflow since June. BlackRock's fund still added $932M in October, but the rest of the complex lost about $1.45B. Demand is concentrating in one product while the broader base thins, and BTC is still trading under the ETF holders' cost basis. On the 15m chart, the weekend climb to 78,227 has already cooled into a tight range around 77.9k. SAR has flipped above price and the MACD histogram is turning negative. The dip to 77.7k was bought quickly, so buyers are defending it, but they aren't pushing. The calendar doesn't help: midterms on Nov 3, jobs on the 6th, CPI on the 10th, and no Fed meeting to cushion any of it. I'd treat 77.3k as the line that matters. Losing it brings the 76.1k-76.5k hack low back into view. A clean reclaim of 78.2k, ideally with ETF inflows returning, would be the first sign this is more than a weekend bounce. $BTCUSDT #ByXIMPACT
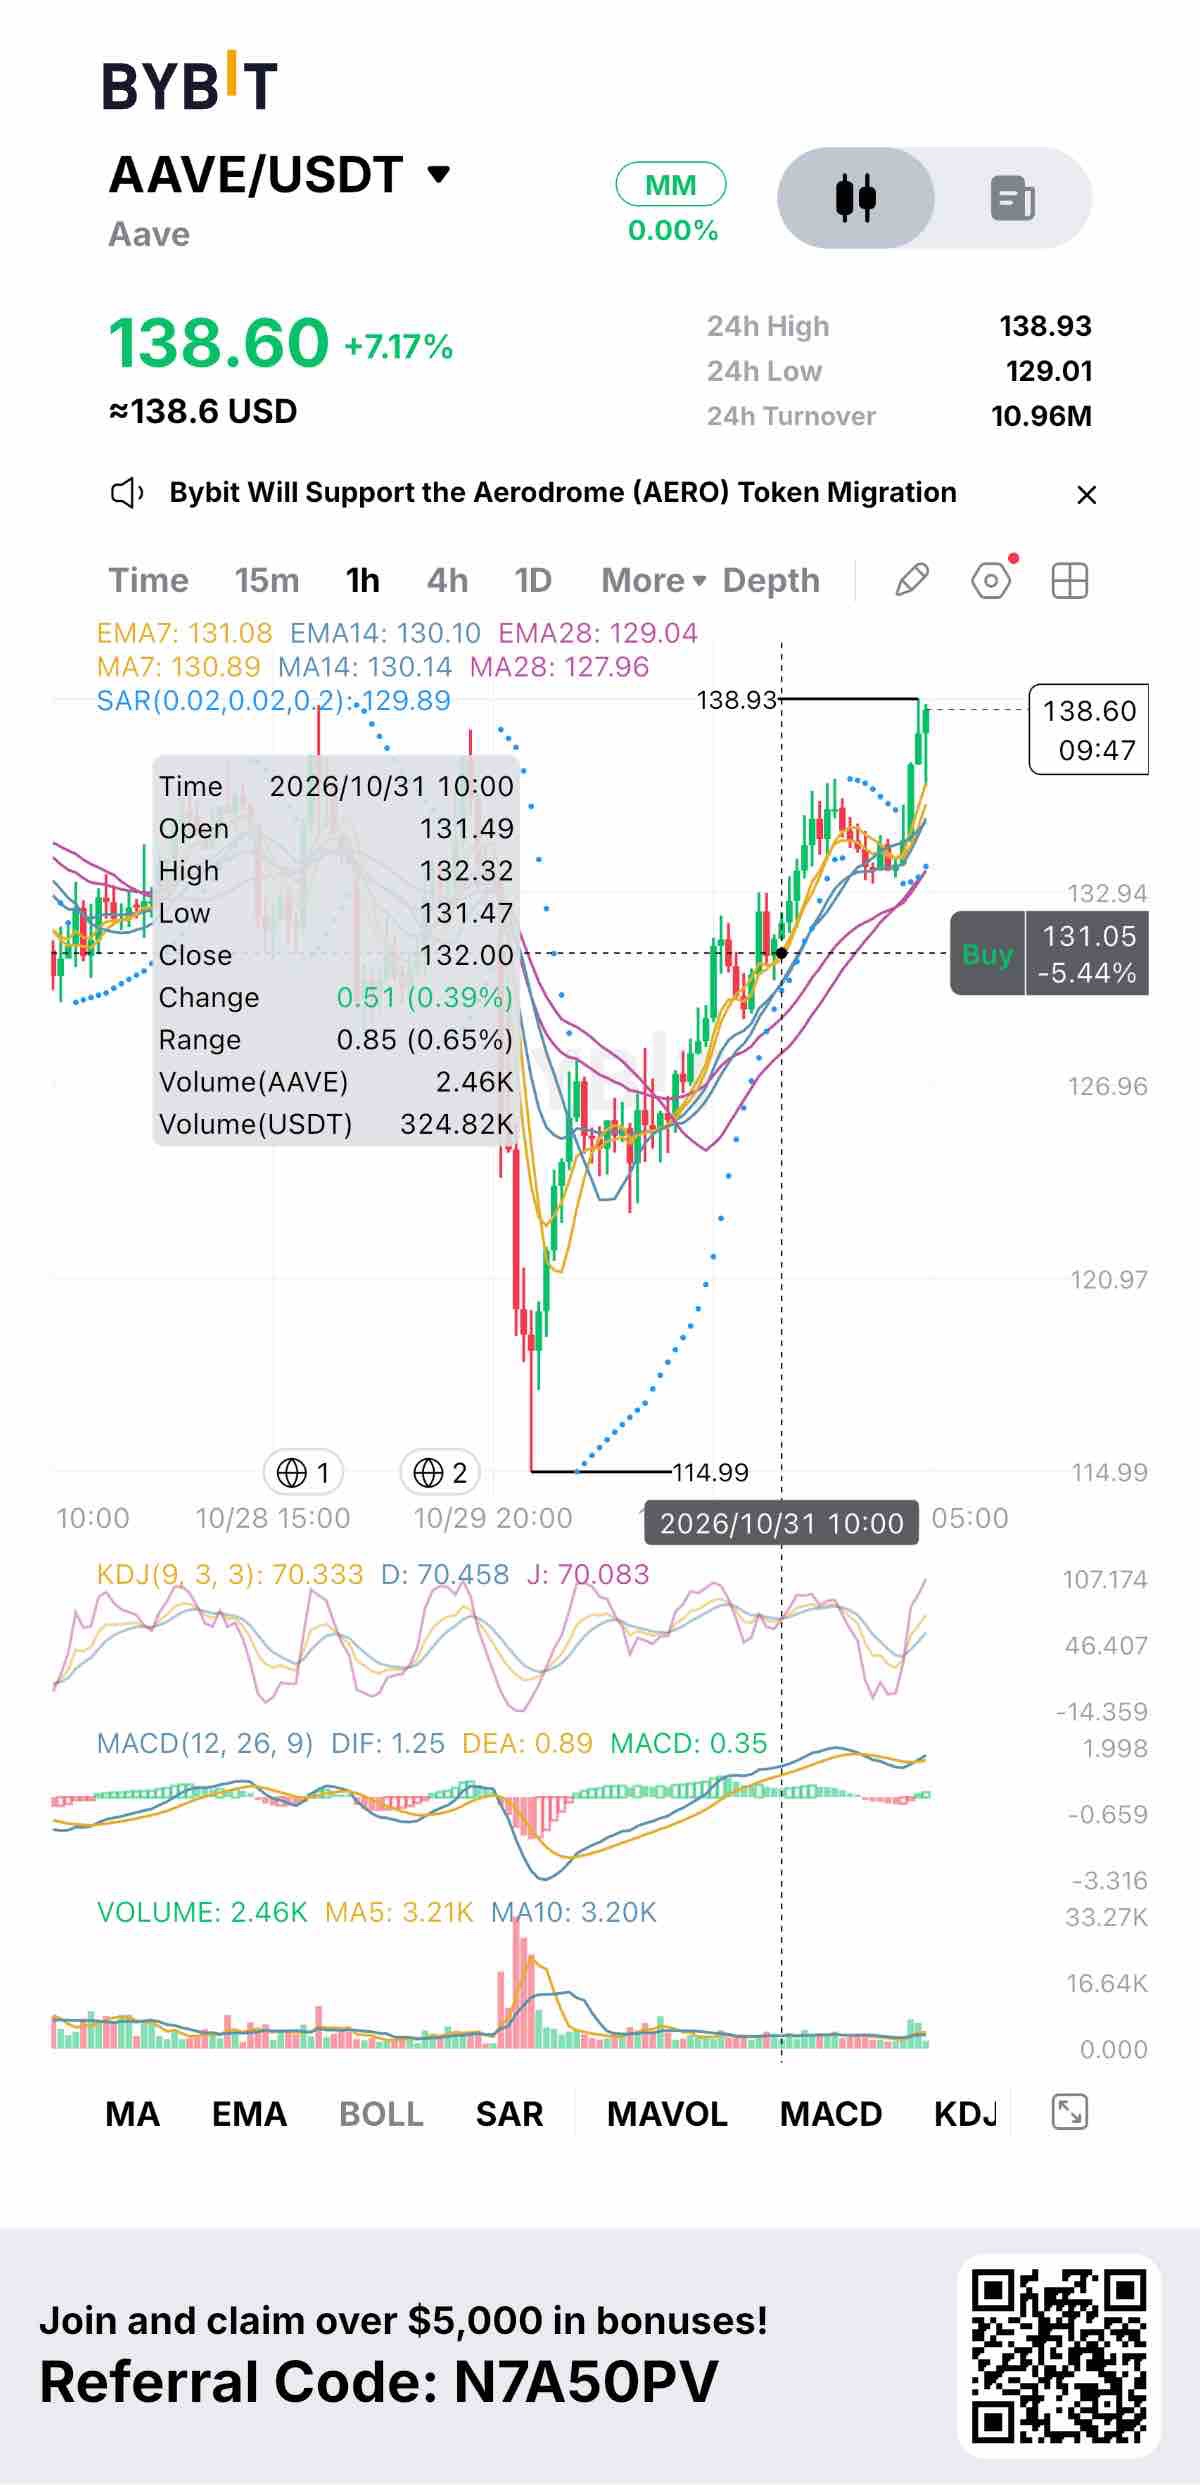
is one of the few tokens that got hit twice by the same event and still ended up above where it started. First, the attacker sold 127,953 AAVE for about $14M, and the token dropped around 11% to 114.99. Then Aave froze its V3 and V4 markets after a wallet tied to the exploit deposited $60M in USDT and borrowed about $44.6M in WETH against it. The contracts themselves weren't exploited, and the freeze was a precaution. The markets reopened within a day. Since the low, price has climbed about 20% and sits around 138, roughly 5% above its pre-crash level. The seller is finished, the protocol worked as designed under stress, and the 200-day EMA at 126.6 was reclaimed quickly. On the 1h chart, MACD is positive, SAR is below price, and the last candle printed a fresh 24h high. The weakness is underneath. TVL fell about 19% in 30 days, V4 passes no revenue to token holders yet, and the buyback has been quiet since June, so the "value accrual" story is still mostly a plan. Nine tokens also remain at zero loan-to-value, and nobody has settled who covers the loan taken against stolen collateral. So I see a strong bounce, not a trend change. The level that matters is 137.88, the 0.382 retracement. Holding it keeps 143.84, the 50-day EMA, in play. Losing it and then 133 would suggest buyers were just covering shorts. $AAVEUSDT #ByXIMPACT
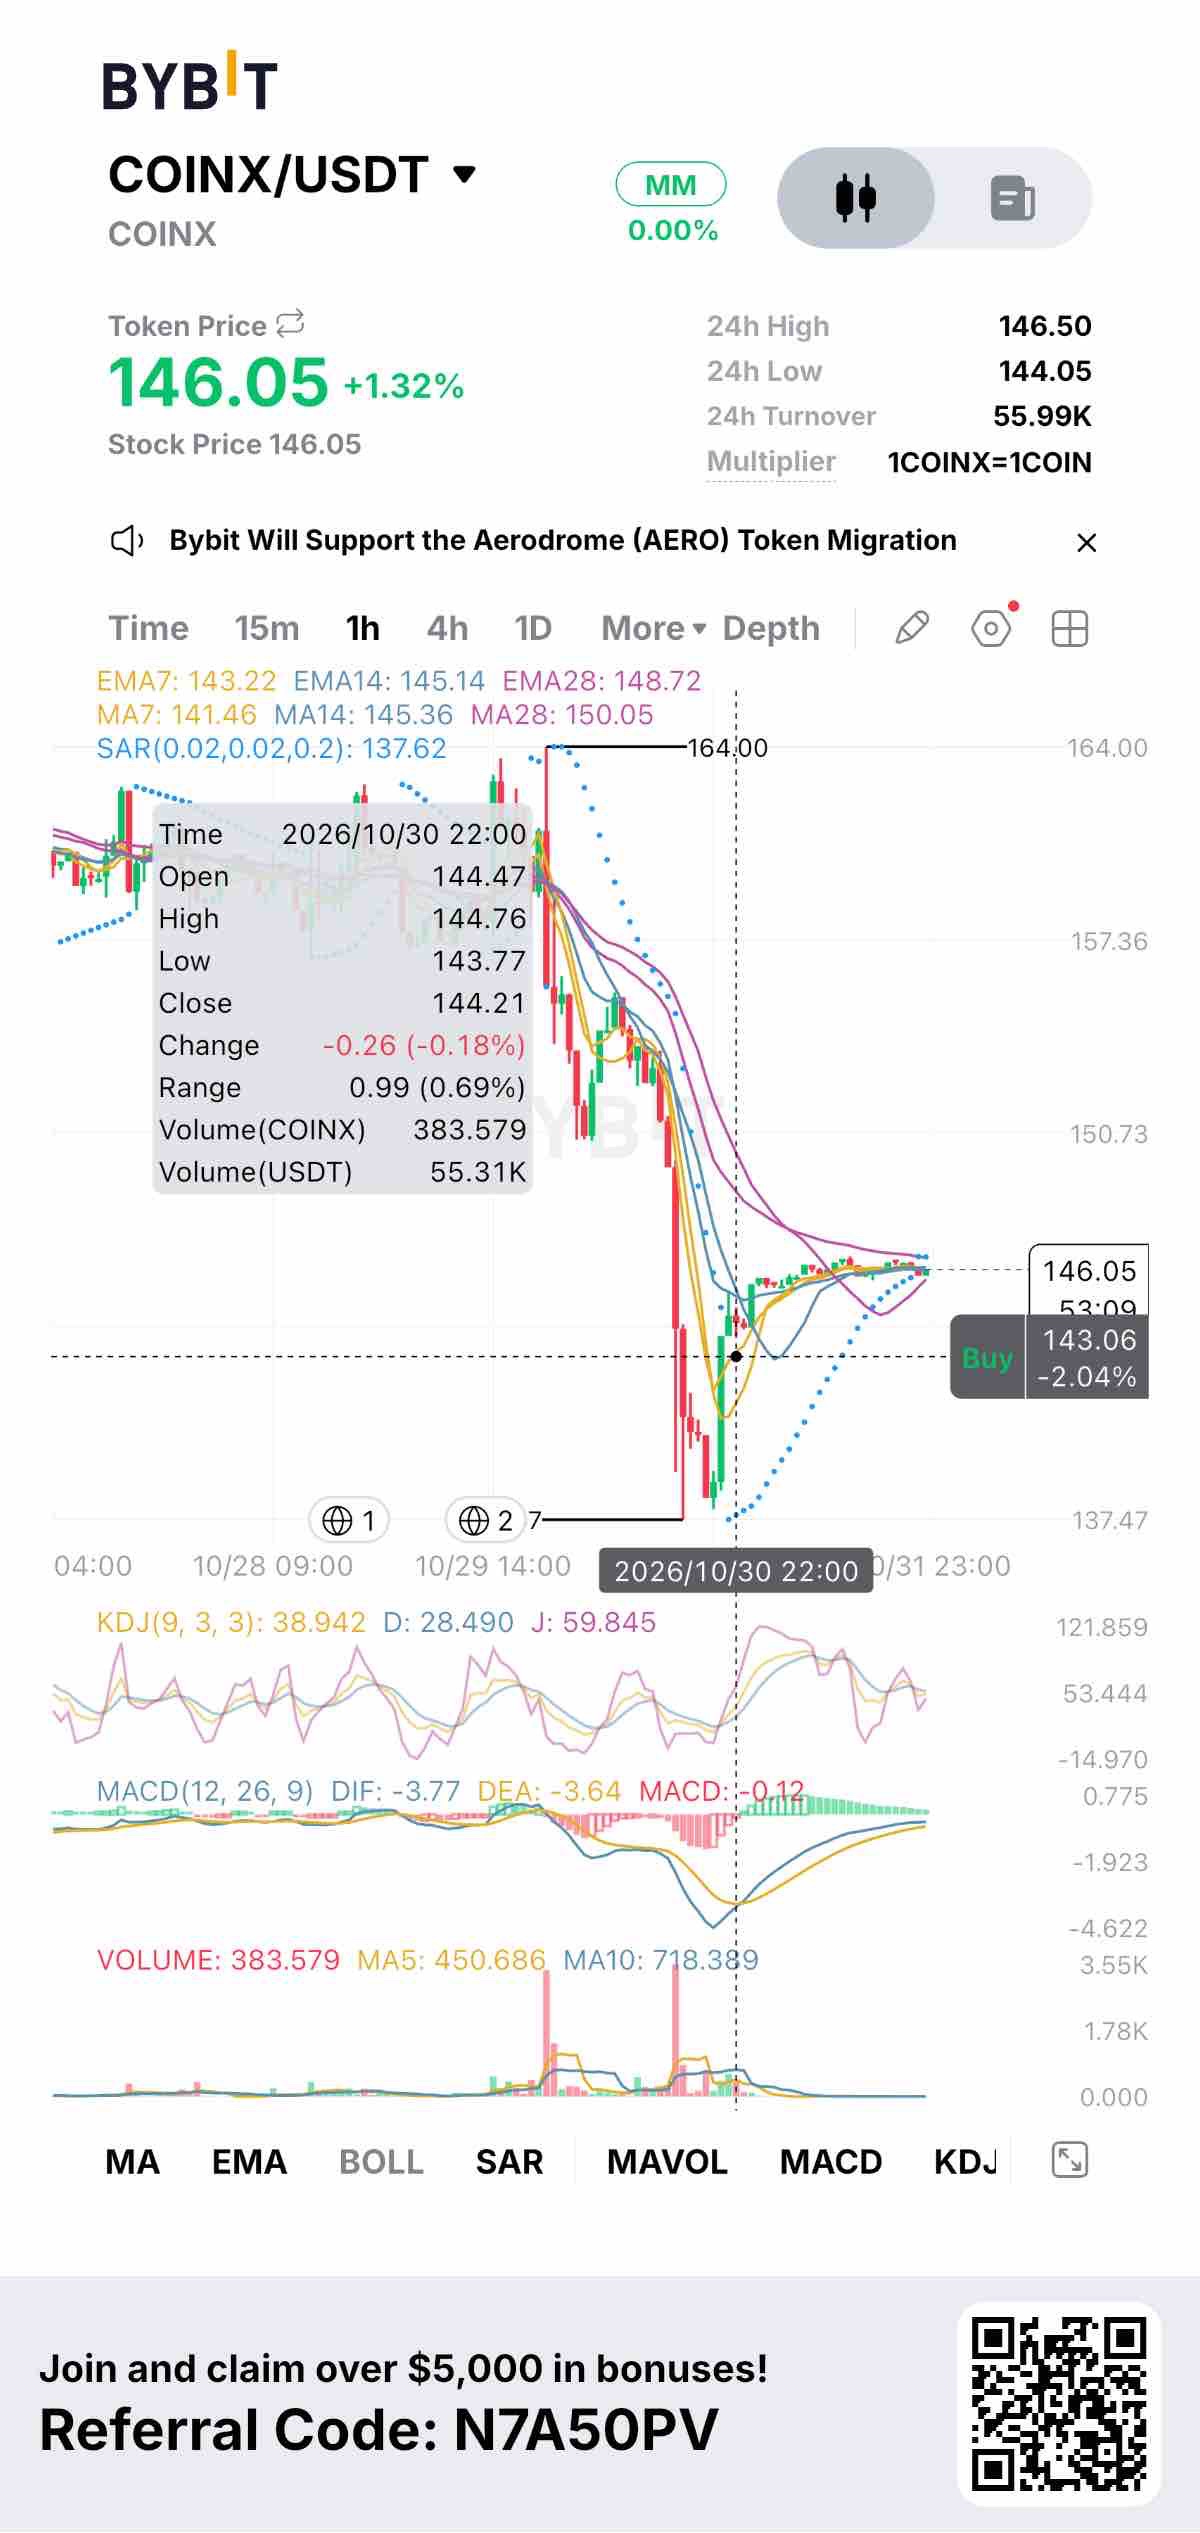
Coinbase's quarter looks strong in the headline and weak underneath, and the market priced the second part. Net income came in at $719M, yet $715M of it was gains on crypto the company holds. Adjusted net income was only $78M, revenue fell 35% year on year, and operating margin dropped to 5.1% from 25.7%. The profit followed Bitcoin's price. It didn't come from the business. The Q4 start explains the follow-through. Management said transaction revenue was only about $165M through Oct 25, and seven firms cut targets the next morning, from Barclays at $120 to Canaccord at $275. That spread tells you analysts can't agree on what a quiet trading market is worth. The cost cut, with 2026 expense guidance lowered, and prediction markets passing $200M in annualized revenue are the real counterweights, but neither offsets weak fees yet. On the 1h chart, COINX spiked to 164 on the release, flushed to 137.47 on heavy volume, and has since compressed into a narrow range around 144-146.5. The fast averages are reclaimed and the SAR flipped, but price is still under the slow averages near 148.7-150, and volume has dried up. That's a pause, not a recovery. One more thing to keep in mind: it's the weekend. Moves here come from a thin tokenized market while US stocks are closed, so Monday's open is when the real price gets set. Support is 143.2, then 141.5. Below that, the 137.47 low is back in play. Above, 150 is the area that has to be reclaimed. Bitcoin holding 76.3k matters as much as anything in the Coinbase report. #ByXIMPACT $COINXUSDT
Friday's tech rout hit Apple too, down 1.2% to $344.63, but Apple wasn't what the market was selling. The Nasdaq lost 2.8%, its worst day since June 5, after Alphabet, Amazon, Meta and Intel disappointed on AI spending. Apple posted no news of its own that day, and it still finished as the world's largest company at $5.03 trillion, ahead of Nvidia's $4.93 trillion. Skipping the AI capex race is why: the stock is up 27% this year, and free cash flow for the fiscal year is projected up 38% to $142 billion. Now the part worth reading before Monday. Bank of America, which rates Apple a Buy with a $370 target, cut its fiscal-2027 iPhone forecast to 247 million units from the Street's 260 million. Its reasoning is the staggered launch: the Pro, Pro Max and Duo arrived in September, but the base model and Air don't come until March. It also estimates memory costs could shave about 250 basis points off Apple's overall gross margin, putting the March quarter at 43.6-44.6% against a 47.7% consensus. BofA calls that pressure temporary, but it's a clear warning that December and March numbers may be too high. MoffettNathanson's Craig Moffett made the valuation point from the other side. At about 36 times forward earnings, Apple's earnings yield is roughly half what Treasuries pay. Investors have treated it as the safe mega-cap, and he questions whether that has gone too far. His view of the real competition is blunt too: the iPhone people already own. That's the setup into Monday evening's report, the first under Ternus. Expectations for September are around $113-114 billion in revenue and $1.98-1.99 in EPS, and BofA is just under that. What moves the stock is the December guide and gross margin, because Apple is at roughly 40 times trailing earnings against a five-year median near 31. Levels worth having in front of you: a daily close above $352.04 opens $361, and a close below $339 puts $330 in play. On the weekend perp chart, price sits under its short-term averages with momentum negative, consolidating around $345. Weekend prices can gap when the cash market reopens. Apple isn't being doubted on quality. It's being asked whether this price already assumes a perfect December. #ByXIMPACT $AAPLXUSDT
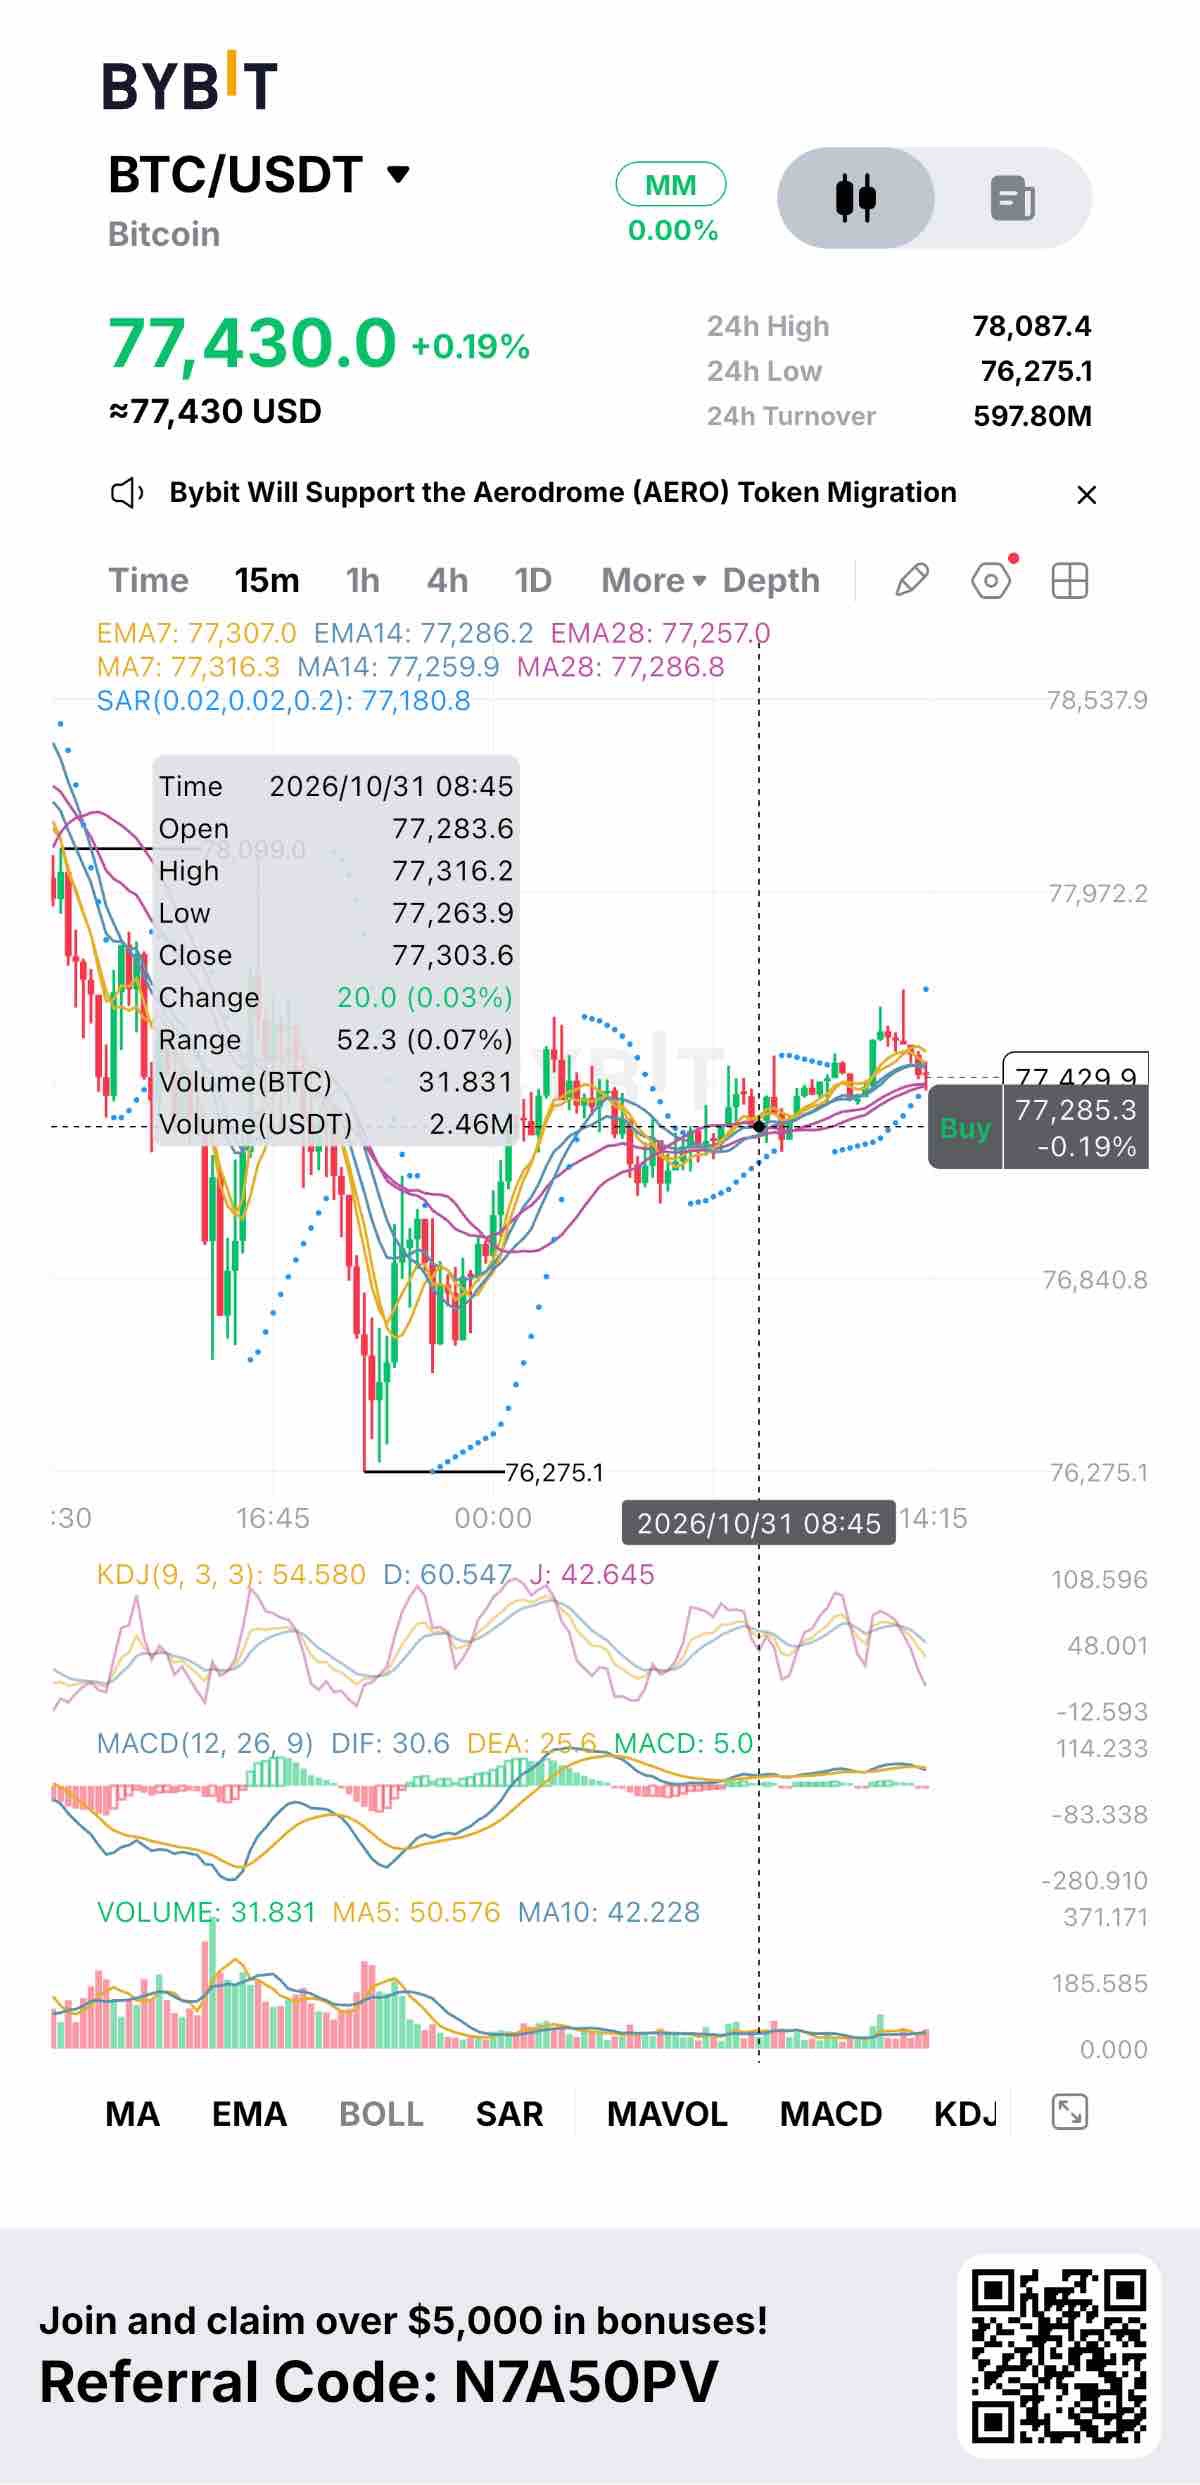
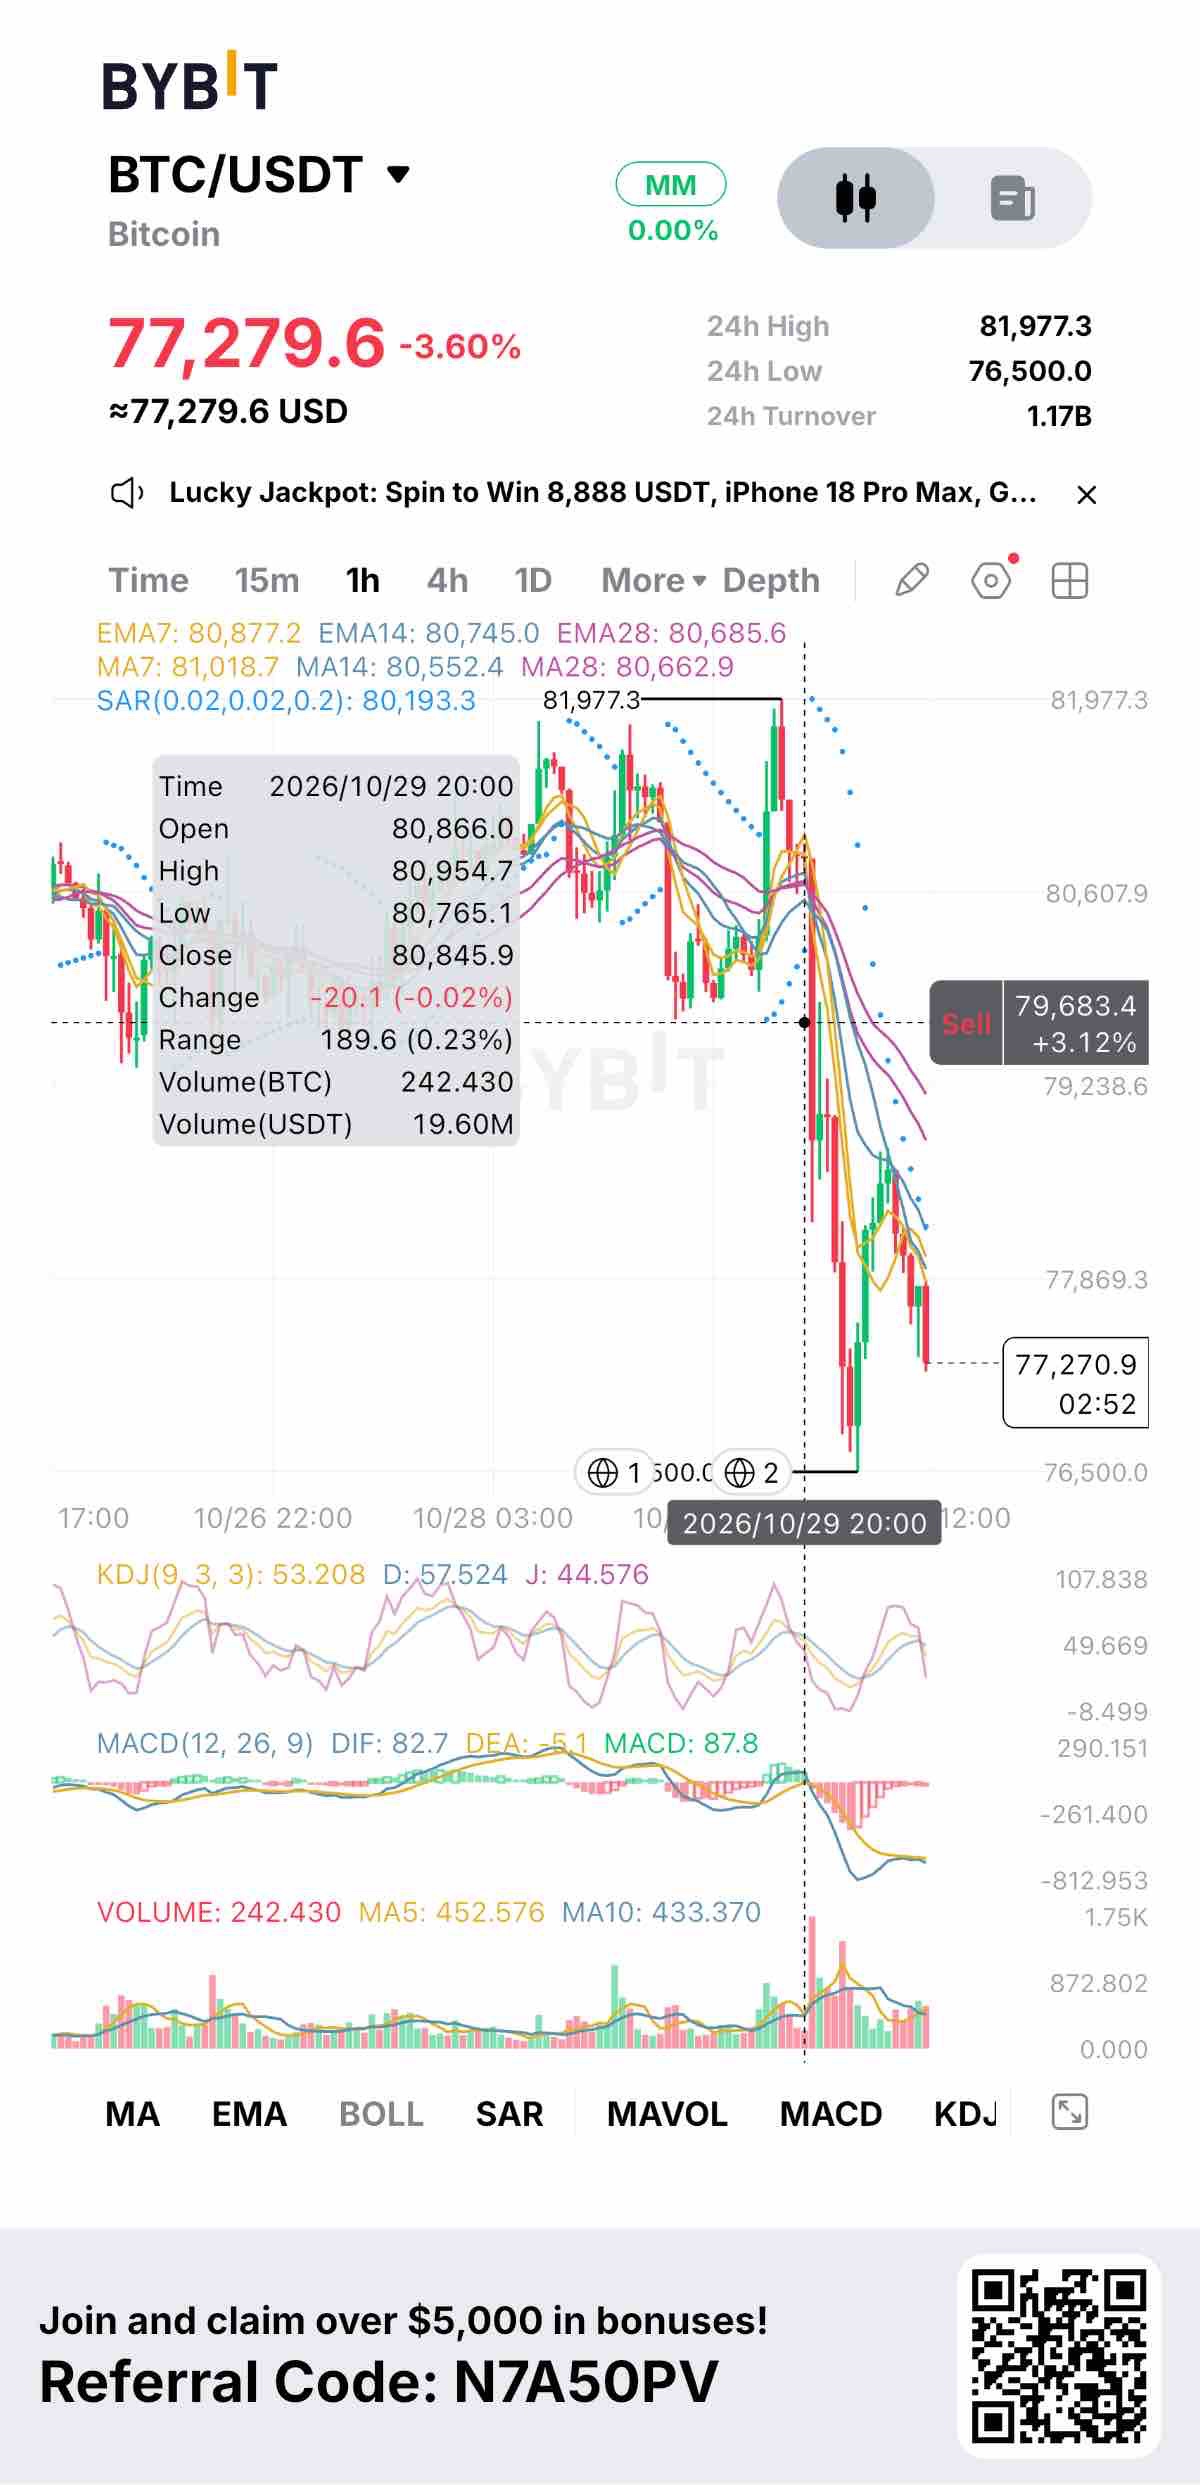
The largest crypto theft ever recorded happened this week, and Bitcoin only gave back a few percent. That says more about this market than the headline does. On October 29, Binance disclosed that about $6.3 billion had been stolen. TRM Labs attributes it to North Korea's TraderTraitor group, and roughly $3 billion is frozen. Binance has set aside over $6.34 billion to cover users and says withdrawals will return in phases. BTC dipped to about $76,300, with $1.5-1.6 billion liquidated, then recovered to the $77,000s. Before blaming the hack for the whole move, look at what else happened that day. Nasdaq fell around 3.4% on weak tech outlooks and AI-spending worries, Alphabet dropped 13%, and Intel about 26%. One analysis argues the hack itself cost Bitcoin only about 2%, and that the slow slide from September's $86,000 highs did far more damage. Bitcoin is now down 8.4% for October, a second straight down October in a month the market likes to call "Uptober." The part still unresolved is the stolen assets. About 18,270 BTC, roughly $1.4 billion at today's price, left Binance's hot wallet, and any stolen ETH that isn't frozen is a potential overhang if it gets sold on DEXs. Polymarket's pricing after the hack shows how fragile sentiment is: 82% for BTC staying above $76,000 on October 31, only 40% for $78,000, and 8% for $80,000. Today is also a Saturday, so volume has dried up and small moves look bigger than they are. Tonight's monthly close matters more than any candle in between. The levels I'm watching: $78,670 is the daily close that would show buyers are back, $76,300 is this week's low, and $75,000 is where the next test sits if it breaks. A bullish RSI divergence on the 4-hour chart suggests selling pressure is easing, but it's a bounce on thin volume, not a reversal. The next catalysts are Binance reopening withdrawals and what happens to the stolen funds. This is analysis, not financial advice. $BTCUSDT #ByXIMPACT
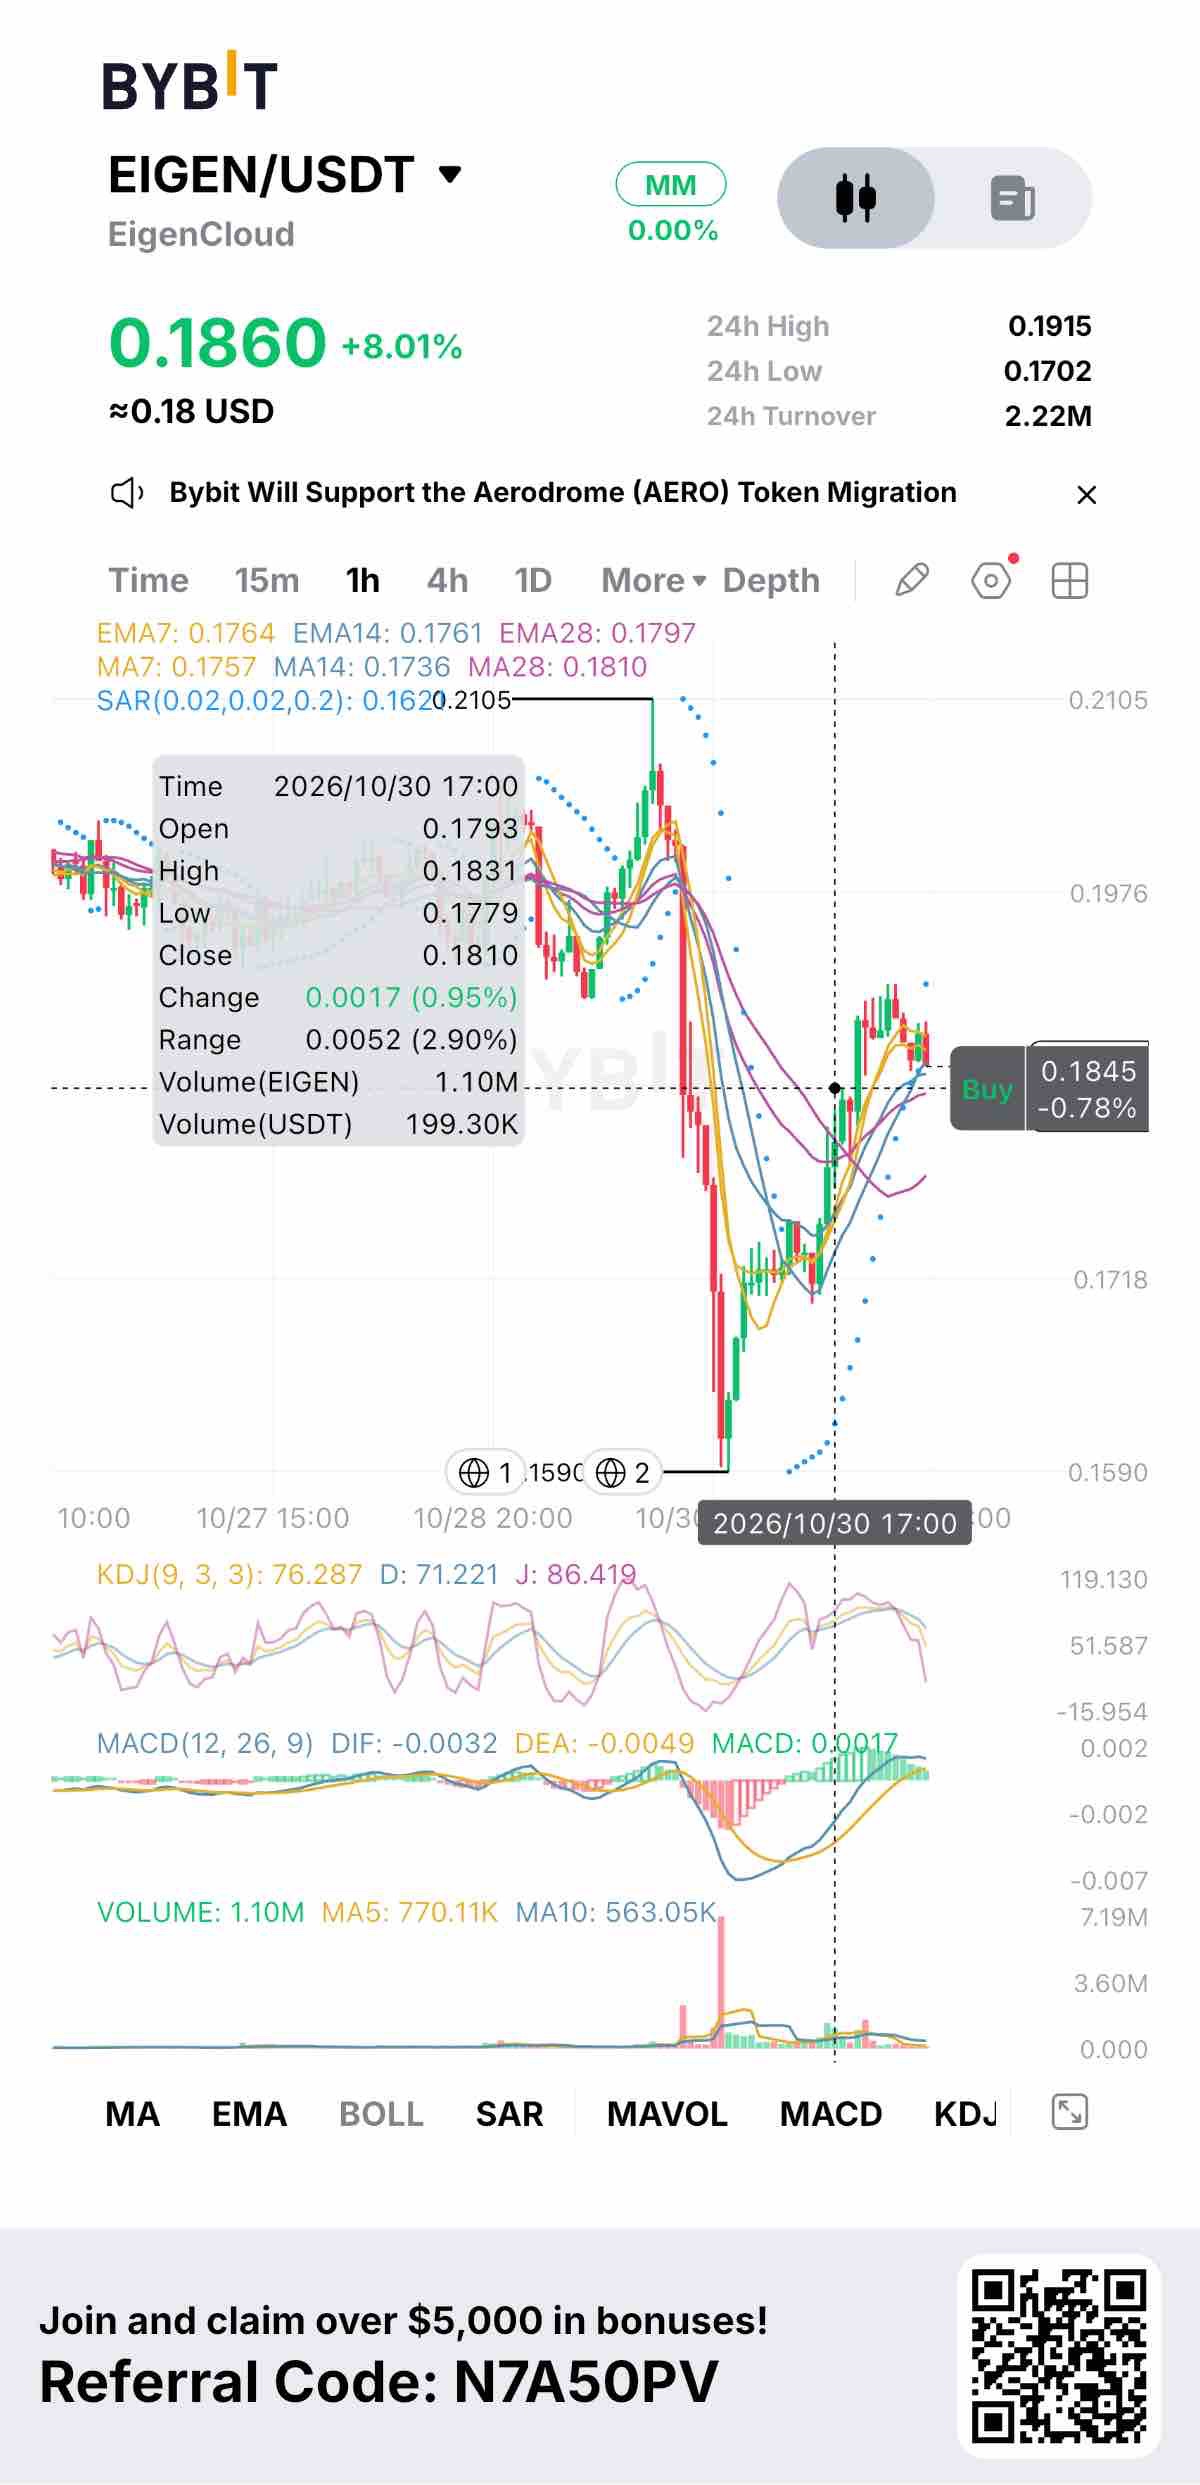
The Oct 29 flush took price from 0.2105 to 0.1590 on heavy volume, and buyers then pulled it back about 20% to the 0.19 area. The wick stopped just above the 0.148-0.149 cycle low, so that floor held. On the 1h chart, price is back above the 0.1810 and 0.1760 averages, the SAR has flipped below price, and MACD crossed up under zero. As a technical repair, it's tidy. What's missing is follow-through. Volume on the recovery is a fraction of the crash volume, and the latest candles are already pulling back from 0.1915. The real tension is between the project and the token. EigenCloud has shifted from restaking toward a verifiable cloud for AI and apps, and the proposal to route its fees into EIGEN buybacks gives holders a real mechanism, but only if fees grow enough to matter. Meanwhile the token sits roughly 99% below its 2024 high, and insiders unlock about 36.8M tokens every month. The next release lands Nov 1, around $6M. That's small against daily volume, but it repeats. I read this as a relief bounce at the bottom of a long range, not a trend change yet. 0.1810 is the level that keeps it constructive. Above 0.1915, the next areas are 0.1976 and 0.2105. If 0.1760 goes, the 0.1590 wick gets tested again. $EIGENUSDT #ByXIMPACT
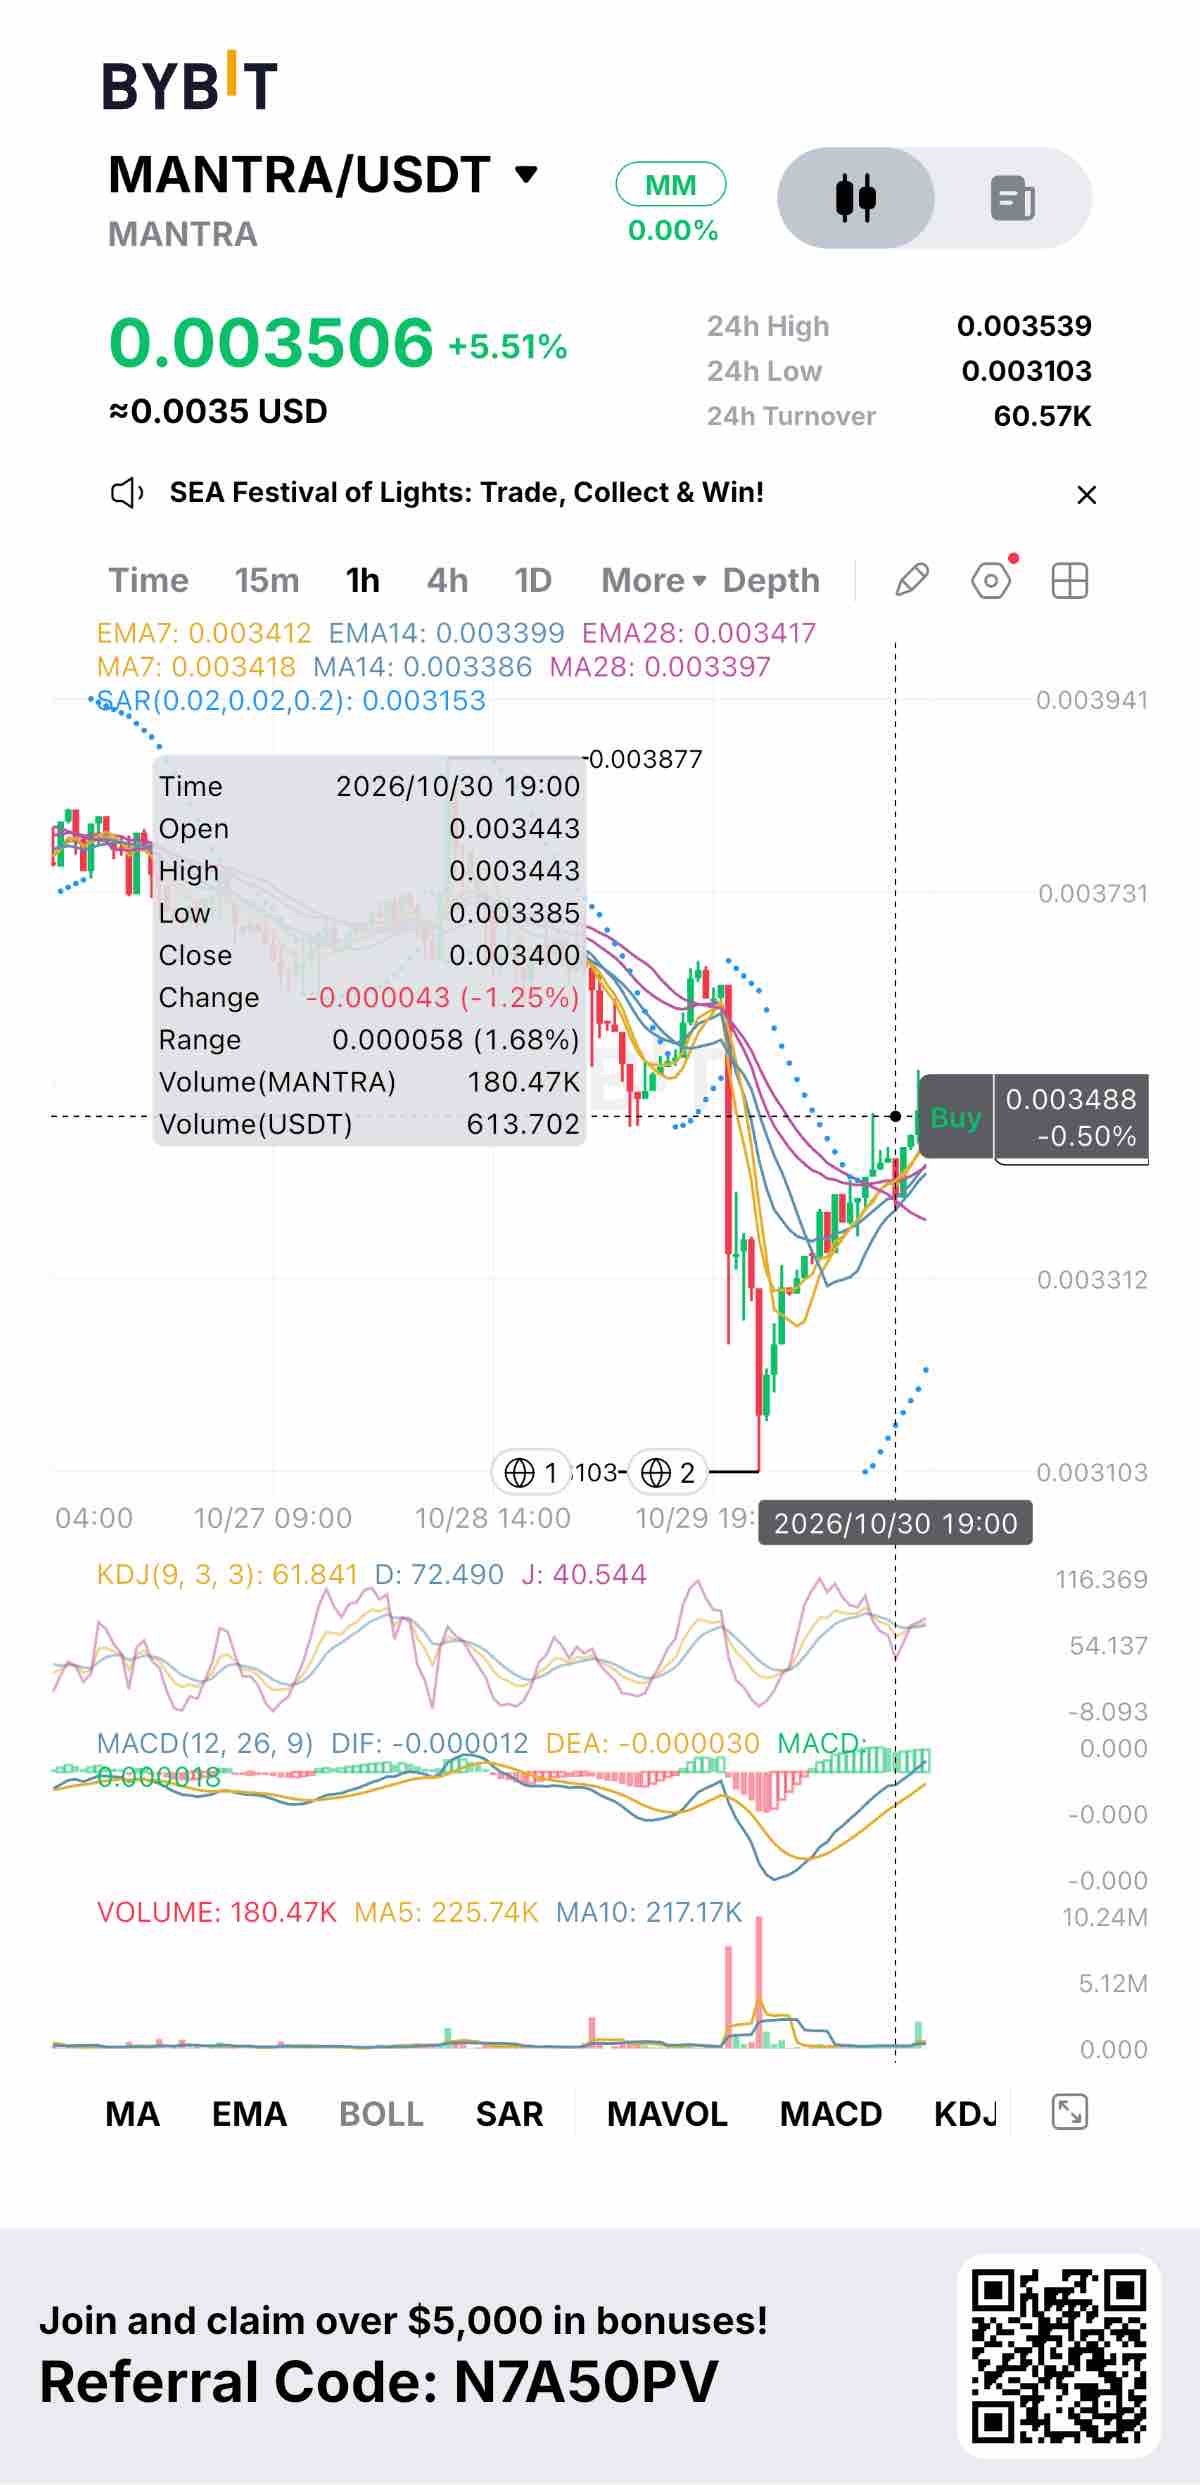
MANTRA's bounce looks better on the chart than it does underneath. The Binance-driven flush on Oct 29 pushed it down to 0.00310 on a big volume spike, and price has since recovered about 13% to 0.0035. It's back above the cluster of short-term averages around 0.00340, the SAR has flipped below price, and MACD crossed up just under zero. On the 1h chart, that's a clean short-term repair. The problem is participation. Daily turnover on this pair is only about 60K, so a 5% move says more about how little it takes to push the price around than about conviction. A real recovery would show volume expanding as price rises, and so far it hasn't. The backdrop makes that matter more. The token is roughly 86% below its March high of 0.0263, and August's chain halt after the EVM exploit is only a couple of months old. The team has published its post-mortem and the network is running again, but the Inveniam acquisition was meant to close in Q3 and I haven't seen a closing announcement. On-chain activity is also thin next to the RWA story the project tells. So I treat this as a relief bounce inside a downtrend until the market says otherwise. 0.00340 is the line to watch, and above it, 0.0037 is the area that has to be reclaimed. A break back under 0.00340 puts the 0.00310 low in play again. #ByXIMPACT $MANTRAUSDT
Apple touched a new high of $353.30 in the last day and has since given back about 3%. The pullback isn't the interesting part. The interesting part is that the iPhone story underneath it is more mixed than the foldable headlines suggest. The Duo is selling out and Apple reportedly asked suppliers for 30% more of them. But Nikkei Asia reported that Apple cut October component orders for the iPhone 18 Pro by 15-20% after raising prices $100, and Loop Capital's supply checks say Apple won't recover roughly 13 million iPhones it already cut from the second half. Counterpoint's early read had 18 Pro unit growth at just 3.1%. Put those together and demand looks less like it's rising and more like it's rotating, from a $1,199 phone to a $1,999 one that may be eating into it. That matters because of what Apple has already told us. It guided this quarter's growth to 9-11% against about 12% expected, and Tim Cook said memory costs rose in each of the last three quarters. Last report, Apple fell 7% even with record revenue, because Services came in at $30.7 billion against $31.3 billion expected and Greater China at $18.8 billion against $19.5 billion. Yahoo's summary of what's pressuring the stock now adds South Korean App Store rules to that list, a detail worth reading up on before leaning on it. The setup into Monday's report, after the close, is that the Street's average target is about $332 while the stock trades near $343. One of the harder-nosed calls, MoffettNathanson, sits at $283. What decides the reaction isn't the September quarter itself, it's whether holiday guidance shows the slowdown was supply or demand. The chart already reflects that caution. Price is under all three hourly moving averages, which cluster around $350, and the sell-off came on several times normal volume. The $341.5-$342 zone has held twice in five days, and below it the levels people are watching are $338.70, then $330. A record high, a Street average below the price, and a report with real questions about iPhone mix and memory costs. Monday is about guidance, not the headline beat. #ByXIMPACT $AAPLXUSDT
BTC: The Battle Between Market Fear and Institutional Demand Bitcoin’s current price action is telling an interesting story. The market is under pressure, but the bigger question is whether this weakness represents a temporary liquidity shock or the beginning of a deeper correction. BTC has struggled to maintain the $80,000 level, shifting attention towards the $76,300 support region. If sellers push below this area with strong volume, the next important zone to watch is $73,000–$75,000. On the upside, reclaiming $80,000–$82,000 would be an encouraging development. A sustained recovery above this range could signal that buyers are gradually regaining control. There is also a fundamental factor worth watching. Institutional demand through spot Bitcoin ETFs remains an important part of BTC’s market structure. However, institutional participation alone cannot prevent corrections when broader market confidence weakens. Recent exchange-security concerns have added another layer of uncertainty, reminding investors that market sentiment can change quickly even when Bitcoin’s underlying network remains operational. My current assessment: • Short-term momentum: Bearish. • Key support: $76,300, followed by $73,000–$75,000. • Recovery confirmation: $80,000–$82,000. • Major upside resistance: $85,000–$87,500. I am more interested in how Bitcoin reacts at these levels than in predicting an immediate direction. A support breakdown and a successful recovery from a liquidity sweep are two very different market situations. Traders should not confuse one with the other. The question is: Are we approaching a stronger accumulation zone, or does BTC still have more downside before buyers step in? I’d like to hear how other traders are reading this market. $BTCUSDT #ByXIMPACT
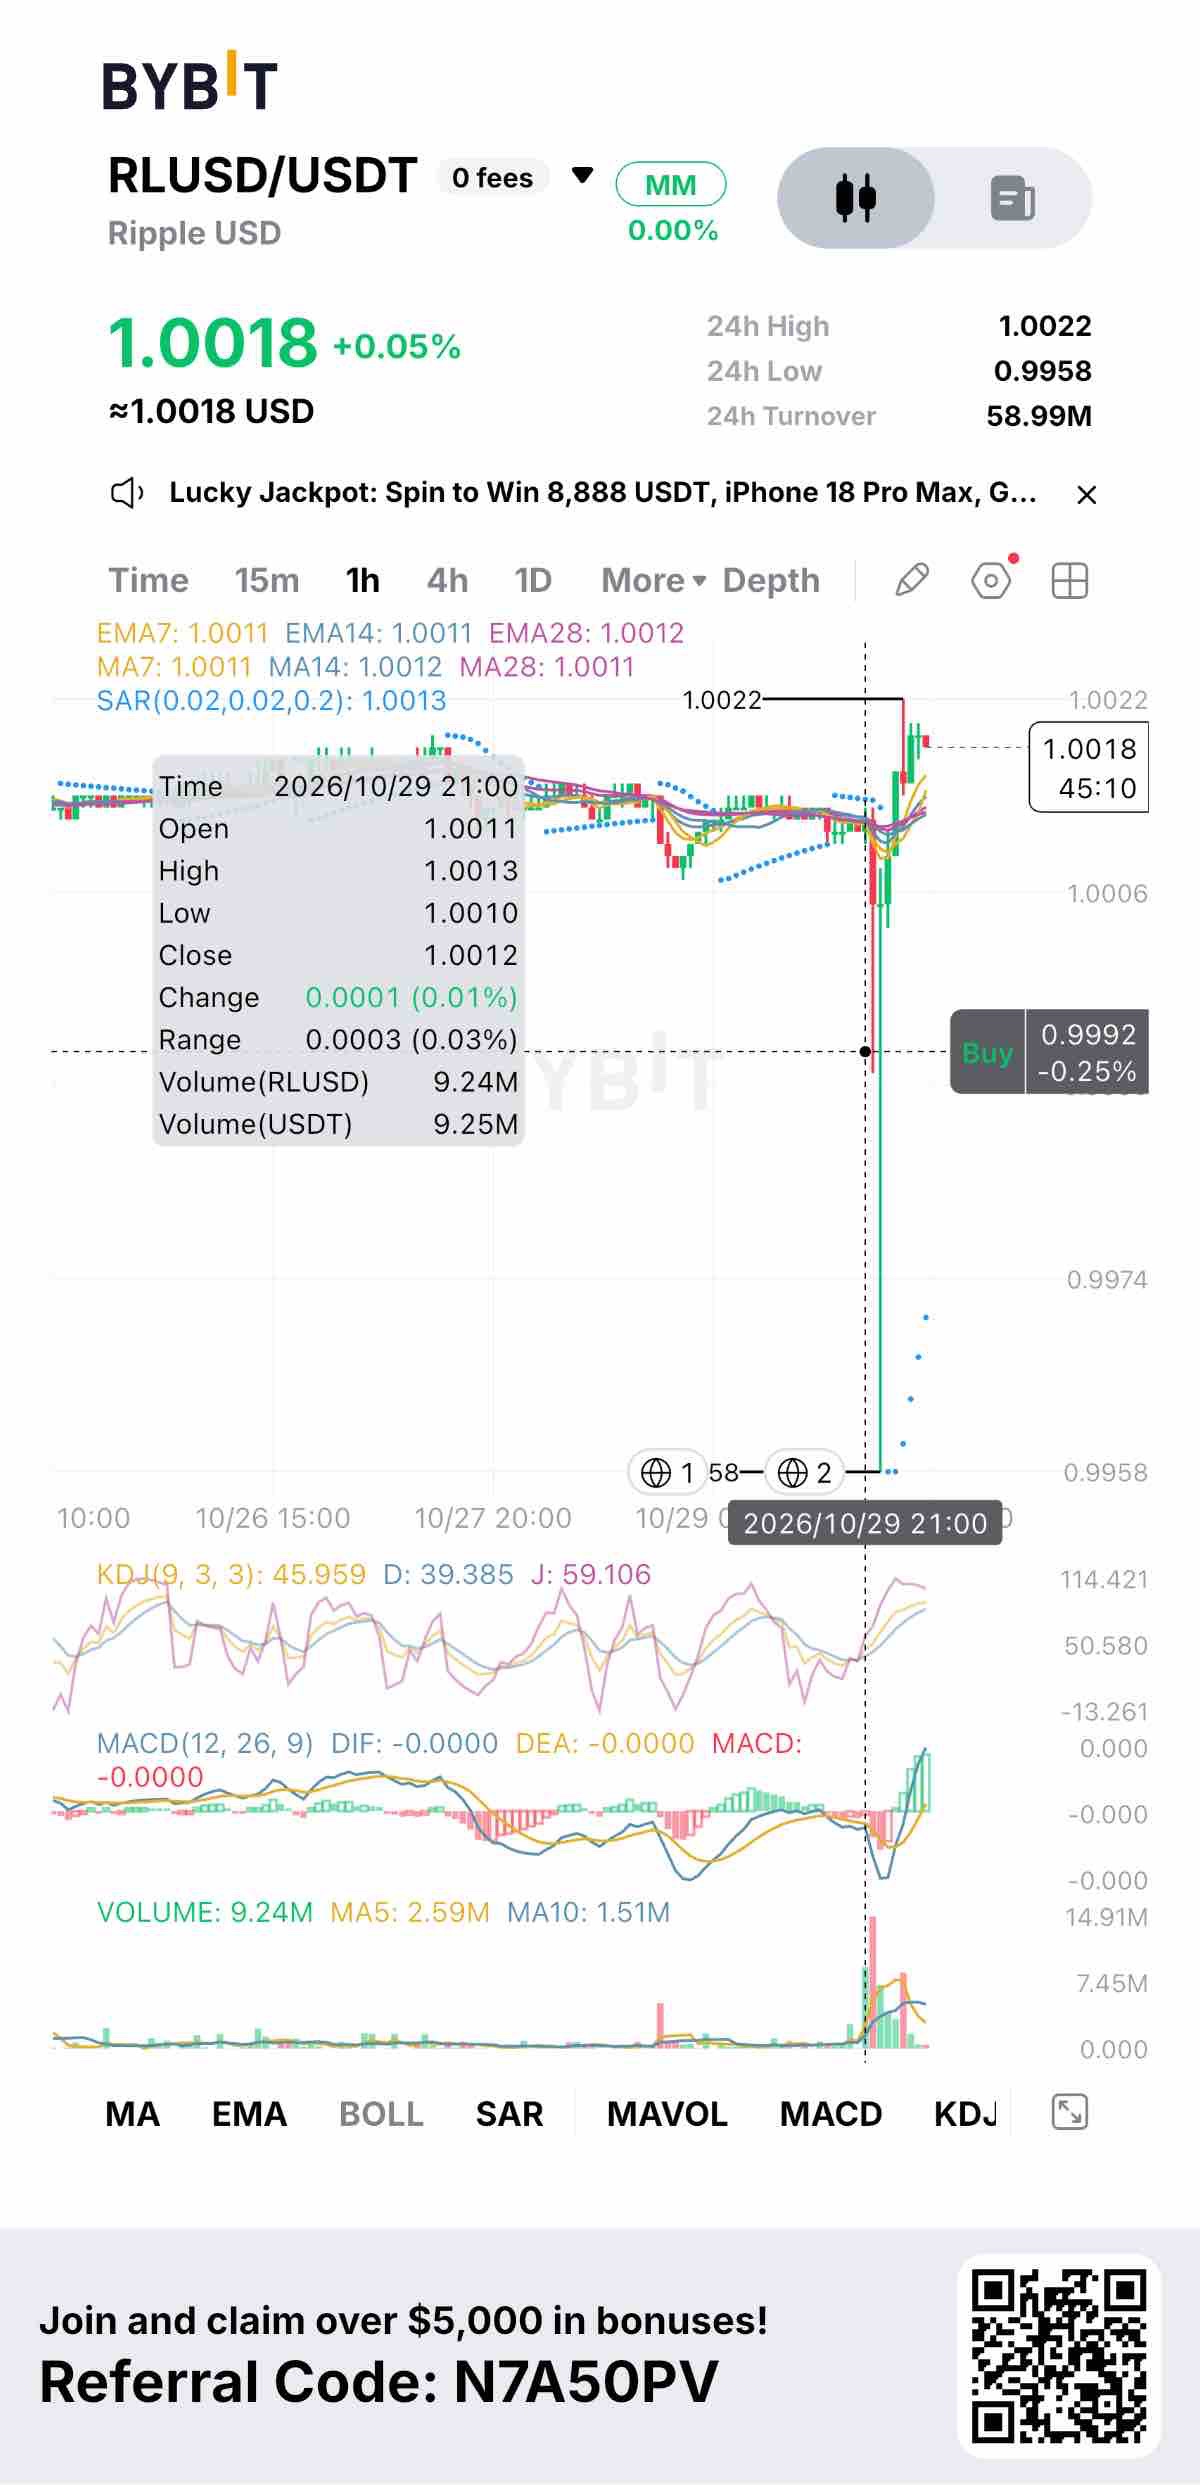
A stablecoin chart is supposed to be boring, which is why the RLUSD/USDT wick deserves a second look. In a single hourly candle the pair dropped to $0.9958, about 0.4% under the peg, on several times its normal volume, then snapped back above $1.00 almost immediately. The daily range is now roughly 13 times wider than it was a month ago. Before anyone calls it a depeg: USD-referenced pricing stayed near $0.9999 the same day, and I couldn't find a single report of RLUSD losing its peg. The likelier explanation is a large order hitting a thin book on this particular pair, on a day when ETH and XRP were each down 4-5%. That's my inference, not a confirmed cause, but the speed of the recovery points the same way. What makes the timing interesting is the week it landed in. On Monday, Ripple received final OCC approval for a national trust bank that will hold RLUSD's reserves and act as custodian. On Tuesday, Moody's assigned RLUSD an A2 rating, which Ripple describes as the first investment-grade rating for a stablecoin. The issuer targets 103% reserve coverage, mostly short-term U.S. government assets and cash held at BNY Mellon, though Moody's still lists bankruptcy risk as a qualification. On Wednesday, Coinbase began offering RLUSD to retail and institutional clients, with Robinhood planned before year-end. The growth numbers fit that story. Market cap sits around $2.6 billion, up 88% this year, and RWA.xyz shows RLUSD as the only stablecoin with more than $1 billion in net inflows over three months, while USDT shed about $2.5 billion. The odd part is what hasn't moved. XRP is down about 14% in October, near $1.28, and spot XRP ETFs saw zero net inflows on Tuesday and Wednesday. RLUSD circulates on Coinbase and Robinhood without anyone needing to buy XRP. Garlinghouse calls the two complementary, but so far XRP's price hasn't shown it. The wick tested something specific: how deep the book is on this pair. A bank charter, a rating and a Coinbase listing are meant to bring deeper liquidity, so the next stress candle will tell you whether that's happening. If it recovers as fast with less of a drop, the infrastructure is doing its job. $RLUSDUSDT #ByXIMPACT
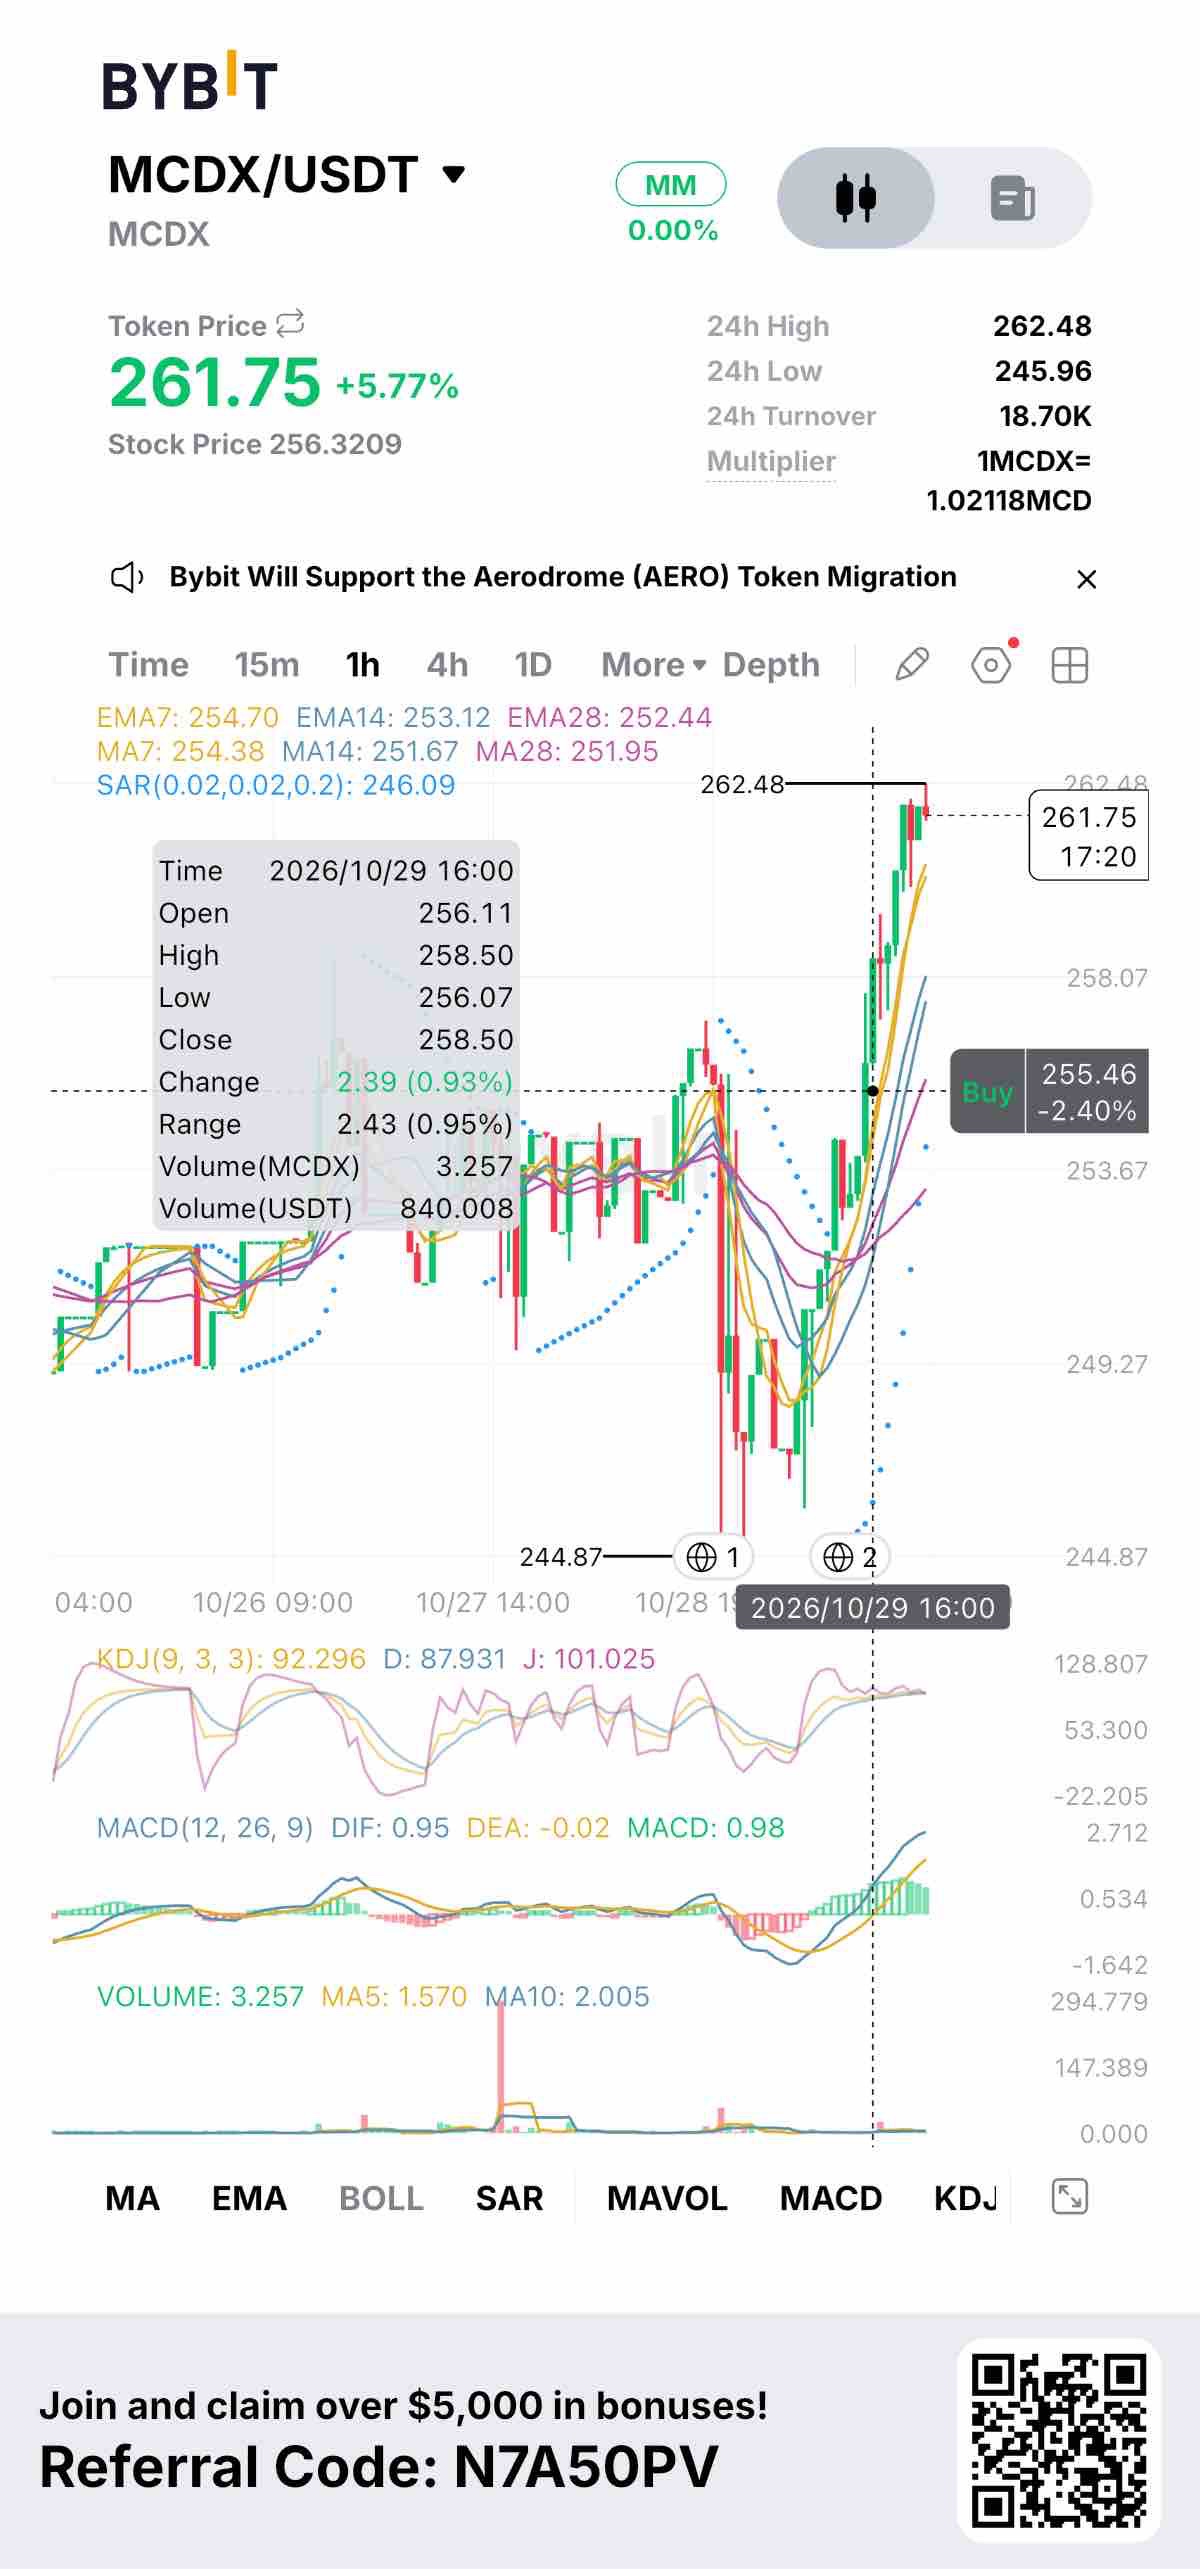
MCDX is up almost 6% today, and the stock it tracks is up about 2%. Before reading anything into that gap, look at how thin this market is. Only around $18,000 has traded in the last 24 hours, so the token can run ahead of McDonald's itself on very little money. The $5.50 difference between the token price and the stock price isn't a premium either. It's the 1.02118 multiplier built into the product, so don't mistake it for a signal. As for what's moving the stock, I couldn't find a McDonald's-specific catalyst today. A defensive bid after mixed tech earnings fits the timing, but that's my inference, and with a beta of 0.44, McDonald's usually moves less than the market, not more. The date that matters is Wednesday, November 4, before the open. Consensus is around $3.38 per share on roughly $7.3 billion of revenue, with a tough comparison against last year's strong third quarter. The more interesting detail is what happened after the last report. McDonald's beat in August, $3.38 against about $3.32 expected, and the stock still slid roughly 10% over the following ten weeks. A beat hasn't been enough for this name lately. What the market is really watching is U.S. same-store sales, which slowed sharply last quarter, along with how the value menu is holding up and what management says about margins. The company has also pushed its 50,000-restaurant target back a year, from 2027 to 2028. That's a small detail, but it tells you growth is arriving more slowly than planned. Valuation is reasonable rather than stretched, about 19 times forward earnings with a yield near 3%. Analysts are split almost evenly, with 17 at Strong Buy and 16 at Hold. Citi trimmed its target to $295 and kept its Buy. On your chart, the token dipped to $244.87 and snapped back above $262, with momentum indicators deep in overbought territory and very little volume behind the move. That reads as a sharp bounce, not a trend. A quiet, defensive stock rallying with no news, a thin token market on top of it, and an earnings report in six days. If you trade MCDX, know that you're exposed to both the company and the token's low liquidity. This is research, not financial advice. #ByXIMPACT $MCDXUSDT
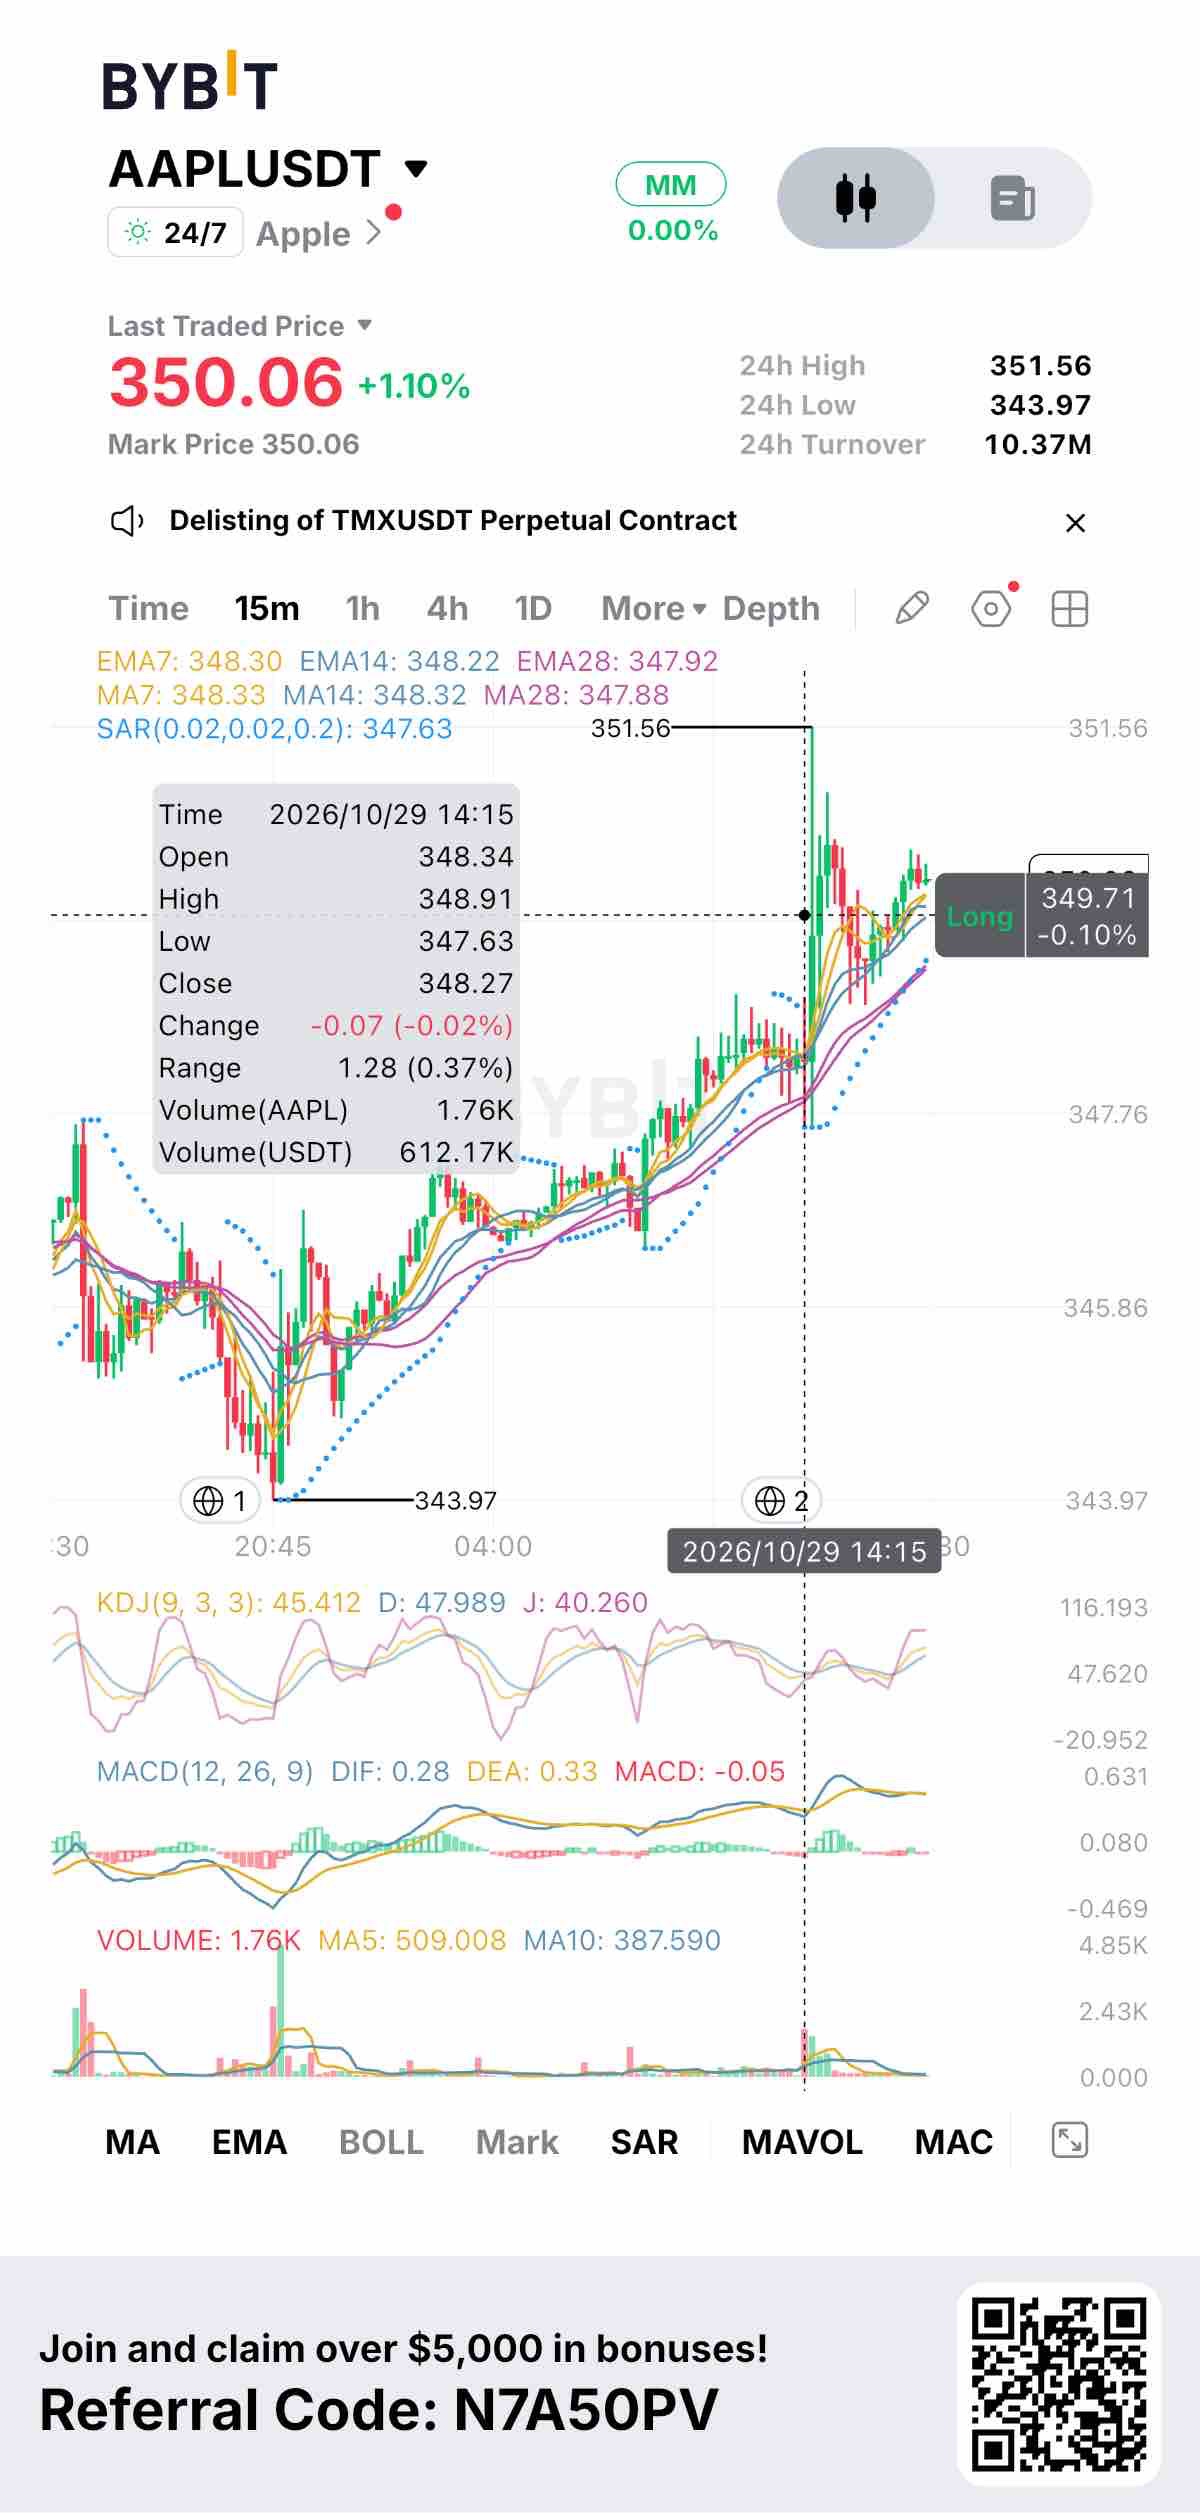
Apple is trading about 0.5% below its all-time high of $351.73, four days before the report that decides whether it breaks out or rolls over. Earnings date the report lands Monday, November 2, after the close. Some aggregators still list October 29, and those entries are stale. What's priced in - Consensus expects EPS of $1.99 (+7.4%), revenue of $113.4B (+10.7%) and iPhone revenue of $56.5B (+15.3%). - The Street's average target is about $337, below the current price. Goldman reiterated Buy today, citing the new product launches. - Morgan Stanley trimmed its target from $360 to $355 on October 1. - Per a 24/7 Wall St. piece from October 12, analysts made 14 downward EPS revisions against 7 upward ones over the prior 30 days. That's 17 days old, so check whether the trend has continued. The earnings-day pattern Apple has beaten estimates in its last eight reports, yet the stock moved an average of -1.53% on earnings day. Last quarter it fell 7.35% despite a 6.8% EPS surprise, then gained 5.25% over the next 30 days. Part of the recent margin strength came from one-time tariff refunds, which is why "beat" has meant less than usual. The bear case A Seeking Alpha analysis published today flags resistance at $355-$360, thin support until about $330, and bearish RSI divergence. It argues that a break of the uptrend could target $328, or $315 in a worse case. That's one analyst's view, but it matches the valuation picture of roughly 39x trailing earnings with guidance for 9-11% growth. Your chart - Price climbed steadily from $343.97 to a spike at $351.56, then settled around $350. - The EMAs are stacked bullishly but tightly bunched (348.30 / 348.22 / 347.92). - MACD is nearly flat (DIF 0.28 vs DEA 0.33), and KDJ is neutral at about 45. - That's an orderly uptrend with no momentum surge behind it. FXEmpire names $338.70 as key support and $344.57 as the prior breakout level. My read: the stock has run into the report without the Street's targets catching up, and Apple's own history says a good print isn't enough. The setup favors volatility either way over a clean continuation. The thing to watch isn't the EPS beat but whether guidance and memory costs ease the margin worries. #ByXIMPACT $AAPLXUSDT